

1. Introduction
Wine production is a highly variable agricultural endeavor with yield and quality variations driven largely by climate (Jones and Davis, Reference Jones and Davis2000). Understanding vintage quality variability and its influences are important in the economic sustainability of producers, consumer purchasing decisions, investor portfolio holdings, and researchers examining the myriad drivers of quality. However, the process of finding an adequate measure of vintage quality is a challenging task due to the paucity of information and the inherent subjectivity in assessing quality. One option is to use the yearly vintage charts published by internationally recognized critics, magazines, or organizations, which compare and contrast wines from different properties, different regions, or different vintages. Examples of influential vintage charts include the Wine Spectator Vintage Chart (Spectator, Reference Spectator2011) or the Michael Broadbent's Vintage Wine Companion (Broadbent, Reference Broadbent2007). A vintage chart assigns a score to each year representing an overall rating for the quality of the vintage typically for an entire region or a category of wine (i.e., red or white), and, in general, no information is provided on the scores given by the tasting panel to the individual wines tasted.
Vintage ratings have been used in numerous studies examining a wide range of economic, consumer, and scientific topics. For example, Wanhill (Reference Wanhill1995) found that vintage ratings were significant predictors of the hammer prices for a collection of vintages from a single chateau in Bordeaux. Other research by Landon and Smith (Reference Landon and Smith1998) examining Bordeaux wines found that reputation far exceeds current quality (ratings) in terms of the price premium achieved. Also in Bordeaux, Jones and Storchmann (Reference Jones and Storchmann2001) found differences in the sensitivity of ratings between cultivars with Cabernet Sauvignon fruit quality being more influential than Merlot on ratings. Schamel and Anderson (Reference Schamel and Anderson2003) found that regional reputations in Australia and New Zealand have become increasingly differentiated over time and that vintage ratings by James Halliday and Winestate magazine have a highly significant effect on the price premium paid by consumers. Exploiting a delay in the publishing of the ratings by Robert Parker in 2003, Ali et al. (Reference Ali, Lecocq and Visser2008) estimated the “Parker effect” to be 2.80 euros per bottle for Bordeaux wines. Gergaud and Ginsburgh (Reference Gergaud and Ginsburgh2008) studied the role of technology and terroir in wine quality, finding that technological choices in wine production affect quality much more than natural endowments (e.g., aspects of terroir). In addition, Gokcekus and Nottebaum (Reference Gokcekus and Nottebaum2011) found that consumer scores on wine quality tend to correlate more highly with certain experts, but that the correlation between consumer scores and expert ratings are less than those observed between the expert ratings alone.
A large area of study in vintage ratings includes the relationship between weather and climate. Research using vintage ratings has found that they accurately reflect the weather factors long known to determine wine quality and ultimately influences market or futures prices (Ashenfelter et al., Reference Ashenfelter, Ashmore and LaLonde1995; Ashenfelter and Jones, Reference Ashenfelter and Jones2012; Corsi and Ashenfelter, Reference Corsi and Ashenfelter2001). Examining numerous regions and chateaux in Bordeaux, Jones and Davis (Reference Jones and Davis2000) found strong connections between climate, grapevine phenology, fruit composition, and vintage ratings during 1952–1997. Examining vintage ratings for Napa Valley, Nemani et al. (Reference Nemani, White, Cayan, Jones, Running and Coughlan2001) also showed how Wine Spectator ratings affect price, with an average rating increase of 10 points (on a 0 to 100 scale), resulting in a 220% increase in price per bottle for the 1995 vintage. Furthermore, Jones et al. (Reference Jones, White, Cooper and Storchmann2005) found that vintage ratings for 27 wine regions worldwide have shown trends of increasing overall quality with less vintage-to-vintage variation and that vintage ratings are strongly correlated with growing season temperatures. In 24 wine regions in Australia, Sadras et al. (Reference Sadras, Soar and Petrie2007) also found that higher vintage ratings and a reduction in vintage-to-vintage quality variability were related to temperatures during the growing season. While varying some by the region and wine type, the average marginal effect of growing season temperatures shows that a 1.0°C warmer vintage results in an average 13-point increase (Jones et al. Reference Jones, White, Cooper and Storchmann2005). Examining climate variability mechanisms, Jones and Goodrich (Reference Jones and Goodrich2008) found significant variability in Wine Spectator vintage-to-vintage ratings and that much of it could be explained by conditions in the El Niño–Southern Oscillation and the Pacific Decadal Oscillation.
The analysis of such vintage charts reveals, however, that there is no widespread consensus on the vintage quality of a given region over the years. Each publisher has its own tasting panel, with its own criteria and perception of quality, which tastes a different set of wines, at different times and under different conditions. In addition, a variety of rating scales are used. Although some publishers use a 5-star rating scale, others use a 10-point or 20-point scale, and still others a 100-point rating scale (Cicchetti and Cicchetti, Reference Cicchetti and Cicchetti2009). The difficulty of combining the judgment of several vintage charts is even greater in view of the fact that some publishers use the same rating scale but with different criteria. For example, both the Wine Spectator Vintage Chart (Spectator, Reference Spectator2011) and the Robert Parker Vintage Guide (Parker, Reference Parker2011) use a 100-point scale in which ratings below 50 are not considered. However, while the former splits the top half of the scale into 7 intervals, the latter splits the same top half of the scale into 6 intervals (see Cicchetti and Cicchetti, Reference Cicchetti and Cicchetti2009). As a result, for the Wine Spectator, 95 points correspond to a rating in the top tier while for the Wine Advocate the same rating is in the second tier. Therefore, combining the ratings provided by a set of vintage charts into a single absolute score that represents the production quality of a vintage is a process that has to be based on a set of questionable and arbitrary assumptions. Such assumptions are necessary to define the process of converting every rating scale into a common range of values. Also, it would be difficult to generalize such a process to an arbitrary collection of vintage charts.
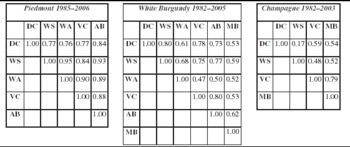
In order to assess the degree of consensus among the ratings provided by a set of vintage charts, Table 1 gives the correlation coefficient for the scores given by several vintage charts for the three wine regions that we use to illustrate our method (DC: Decanter; (Decanter, 2011); WS: Wine Spectator (Spectator, Reference Spectator2011); WA: Wine Advocate (Parker, Reference Parker2011); VC: Vintages (Spirits, Reference Spirits2011); AB: Addy Bassin's (AB) (MacArthur, Reference MacArthur2011); MB: Michael Broadbent's (Broadbent, Reference Broadbent2007)). For the sake of this example, the correlations were calculated with the original scores, that is, without normalizing the scores. The results show that for the Piedmont region, the correlations vary between 0.76 and 0.95, for white Burgundy between 0.47 and 0.80, and for Champagne between 0.17 and 0.79. The higher the correlation coefficient, the higher is the consensus among publishers; the results show that in some cases, the consensus is low.
Correlation Coefficients for the Scores Given by Several Publishers to Three Wine Regions

(DC: Decanter; WS: Wine Spectator; WA: Wine Advocate; VC: Vintages; AB: Addy Bassin; MB: Michael Broadbent).
Therefore, we propose the use of a rank aggregation method to combine a collection of vintage chart ratings into a ranking of the vintages that represents the consensus of the input vintage charts. The method takes advantage of the information available from a set of independent sources and combines it into an impartial ranking of a region's vintages over the years. The resulting ranking provides a relative measure of a given region's vintage quality. The method is general in the sense that it can be used with an arbitrary set of distinct input vintage charts, each having its own ordinal rating scale. We illustrate the method with the scores given by up to six different vintage charts to three different wine regions.
Several papers have been published using rank aggregation methods to study wine classifications. For example, Balinski and Laraki (Reference Balinski and Laraki2011) proposed the Majority Grade method, which can be used to induce a ranking of the wines tasted by a given panel of judges using the same classification language. In our context, this requirement is not always met, because several vintage chart publishers use different rating scales. Another example is the work by Quandt (Reference Quandt2006) that proposes a method based on statistical tests to analyze the significance of group tasting preferences, expressed as a consensus ranking, obtained by ranking individual rank sums, which were obtained by transformation of a judge's grades into ranks. However, the resulting ranking induced by the sum of the ranks does not respect the Condorcet property.
The method we present in this work has the advantage of making use of the information available in the form of vintage charts for a given wine region, each potentially using a different rating scale. Thus, we believe that the proposed method has the potential to be a useful tool for researchers who need an impartial measure of the wine production quality for a given region over the years, and, therefore, we make publicly available a software tool that implements the method (Borges, Reference Borges2011).
The rest of the paper is organized as follows. In the next section, we describe the proposed method; in the subsequent section, we illustrate its utilization with data from three wine regions; and in the final section, we discuss the results and present our concluding remarks.
2. Materials and Methods
We propose a method that combines a set of input vintage chart ratings for a wine region into a ranking of the vintages over the years. The combined ranking gives an ordering of the vintages’ quality that represents the consensus of the ratings given by the set of publishers’ vintage chart.
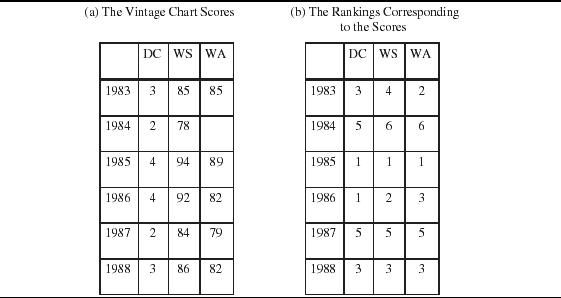
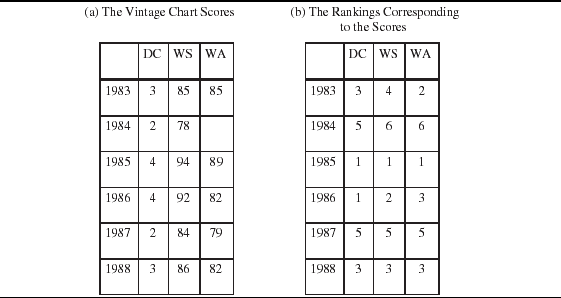
We describe the method by means of an example. In Table 2a, we give the scores for white wines from the Burgundy region between 1983 and 1988 according to three publishers, Decanter (DC) (Decanter, 2011), the Wine Spectator (WS) (Spectator, Reference Spectator2011), and the Wine Advocate (WA) (Parker, Reference Parker2011). The analysis of the scores reveals that the three publishers give the top score among the six years to the 1985 vintage. Also, the DC gives an identical score to the 1986 vintage, the WS gives the second-best score to 1986, and WA gives that vintage the third-best score . Thus, we can say that there is a consensus regarding the best year but not regarding the second-best year.
An Illustration of the Conversion of the Vintage Chart Scores (a) into Ranks with the Scores for White Wines from the Burgundy Wine Region (b)
Note: Acronyms are as given in the note to Table 1.
2.1 Converting the Vintage Charts’ Scores into Rankings
The goal of the method is to induce a relative measure of the vintages’ quality that takes into account the information given by the publishers in an impartial way. One possibility could be to convert the scores given by the publishers into a common scale and to compute the average score. Such a process would require some undesirable and arbitrary assumptions on which scores in one scale correspond to which scores in another scale. We propose to convert the scores given by each publisher into a ranking of the vintages. Therefore, for each publisher we construct a ranking of the years in which the ranks represent their preferences with respect to the vintages’ quality, originally expressed as a score. The year with the highest score is assigned the top rank and the year with the lowest score the bottom rank. If the same score is assigned to two different years, such years are assigned the same rank (e.g., 1985 and 1986 from DC in Table 2). We note that the rank of a given year gives the number of years that are better than it plus one. Thus, because in the ranking for DC two years are tied for first place, the number two is not assigned to any year, while years 1983 and 1988 are tied for third place. The option to give years the same ranking instead of the common practice of adopting the average rank is due to the more natural interpretation in our particular context of having two years tied for first place than of having two years tied for 1.5th place. However, the proposed method can be modified to adopt the average rank without any loss of generality.
As a result of this first step, we obtain a set of input rankings such that each ranking represents an ordering of the vintages’ quality over the years as perceived by the corresponding publisher's tasting panel. Table 2b gives the rankings of the years corresponding to the scores given by each of the publishers.
The only assumption of this first step is that each vintage chart's publisher uses, at least, an ordinal scale and has evaluating criteria that remain stable over the years, in such a way that it is possible to compare the perceived quality of the vintages by comparing their scores. We believe that this is a reasonable assumption.
We also note that vintage charts occasionally have missing values. Missing values occur if there are years for which a score is not provided. Several methods are available to deal with missing values. One option is to assume that if a provider did not rate a given year it was because it was decided that the perceived quality of the corresponding harvest was not sufficiently good to justify the tasting. In this case, such years are assigned the bottom rank. In the context of vintage charts, such an assumption is often reasonable because when some vintages are perceived as uninteresting at early stages, the publishers decide that its quality does not justify the effort associated with its evaluation. For example, the description of the Wine Advocate vintage chart, (Parker, Reference Parker2011) refers to the fact that wines with a score below 50 are not reviewed, and Vintages (Spirits, Reference Spirits2011) states that wines with a score below 4 are not rated. In the example of Table 2, WA did not provide a score for the year 1984. A closer look shows that 1984 gets low scores from the other two publishers, and therefore it is reasonable to assign the bottom rank to 1984.
In cases in which the assumption of a missing year being the lowest quality is not defensible, traditional methods can be used to deal with missing values. More precisely, if most of the publishers do not provide a score for a particular year that year can be removed from the analysis, because there is insufficient information to rank that year. In the case in which a publisher does not provide a score for most of the years, this publisher could be removed because it does not provide sufficient information for the method. Finally, there is the possibility of filling one particular missing value with the average ranking of the other available publishers for that particular year. In this case, it may be necessary to re-rank the years below the year that was filled with the average rank. We note, however, that the method we propose is able to handle any of the above options without any loss of generality.
2.2 Aggregating the Input Rankings into a Consensus Ranking
The rank aggregation problem is defined as the task of combining many different rank orderings into the ranking that is closest to the set of input rankings (Lin, Reference Lin2010). This is a classic problem from voting theory that has gained interest recently because of its application to the problem of combining the search results of a collection of web search engines.
In his work, Arrow (Reference Arrow1950) has shown that when voters have more than two alternatives, it is not possible to convert the individual rank preferences into a ranking that meets a set of reasonable axioms. Some methods are available for combining ranks that meet some of the axioms.
A simple way to approach the rank aggregation problem is to assign each vintage year a number of points equal to its rank in the input ranking of each publisher. The resulting total score of a vintage year is the sum of the individual ranks, thus, the vintage years can then be ranked by their total scores. This method is equivalent to computing the average ranking, however, the average of the ranks is known for not respecting the Condorcet property (Condorcet, Reference Condorcet1785), as described in the following example.
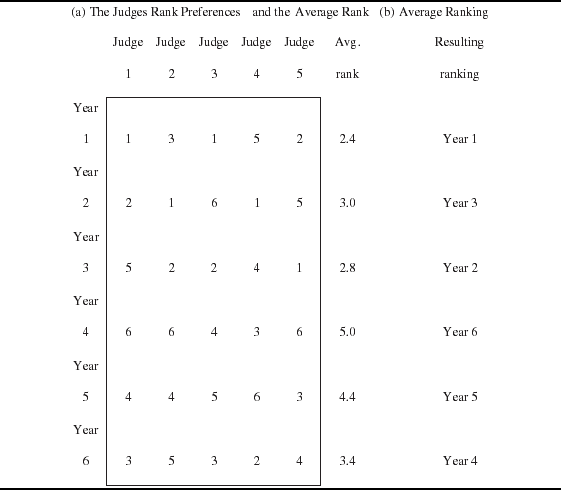
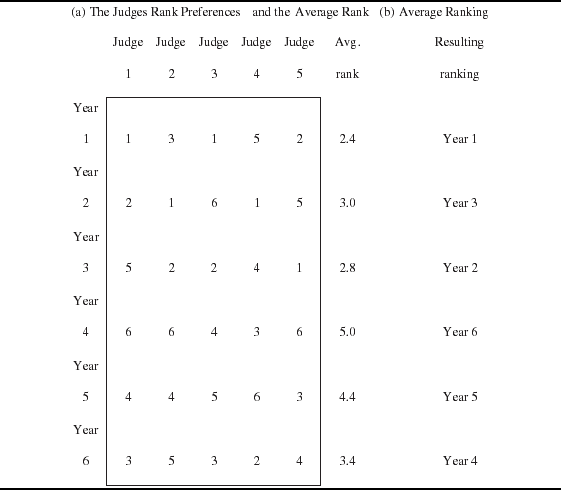
The Condorcet property states that if an alternative X is preferred by more judges than the alternative Y, in the optimal ranking the alternative X should be ranked higher than alternative Y. In Table 3, we give an example to illustrate that the average ranking does not respect this property. In Table 3a, six years are ranked by five distinct judges, and the average rank for each of the years is given. In Table 3b, the ranking of the years when ordered by the average ranks is given. In the resulting ranking, year 3 is preferred to year 2 because it has a lower average for the ranks. However, the inspection of the ranks provided by the judges reveals that three out of the five judges preferred year 2 instead of year 3, thus, according to the Condorcet property year 2 should be preferred to year 3.
An Example to Illustrate the Limitations of Using the Average Rank to Induce a Ranking of the Years
One alternative to the average ranking could be the majority grade method proposed by Balinski and Laraki (Reference Balinski and Laraki2011), in which the goal is to find a final grade for each element, given the individual messages of all judges, that corresponds to the highest grade approved by an absolute majority of the judges. This method, however, has the limitation in our context of relying on a language of evaluation that is common to all the judges of a jury conducting the evaluation. That is not the case of vintage chart ratings provided by a set of different publishers.
Here, we propose the use of a method that meets the Condorcet criterion (Condorcet, Reference Condorcet1785). Methods based on the Condorcet criterion rank each candidate by measuring the number of competitors that would be beaten by it in a two-candidate election.
In order to respect the Condorcet property, the rank aggregation problem has been defined as the task of minimizing the number of pairwise disagreements between the input rankings and the resulting ranking (Kemeny, Reference Kemeny1959). A disagreement between an input ranking and the final ranking occurs if two years are ranked in a different order in the two rankings. For example, if one of the rankings prefers 1986 to 1983 and the other ranking prefers 1983 to 1986, we say the two rankings disagree with respect to the pair 1983 and 1986. This formulation is known as the Kemeny rank aggregation (Young, Reference Young1988), and it has been shown to verify the Condorcet property.
We now give a definition of the rank aggregation problem in our context. Consider a set of input rankings from K publishers, R 1, …, R K, each with an ordering of the same n elements, and the resulting combined ranking R c. We let R k(i) for i:1, …, n be the rank of according to the ranking provided by publisher k and R c(i) be the ranking of according to the combined ranking. The distance between an input ranking and the combined resulting ranking is given by the Kendall-tau metric, which is defined as:

where
 if i and j are in the same order in R k and R c
and
if i and j are in the opposite order in R k and R c.
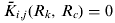 if i and j are in the same order in R k and R c
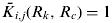 if i and j are in the opposite order in R k and R c.
In the case in which there are no ties in the rankings, the Kendall-tau metric can be normalized to the [0,1] interval by dividing it by n(n−1)/2, in which 1 implies maximum disagreement. The rank aggregation problem seeks to minimize the normalized measure (Adler, Reference Adler1957).
Because the problem is NP-hard, there is no algorithm for finding the optimal solution in polynomial time (Schalekamp and Zuylen, Reference Schalekamp and Zuylen2009). However, several algorithms are available for finding close to optimum solutions. To illustrate the process, we adopt the Quicksort with local search optimization approach described in Schalekamp and Zuylen (Reference Schalekamp and Zuylen2009).
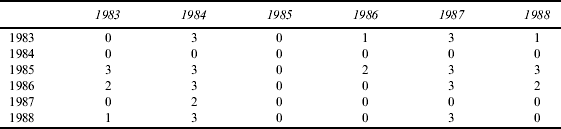
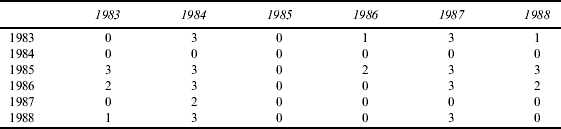
In the first step of the algorithm, a matrix of weights w, is defined such that w i,j, with i, j:1, …, n, gives the number of input rankings that prefer i to j. In Table 4 we give the w matrix corresponding to the example in Table 2. Each cell of the matrix gives the number of publishers that prefer the row-year to the column-year. For example, row 1985 and column 1983 have the number 3, which means that three publishers prefer 1985 to 1983.
The w Matrix of Weights Corresponding to the Example in Table 2
In the second step of the process, a classic Quicksort algorithm (see Hoare, Reference Hoare1962) is applied that sorts elements in the ranking in such a way that i is preferred to j when w ij≥w ji and j is preferred to i when w ij≥w ji.
The final step of the algorithm is a local search that consists of swapping pairs of elements in the ranking given by the Quicksort step and verifies whether it improves the Kendall-tau metric. Because the Quicksort algorithm has a random nature, the algorithm should be run several times and the best solution is chosen according to the Kendall-tau metric.
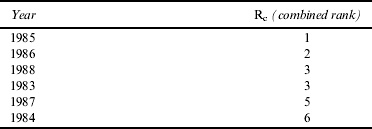
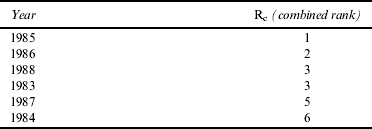
The final combined ranking (R c) of the years obtained by the proposed method for the running example is given in Table 5.
The Resulting Combined Ranking Obtained by Application of the Proposed Method
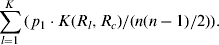
The method can be adapted to incorporate weighting schemes if there is a need to differentiate the relative importance attributed by the publishers. That can be done by modifying the way in which the average Kendall-tau metric is computed. For example, if, for each of the K publishers, we define the weights p 1, … p K such that  , the average pairwise disagreement can be computed as follows:
The method is applied in a predefined time window. If the analyst needs to extend the time window, for example, by including more recent years, the overall ranking has to be recomputed. In such a case, the ranks of the previously existing years might be altered. However, the Condorcet property ensures that the relative positioning of such years is maintained. Finally, we note that the algorithm described above was chosen for its simplicity, but any of the rank aggregation algorithms described in Schalekamp and Zuylen (Reference Schalekamp and Zuylen2009) can be used for the second step of the proposed method.
3. Results
In this section, we illustrate the application of the method with data for three wine-producing regions: Piedmont, white Burgundy, and Champagne. The regions were chosen in order to illustrate the method when using data sets with different proportions of missing values. For each wine region, we use up to six publicly available vintage charts:
• Decanter Vintage Guide (DC) (Decanter, 2011),
• Wine Spectator vintage chart (WS) (Spectator, Reference Spectator2011),
• Wine Advocate 1970–2008 vintage guide (WA) (Parker, Reference Parker2011),
• Vintages vintage chart (VC) (Spirits, Reference Spirits2011),
• Addy Bassin's vintage chart (AB) (MacArthur, Reference MacArthur2011),
• Michael Broadbent's pocket vintage wine companion (MB) (Broadbent, Reference Broadbent2007).
The method is generic in the sense that an arbitrary number of publishers using any ordinal rating scale could be included. For this experiment, we considered that all vintage charts are equally important and, therefore, are assigned the same weight (as referred to in Section 2, the input scores could be weighted according to the publishers’ importance, as perceived by the analyst).
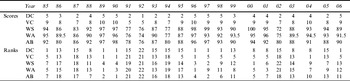
Table 6 gives the scores and the corresponding ranks according to five publishers for the Piedmont Italian wine region between 1985 and 2006. The first publisher (DC) uses a 5-point scale for the scores, the second publisher (VC) uses a 10-point scale, and the last three publishers (WS, WA, and AB) use a 100-point scale. It is interesting to note that for this particular region all publishers provide a score for every vintage year in the selected time window, that is, there are no missing values.
The Scores for the Piedmont Wine Region and the Corresponding Ranks

Note: Acronyms are as given in the note to Table 1.
In order to apply our method, the scores were converted into rankings, which are given in the bottom half of Table 6. As described in Section 2, for a given source, the rank of a year gives the number of years that have a higher score than itself plus one. Therefore, years with rank 1 are the years that were given the highest score by the corresponding vintage chart.
The analysis of the rankings for the Piedmont region reveals a relatively high consensus for the worst vintage years (1991 and 1992). From the ranking in Table 6, 1992 is clearly the worst year, as three of the publishers assign it the bottom rank and the other two publishers assign the penultimate rank. With respect to the best years, there is some consensus. On the one hand, WS gives 100 points to the 2000 vintage, while the other publishers do not rank that same year in the top four. On the other hand, both 1989 and 1990 are given the top rank by three publishers. This is a good illustration of the difficulties in combining the ratings from different publishers.
We have applied the method to the scores of the Piedmont region in order to induce the combined consensus ranking. The Quicksort with a local search algorithm was run 500 times, and the best solution was chosen. Table 7 gives the resulting combined ranking (Rc) for the Piedmont region. The Kendall-tau value for the solution is 0.160. The Kendall-tau metric is a value between 0 and 1, which measures the average distance between the input rankings and the combined ranking. When the value is 0, there is a total agreement.
The Combined Consensus Ranking for the Piedmont Wine Region

As a result of the application of the method, we conclude that, according to the combined scores of five independent vintage charts, the years 1989, 1990, and 1996 are the three indistinguishable best vintages for the Piedmont region between 1985 and 2006. Similarly, the quality of the 1997 vintage is equivalent to the quality of the 2000 vintage, and they are both better than the 2001 vintage.
In order to illustrate another property of the method, Table 8 gives the combined ranking for the Piedmont region when only the vintages from the decade of 1990 are considered. It is important to note that the relative ordering of the vintages is maintained when compared to the results given in Table 7. For example, according to the ranking given in Table 7, 1996 is ranked above 2000, and this is verified in the ranking given in Table 7. Also, 1997 and 2000 are rank-tied in both rankings.
The Combined Consensus Ranking for the Piedmont Wine Region for the Years Between 1991 and 2000

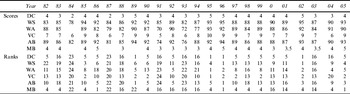
Table 9 gives the scores and corresponding ranks for white wines from the Burgundy wine region according to six different vintage charts. For this particular region, there are four missing values.
The Scores for White Wines from the Burgundy Wine Region and the Corresponding Ranks

Note: Acronyms are as given in the note to Table 1.
Table 10 gives the resulting combined consensus ranking that represents the ordering of the vintages by their quality according to the six vintage chart scores when the missing values are assigned the bottom rank. In this case, the assumption seems reasonable for the missing values in 1984 and in 1987, because the scores given by the other publishers are very low, but not reasonable for the missing value in 1989, because the other publishers give good scores to this year. The Kendall-tau value is 0.229, meaning that there is a higher degree of disagreement relative to the consensus ranking for white Burgundy than for the consensus ranking for the Piedmont region (which has a value of 0.160).
The Combined Consensus Ranking White Wines from the Burgundy Wine Region When the Missing Values Are Given the Bottom Rank of the Source

As discussed in Section 2, other alternative methods could be used for dealing with missing values. One method consists of assigning to a missing value the average rank of the scores in the rankings induced by the other publishers. If this method is used, the 1989 vintage's new rank according to MB is (1+6+5+2+1)/5=3. In order to maintain the consistency of the MB ranking, the ranks that are below the third position and not below twenty-second position (the 1989 previous rank) are decreased by one position. For example, the rank of the 1982 vintage is changed from fourth place to fifth place. The complete updated ranking for the MB source is given in Table 11 and Table 12 gives the resulting combined ranking when this method is applied to all missing values. The Kendall-tau value is now 0.222, which is almost identical to the value obtained for the solution given in Table 10. In this case, the results are not significantly affected by the method used to deal with the missing values. This is justified by the relatively low percentage of missing values, which have a low impact due to the number of input vintage charts used.
The Ranks Given by MB to White Wines from the Burgundy Wine Region If Missing Values Are Given the Average Rank of the Available Publishers

The Combined Consensus Ranking for White Wines from the Burgundy Wine Region When the Missing Values Are Given the Average Rank of the Other Available Publishers

Table 13 gives the scores according to four different publishers for the Champagne wine region. This example was chosen because of its larger percentage of missing values. Two reasons to justify the occurrence of a missing value are (1) the publisher decided not to taste the wines that year for operational reasons or (2) the crop quality was uneven, and the number of “declared” vintages was not sufficient to justify the tasting. Declaring vintages is most commonly done with Champagne and Port, for which producers declare a vintage only when the quality is extraordinary.

The method was run on this data set with both methods for dealing with the missing values. Table 14 gives the results when missing values are given the bottom rank of the corresponding source, and Table 15 the results when missing values are given the average rank of the available publishers. While the first solution has a Kendall-tau of 0.189, the second solution has a Kendall-tau of 0.150, meaning that the solution obtained with the average ranking is improved slightly. It is interesting to note that the two solutions are very close, being identical in the top 13 positions. When the average rank is used to fill the missing values, the vintage of 1992 is ranked three places higher, the vintage of 1994 is ranked two places higher and the vintage of 2001 two places higher. The other 19 vintages maintain their relative position. Finally, we note that of the 10 missing values observed in Table 13, only the 1985 score from DC corresponds to a vintage in the top half of the resulting combined ranking.
The Combined Consensus Ranking for the Champagne Wine Region When the Missing Values Are Given the Bottom Rank of the Source

The Combined Consensus Ranking for the Champagne Wine Region When the Missing Values Are Given the Average Rank of the Other Available Publishers

4. Discussion and Conclusions
Although vintage ratings like those used in this research may not be perfect, efficient measures of a year's worth of weather, farming, and winemaking, consumers have come to use these numbers as a general rule of thumb for purchasing wine. Producers have also incorporated vintage ratings into numerous aspects of the economics of their businesses (e.g., winemakers are given bonuses based upon achieving higher scores) and the marketing of their wines or regions. In addition, much important economic and scientific research is also based upon quality metrics such as ratings. Therefore, the problem of assessing the vintage quality over the years for a given wine region is an important research topic.
In this work, we propose a method that takes advantage of the numerous vintage charts published yearly by renowned wine-rating critics, magazines, and organizations. The method converts the ratings of each individual source into rankings and uses a rank aggregation algorithm to combine the input ranking into a consensus ranking. As a result, we are able to calculate a ranking of the vintages’ quality that can be seen as a measure of their relative quality. The ranking represents an impartial consensus of the collection of input vintage charts, in the sense that no assumption is made on how each vintage chart was formulated. The method effectively incorporates input from numerous publishers, using different types of scoring formats (ordinal, interval, or ratio), with different scales (e.g., 0–5, 0–10, 0–100), and with different assumptions with respect to the bottom of the scale and the interval that constitutes an extraordinary wine (see Cicchetti and Cicchetti, Reference Cicchetti and Cicchetti2009). Furthermore, the applicability of the method is illustrated with the analysis of the scores for three wine regions with different levels of missing values. However, it should be noted that a limitation of the method is that it provides only a relative measure instead of an absolute measure of the vintage quality.
In summary, we believe that the proposed method has the potential to be a useful tool for wine research that requires an impartial assessment of the vintage quality for a given wine region. Thus, we make available a software tool with the full implementation of the method and all the data files used in the tests (Borges, Reference Borges2011).