




No CrossRef data available.
Article contents
Left ventricular myocardial velocities in healthy children: quantitative assessment by tissue Doppler echocardiography and relation to the characteristics of filling of the left ventricle
Published online by Cambridge University Press: 20 January 2005
Abstract
Aim: To assess the myocardial velocities of the mitral annulus, left ventricular lateral wall, and midseptum in healthy children, and to compare these parameters with transmitral and pulmonary venous velocities. Methods and results: We examined 72 children, half being male, who had no systemic or cardiac pathologies. Their mean age was 6.73 ± 5.10 years, with a range from 0.1 to 17.75 years, and a median age of 6.71 years. Each parameter was measured twice, at end inspiration and end expiration. The tissue velocities are similar in males and females (p > 0.05). The longitudinal velocity of the heart in early diastole has a positive correlation with age (p < 0.05; midseptum velocity r = 0.57, left ventricular lateral wall velocity r = 0.56, mitral annulus velocity r = 0.56), and the tissue velocities are not influenced by respiration (p > 0.05). The myocardial velocities of different segments of the left ventricle are not correlated with the transmitral or pulmonary venous flows (p < 0.05). When age is controlled for heart rate, age mainly affects the systolic velocity of the mitral annulus and the early diastolic velocity of the midseptum in longitudinal axis, as well as the early diastolic velocity of the midseptum in transverse axis (p > 0.05 for all, r = 0.34, 0.29, 0.30 respectively). Conclusion: This study, which has determined reference values for tissue velocities in a large healthy group of children, will now set the scene for further studies in children with heart disease.
Information
- Type
- Original Article
- Information
- Copyright
- © 2004 Cambridge University Press
During the last two decades, Doppler echocardiography has emerged as the principal clinical tool for assessment of left ventricular function,1, 2 and has been widely used for the assessment of left ventricular diastolic filling patterns. Sensitive transducers now enable the assessment of the pulmonary venous flow, which gives more reliable information about left ventricular diastolic function when used in association with the mitral inflow. In recent years, tissue Doppler has provided additional insights in the assessment of diastolic function.1
Such tissue Doppler assessment has been used frequently in adults, especially to determine the abnormalities of wall motion in the setting of ischemic heart disease, congestive heart failure, and various myocardial pathologies.2–6 Several studies have established normative data for various tissue Doppler indexes in the adult population.7–9 There is, however, a limited number of studies concerning children, and the normal pattern of left ventricular wall motion in children is not currently adequately investigated.10 It may be misleading when the results of the previous studies in adults are extrapolated to children, since a significant relation has already been demonstrated between age and left ventricular function in adults.11, 12 The aim of our study, therefore, is to determine the normal range of myocardial velocities of the mitral annulus, left ventricular lateral wall and midseptum in healthy children, and to compare these parameters with transmitral and pulmonary venous velocities.
Materials and methods
Subjects
We examined 72 healthy children, half of whom were male, with no systemic or cardiac pathologies. Newborn infants in the first week of life, more than 3 days old, were recruited from well baby nursery of the Hacettepe University Children's Hospital. Older children were recruited from the pediatric clinics of the Hacettepe University during their routine visits for health maintenance, and from those referred to the pediatric cardiology unit for innocent murmurs. A few were volunteers or siblings of the patients. No children were acutely ill, or were taking any medications at the time of the study. All were growing normally, had a normal haemodynamic state, and were normally hydrated during the echocardiographic study. Informed consent was obtained from the parents for any examination that was not clinically indicated.
The systemic and cardiac pathologies were excluded with a thorough physical examination, along with electrocardiography and echocardiography. Age, gender, height, weight measurements and percentiles, heart rate and blood pressure were noted, and the index of body mass was calculated as weight divided by the square of height. All children were in sinus rhythm, and had normal electrocardiographic patterns.
In order to define the ranges of normal myocardial velocities in different ages, we divided our subjects into five subgroups, specifically to neonates aged from birth to 1 month, infants from 1 month to 2 years, preschool children from 3 to 6 years, school-aged children from 7 to 10 years, and adolescents who were older than 11 years (Table 1).
Table 1. The details of the study group.

Echocardiographic examination
A complete echocardiographic study was performed with a multiple-plane imaging approach to confirm normal cardiac anatomy and function. Each child was examined in supine position. No sedatives were used to eliminate the possible effects of sedation on cardiac output. The studies were performed in a quiet, dimly lit, room with the infants and children in an awake and calm state.
The same paediatric cardiologist performed all the echocardiographic examinations with General Electric Vingmed System Five Performance, using transducer probes of 10, 3.5, and 2.5 MHz. All the studies were recorded on the hard disc of the echocardiographic scanner for later analysis.
A single lead electrocardiogram was recorded simultaneously. Systole and diastole were determined with a phonocardiogram, and phases of respiration were differentiated with a respiration probe. Standard pulsed wave Doppler techniques were used to assess transmitral and pulmonary venous flows with a Doppler beam that was 2 mm wide. The following parameters were measured for transmitral and pulmonary venous flows:
Transmitral flow
- Peak early diastolic velocity;
- Peak late diastolic velocity during atrial contraction;
- Ratio of early diastolic to late diastolic velocity.
Pulmonary venous flow
- Peak systolic velocity;
- Peak early diastolic velocity;
- Peak late diastolic reverse velocity during atrial contraction;
- Ratio of systolic to early diastolic velocity;
- Ratio of early diastolic to late diastolic velocity.
The movements of the mitral annulus, the midseptum, and the left ventricular lateral wall were recorded using tissue Doppler imaging. Motions of the midseptum and the anterolateral and posterolateral segments of the left ventricular wall were recorded in the apical four-chamber plane, documenting the longitudinal motion of the left ventricle, and in the parasternal long axis, documenting the transverse motion of the left ventricle. The mitral annulus was assessed only in the four-chamber view (Fig. 1). Both the colour-coded and pulsed wave tissue Doppler techniques were used. In apical four-chamber measurements, the pulsed wave beam was placed on the septum and the left ventricular lateral wall, midway between the mitral annulus and apex, and on the mitral annulus close to the basal left ventricular anterolateral wall. In the parasternal long-axis view, the pulsed wave beam was placed distal to the attachment of the mitral valve to the left ventricular posterolateral wall, and on the septum across this point. Special care was taken to keep the Doppler beam on the myocardium, not the endocardium or the epicardium, during the measurements. The following parameters were measured:

Figure 1. Diagram summarizing the tissue Doppler samples. (A) Apical four chamber view: tissue Doppler assessment of the longitudinal motion in mitral annulus, left ventricle lateral wall and midseptum are depicted. RV: right ventricle. (B) Parasternal long axis view: tissue Doppler assessment of the transverse motion in left ventricle lateral wall and midseptum are depicted. RV: right ventricle; LV: left ventricle.
Tissue Doppler imaging
- Peak systolic velocity;
- Peak early diastolic velocity;
- Peak late diastolic velocity during atrial contraction;
- Ratio of early diastolic to late diastolic velocity.
Each Doppler measurement was made twice at end-inspiration, and twice at end-expiration, for all the positions. The average of the measurements in inspiration and that of expiration were taken as well as the average of all four measurements. Only studies with adequate recordings were included. We excluded 3 patients with inadequate recordings of pulmonary venous flow. The late diastolic mitral inflow velocity may be affected if it starts before the early diastolic flow has reached zero, merging early diastolic and late diastolic flows. Because of this, we also excluded four patients with an early diastolic velocity more than 0.2 mm/s at the beginning of late diastolic flow. We did not correct any velocities for angle of insonation.
Statistical analysis
The data is given as mean plus or minus the standard deviation. Median and interquartile ranges are also provided for data of non-normal distribution. The correlation of the measured data with variables like age, heart rate, and index of body mass are analyzed with the Spearman correlation constant. In multiple correlation analyses, values less than 0.01 are considered significant, otherwise a value of less than 0.05 is considered significant.
Results
The mean age of the study group was 6.73 ± 5.10 years, with a median of 6.71 years, and a range from 0.01 to 17.75 years. The mean weight, index of body mass, and systolic blood pressure were 24.03 ± 15.91 kg, with a median of 20.50 kg, and a range from 3 to 66 kg, 16.65 ± 2.76 kg/m2, with a median of 16.00, and a range from 10.25 to 26.77 kg/m2 and 98.5 ± 13.1 mmHg, with a median of 100 mmHg, and a range from 70 to 120 mmHg, respectively. The values for the subgroups are depicted in Table 1.
Doppler velocities in normal children
Doppler velocities of the left ventricular myocardium measured in different echocardiographic positions are given in Table 2. Table 3 shows the myocardial wall velocities for the various age groups. Measurements of transmitral and pulmonary venous flow are depicted in Table 4.
Table 2. Pulse wave Doppler velocities of left ventricular myocardial movements.

Table 3. Pulse wave Doppler velocities of left ventricular myocardial movements in age groups.

Table 4. Measurements of transmitral and pulmonary flow.

Longitudinal motion of all segments of the left ventricular myocardium was faster than the corresponding transverse motion. The fastest moving portion of the left ventricle in the longitudinal axis was the mitral annulus, both during systole and late diastole (p < 0.05). The early diastolic velocity of the mitral annulus and the left ventricular lateral wall were similar (p > 0.05). The slowest moving portion of the left ventricle in the longitudinal axis was the midseptum (p < 0.05). Transverse movement of the septum was also slower than the left ventricular lateral wall (p < 0.05) (Fig. 1).
Influence of age, heart rate, index of body mass, and gender on normal values
While computing correlations between tissue Doppler velocities, age and heart rate, we noticed a strong negative correlation between age and heart rate (p < 0.001; r − 0.81). Because of this strong association, and because of the importance of the heart rate in determining many of the Doppler variables, we believe the separation of the contributions of age and heart rate to echocardiographic variables is difficult. We therefore computed partial correlation coefficients for independent effects of age and heart rate. The interactions between age and heart rate are summarized in Table 5. Accordingly, the longitudinal systolic velocity of the mitral annulus was mainly influenced by age (p < 0.01; r = 0.34), whereas the transverse late diastolic velocity of the left ventricular lateral wall was mainly influenced by heart rate (p < 0.01; r = 0.37). Figure 2 depicts the scatter plot of the longitudinal systolic velocity of the mitral annulus versus age, and Figure 3 depicts the box plot of this tissue-Doppler index in reference to the five age-groups. Age and heart rate had similar effects on the transverse systolic velocities.
Table 5. Influences of age and heart rate on tissue Doppler variables in children.


Figure 2. Scatter plot of the longitudinal systolic mitral annular motion versus age. The lines indicate the mean regression prediction (confidence interval 95%).

Figure 3. Box plot of the longitudinal systolic mitral annular motion in reference to the five age groups. The graph shows the median, interquartile range, and the groups that differ significantly in mean value of these indexes. *p < 0.05, **p < 0.001.
Among the longitudinal tissue Doppler velocities, early diastolic velocities of the midseptum, left ventricular lateral wall, and the mitral annulus, as well as the systolic velocities of left ventricular lateral wall and the mitral annulus, were correlated to the index of body mass (p < 0.05 for all values; left ventricular lateral wall systolic velocity r = 0.43, and early diastolic velocity r = 0.35; annular systolic velocity r = 0.31, and early diastolic velocity r = 0.26; midseptum early diastolic velocity r = 0.31). Among the transverse tissue Doppler velocities, the left ventricular lateral wall systolic velocity was positively correlated to the index of body mass (p < 0.05, r = 0.34). Gender had no significant influence on the variables studied (p > 0.05).
Influence of inspiration on myocardial velocities
We found that the longitudinal midseptum early diastolic velocity, the longitudinal mitral annular late diastolic velocity, and the transverse midseptum late diastolic velocity all varied with inspiration (p < 0.05). The former two velocities increased in inspiration by 5.6% and 6.8% respectively, whereas the latter one increased by 14.3%.
Relationship of myocardial Doppler velocities to transmitral and pulmonary flow in normal children
Longitudinal or transverse myocardial Doppler velocities were not correlated to the pulmonary venous flow or the diastolic transmitral flow (p > 0.05).
Discussion
Our study has shown that, in healthy children, the myocardial velocities of different segments of the left ventricle are not correlated to the transmitral or pulmonary venous flows. This finding may indicate that the myocardial velocities are relatively independent of the left ventricular filling dynamics in children with normal haemodynamic state.
Unlike that situation observed for transmitral and pulmonary flows, we believe the effect of respiration on myocardial velocities is negligible, as the change in velocity with inspiration is not consistent to a specific region, a specific direction of motion, be it longitudinal or transverse, or a phase of the cardiac cycle. Nevertheless, to prove this postulate, we will need to study many more children.
In a recent study of healthy children, Swaminathan and colleagues10 found consistently higher systolic and diastolic velocities of the mitral annulus than did we. This is still true when our group is reanalyzed excluding the newborns, since newborns were not included in their study. This conflicting data may be a result of the specific population studied, in our case healthy Turkish children. This warrants further assessment of larger groups of healthy children from different ethnic backgrounds.
The results of studies in adults cannot be extrapolated to children, since some critical values determined for adults appear to be invalid for children. Evaluation of the normal myocardial velocities in adults has disclosed that longitudinal systolic velocity of the mitral annulus greater than 5.4 cm/s is highly specific and sensitive in predicting the normal ejection fraction.13 In our study, however, the mean systolic velocity of mitral annulus is less than this value in healthy children. This value described for adults apparently cannot discriminate a normal ejection fraction in our children. In order to obtain a similar cut-off value that is useful in childhood, myocardial velocities of healthy children should be compared to the ones with myocardial pathologies.
In healthy children, the tissue velocities do not differ in males or females. The effects of age and heart rate on the myocardial velocities are similar and shared. The interpretation of the individual effects of these variables, therefore, is obscure. Heart rate decreases progressively and significantly with aging during childhood (p < 0.001, r − 0.81), while in adults, the change in heart rate is less noticeable. The studies on adults have demonstrated a significant relationship between age and left ventricular function.11, 12, 14 In children, in contrast, we believe that heart rate rather than age chiefly influences the myocardial velocities.
Garcia and colleagues14 studied the velocities of the anteroseptal and posterior ventricular walls in normal adults, and found that systolic velocities of the left ventricular myocardium had a similar range, whereas late diastolic velocities increased with age. Contrasting that result, in our study, the late diastolic velocity of the lateral wall increases with heart rate and is not correlated to age. Furthermore, the mitral annular systolic motion is positively correlated to age.
In long axis view, systolic and diastolic velocities are higher in the posterolateral wall in our group, which is a consistent finding with the previous studies on adults.7, 14, 15 The translational motion of the heart in the chest during cardiac cycle is anteriorly directed in systole and posteriorly directed in diastole. Since tissue Doppler imaging cannot distinguish local velocity from translational motion and tethering effects from other regions, the velocities of different components are superimposed. The values related to the posterior wall, therefore, are increased and those of the septum are decreased.14
As in adults, the fastest moving portion of the left ventricle as seen in the apical view is the mitral annulus. The longitudinal tissue Doppler velocities decrease from base to apex. This is not due to the intrinsic differences in tissue velocities. Rather, the difference is a function of greater motion of the whole heart at the base compared with the mid- and apical regions. The regional contractility of individual myocardial regions is relatively uniform, as reflected by myocardial strain rates.16, 17
Tissue Doppler echocardiography is a relatively new technique, which is believed to be unaffected by the ventricular inflow pressures, therefore reflecting the ventricular relaxation better than does transmitral flow.18, 19 Tissue Doppler methods have provided quantitative improvements for evaluation of the regional left ventricular function.3 They remain limited, however, by the dependence of the ultrasound beam of the angle of insonation. This inherent limitation is due to a target that continuously changes during sampling, thus the technique chases a moving target. Alternative techniques to improve quantification of regional left ventricular function include color kinesis, strain rate imaging, and establishing the myocardial velocity gradient. All have their different limitations. A novel second-generation tissue Doppler method that transforms Doppler velocity data to an angle-corrected quantitative display of colour-coded wall displacement may, in the future, overcome the limitations of this technique.20 The ideal technique to evaluate left ventricular systolic and diastolic function is still to be determined.
Limitations of the study
Although our study includes the largest group of newborns, the individual subgroups, especially the infants, are relatively small. The evaluation of the variables with respect to age, therefore, may be less evident than one would desire. Inter- or intraobserver variables have not been assessed in this study, although we tried to overcome the limitation of the intraobserver variability by measuring four different recordings for each position. We believe having a single paediatric cardiologist perform all the echocardiographic examinations minimized the interobserver variability.
We conclude that the normal velocities determined for each portion of myocardium in this study will be a good reference in evaluating myocardial pathologies in children. The determination of the normal myocardial velocities will certainly pioneer new studies concerning children with cardiac disease.
References
Garcia MJ, Thomas JD, Klein AL. New Doppler echocardiographic applications for the study of diastolic function. J Am Coll Cardiol 1998; 32: 865–875.Google Scholar
Nishimura RA, Abel MD, Hatle LK, Tajik AJ. Assessment of diastolic function of the heart: background and current applications of Doppler echocardiography. Part II: clinical studies. Mayo Clin Proc 1989; 64: 181–204.Google Scholar
Bach DS, Armstrong WF, Donovan CL, Muller DW. Quantitative Doppler tissue imaging for assessment of regional myocardial velocities during transient ischemia and reperfusion. Am Heart J 1996; 132: 721–725.Google Scholar
Derumeaux G, Ovize M, Loufoua J, et al. Doppler tissue imaging quantities regional wall motion during myocardial ischemia and reperfusion. Circulation 1998; 19: 1970–1977.Google Scholar
Nixdorff U, Rupprecht HJ, Mohr-Kahaly S, Kremer M, Bickel C, Meyer J. Tissue Doppler echocardiography: a new method of evaluating perfusion-dependent myocardial function during PTCA. Int J Card Imaging 1997; 13: 99–103.Google Scholar
Pye MP, Pringle SD, Cobbe SM. Reference values and reproducibility of Doppler echocardiography in the assessment of the tricuspid valve and right ventricular diastolic function in normal subjects. Am J Cardiol 1991; 67: 269–273.Google Scholar
Donovan CL, Armstrong WF, Bach DS. Quantitative Doppler tissue imaging of the left ventricular myocardium: validation in normal subjects. Am Heart J 1995; 130: 100–104.Google Scholar
Galiuto L, Ignýne G, DeMaria AN. Contraction and relaxation velocities of normal left ventricle using pulsed wave tissue Doppler echocardiography. Am J Cardiol 1998; 81: 609–614.Google Scholar
Palka P, Lange A, Flemming AD, Shutherland GR, Fenn LN, McDicken WN. Doppler tissue imaging: myocardial wall motion velocities in normal subjects. J Am Soc Echocardiogr 1995; 8: 659–668.Google Scholar
Swaminathan S, Ferrer PL, Wolff GS, Gomez-Marin O, Rusconi PG. Usefulness of tissue Doppler echocardiography for evaluating ventricular function in children without heart disease. Am J Cardiol 2003; 91: 570–574.Google Scholar
Holmgren SM, Golberg SJ, Donnerstein RL. Influence of age, body size and heart rate on left ventricular diastolic indexes in young subjects. Am J Cardiol 1991; 68: 1245–1247.Google Scholar
Miller TR, Grossman SJ, Schectman KB, Biello DR, Ludbrook PA, Ehsani AA. Left ventricular diastolic filling and its association with age. Am J Cardiol 1986; 58: 531–535.Google Scholar
Gulati VK, Katz WE, Follansbee WP, Gorcsan J. Mitral annular descent velocity by tissue Doppler echocardiography as an index of global left ventricular function. Am J Cardiol 1996; 77: 979–984.Google Scholar
Garcia MJ, Rodriguez L, Ares M, et al. Myocardial wall velocity assessment by pulsed Doppler tissue imaging: characteristic findings in normal subjects. Am Heart J 1996; 132: 648–656.Google Scholar
Gorcsan J III, Gulati VK, Mandarino WA, Katz WE. Color-coded measures of myocardial velocity throughout the cardiac cycle by tissue Doppler imaging to quantify regional left ventricular function. Am Heart J 1996; 131: 1203–1213.Google Scholar
Edvardsen T, Gerber BL, Garot J, Bluemke DA, Lima JAC, Smiseth OA. Quantitative assessment of intrinsic regional myocardial deformation by Doppler strain rate echocardiography in humans. Circulation 2002; 106: 50–56.Google Scholar
Weidemann F, Eyskens B, Jamal F, et al. Quantification of regional left and right ventricular radial and longitudianl function in healthy children using ultrasound-based strain rate and strain imaging. Am J Cardiol 2002; 15: 20–28.Google Scholar
Nagueh SF, Sun H, Kopelen HA, Middleton KJ, Khoury DS. Hemodynamic determinants of mitral annulus diastolic velocities by tissue Doppler. J Am Coll Cardiol 2001; 37: 278–285.Google Scholar
Sohn DW, Chai IH, Lee DJ, et al. Assessment of mitral annulus velocity by Doppler tissue imaging in the evaluation of left ventricular diastolic function. J Am Coll Cardiol 1997; 30: 474–480.Google Scholar
Sade E, Severyn DA, Kanzaki H, Dohi K, Gorcsan J. Second-generation tissue Doppler with angle-corrected color-coded wall displacement for quantitative assessment of regional left ventricular function. Am J Cardiol 2003; 92: 554–560.Google Scholar

Table 1.
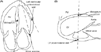
Diagram summarizing the tissue Doppler samples. (A) Apical four chamber view: tissue Doppler assessment of the longitudinal motion in mitral annulus, left ventricle lateral wall and midseptum are depicted. RV: right ventricle. (B) Parasternal long axis view: tissue Doppler assessment of the transverse motion in left ventricle lateral wall and midseptum are depicted. RV: right ventricle; LV: left ventricle.
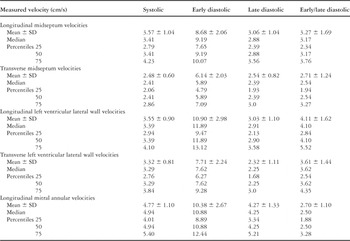
Table 2.

Table 3.

Table 4.
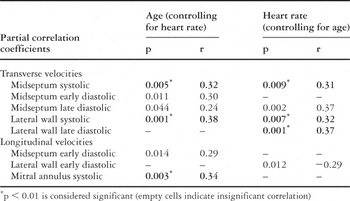
Table 5.

Scatter plot of the longitudinal systolic mitral annular motion versus age. The lines indicate the mean regression prediction (confidence interval 95%).

Box plot of the longitudinal systolic mitral annular motion in reference to the five age groups. The graph shows the median, interquartile range, and the groups that differ significantly in mean value of these indexes. *p < 0.05, **p < 0.001.
 You have
Access
- 18
- Cited by