In this paper we compare the August1st forecast of the 2004 presidential election generated with the fiscal model with those made with the seven models of what we call the “Campbell Collection,” after James E. Campbell, the editor or co-editor of several forecasting symposia that have appeared in the American Politics Quarterly (October, 1996) and in successive issues of PS: Political Science and Politics (October, 2004 and January, 2005). For reasons that will become evident, Ray Fair's “presidential vote equation” (Fair 2002a, 2002b) is also included in the comparison. First, given space constraints, we present only a brief summary of the theoretical model. (For a more extended discussion, interested readers are encouraged to pursue the relevant references.) Then, as we did pursuant to issuing a forecast for the 2004 election, we estimate the model over the 22 elections held between 1916 and 2000, showing the out-of-sample results. Finally, we evaluate the model relative to the Campbell Collection on operational and substantive criteria.
The Fiscal Model
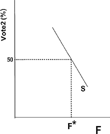
Figure 1 is a graphical representation of the pure fiscal model of American presidential elections. It consists of two variables, F and VOTE2. Running along the horizontal axis, F is the percent of Gross Domestic Product (GDP) spent by the federal government. VOTE2, the percent of the two-party vote won by the incumbents at the end of term election, is viewed along the vertical axis. A truncated support schedule S slopes down and to the right, encapsulating the model's key hypothesis: ceteris paribus, as F increases VOTE2 falls. That is, the greater the share of the economy flowing through the federal government, the smaller the proportion of the electorate willing to grant the incumbents another term in the White House.1
To the best of our knowledge, only Niskanen (1975;1979) and Pelztman (1992), both economists, have explored the relationship between federal spending and presidential elections in any depth, albeit with different model specifications and estimated over different time periods.
VOTE2 as a Function of Federal Spending
The theoretical justification for this hypothesis, which many may at first regard as “counter-intuitive,” rests on an analogy with economics.2
On model-building by analogy, see Morris (1970). See also Black (1950), Katzner (1969), Pribram (1953), Richardson (1991), Russett (1966), and Sebba (1953).
F is interpreted as the equivalent of a “price” or “fee” which Washington charges the economy for the federal bundle of goods and services. Metaphorically, on Election Day the incumbent party, of which the president is the chairman of the board and chief executive officer, has its “contract” to manage the federal government up for renewal. Acting much like consumers,
3 As Erikson, MacKuen, and Stimson put it, “[c]itizens are consumers of government” (2001:16).
the public's willingness to grant the incumbents an other term in the White House depends on the fiscal fee being charged. Other things equal, as this rate increases, more and more voters refuse to reelect the incumbents, casting their ballots, instead, for the opposition party. If spending has grown beyond what a majority is willing to support with their votes, the incumbents are “fired.” Conceived in this manner, an election is equivalent to a retrospective-minded referendum on the president's fiscal policy.
Parenthetically, we do not maintain that voters, in making up their minds before they go to the polls, calculate the change in the ratio of federal spending to GDP since the last election. What we conjecture is that the electorate observes the effects of fiscal policy on its surroundings, and acts accordingly. That is, we assume that on Election Day voters cast their ballots as if they knew and were concerned about the value of F. Economists routinely make such “as if” assumptions. For example, discussing the theoretical grounds on which the Walrasian “vision” of general equilibrium rests, Katzner explains: “Thus, although there is no guarantee that the consumer is, in fact, a utility maximizer, the model constructed here and the vision from which it emanates explains his behavior as if he were” (Katzner 1992, 46, emphasis added).
Returning to Figure 1, the maximum that the incumbents can spend and still retain their lease on 1600 Pennsylvania Avenue is F*. This is found on the horizontal axis at the point touched by a line dropped from the support function S where it crosses the 50% plus 1 threshold needed for reelection. At F* the electorate is equally divided between those who would support additional spending and those who would not. Thus, F* belongs to the median voter, as in other rational-choice models (Downs 1957).
F* is a theoretical concept, a centripetal point to which, barring parameter change, the pure fiscal model tends to converge. But the system is never at rest. A shock such as the September 11, 2001, attack on the United States would tend to flatten the support function, at least temporarily, which implies lesser voter sensitivity to fiscal expansion. Paraphrasing the language of economics, critical events requiring a federal response tend to reduce the “elasticity” of the support schedule. Alternatively, satiation with government programs would have the opposite effect. The support function would rotate downward, assuming a more vertical angle with respect to the x-axis, which implies that even marginal increases in spending would be punished severely at the polls. Thus, though always negative, the slope of the support schedule (dV/dF) becomes more or less steep in response to short-term disturbances or slower, long-term changes in voter sensitivity to the “fee” charged by the federal government.
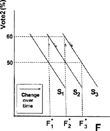
Additionally, the support function shifts forward or backward as voters' desires or evaluations of the quantity and quality of what Washington pro vides vary in response to exogenous change. This is shown in Figure 2. Assume the starting point to be F*1 in period t1. Assume, further, that in the next period the public, believing that the benefits of federal goods and services now exceed their cost, is willing to support additional spending to obtain them. In the model, this is represented by a forward shift in the support function, from S1 to S2, where it intersects the 50% plus one victory threshold further to the east.4
We do not say “to the right” because, by convention, this word stands for “conservative,” just as “left” is used to denote “liberal.” It would be confusing to label a more favorable attitude toward spending as “a shift to the right,” or a less favorable one as a “shift to the left.” For this reason, we use the more neutral nomenclature of the cardinal points, or terms connoting direction of motion, i.e., forward or backward.
This results in the reelection of the incumbents with, say, 60% of the vote. Responding to the wishes of the electorate, the governing party will now spend more. (For a discussion of the incumbents' motivations, what might be called the “supply” side of the fiscal model, see Cuzán, Heggen, and Bundrick
2003.) As the federal budget grows relative to the economy, the proportion of voters for whom the value of the additional goods and services exceeds the opportunity cost of increased spending again falls progressively until a new equilibrium, F*
2, is reached. Assuming that the additional spending is not completely wasted, at F*
2 the federal government now charges the economy a higher fee in exchange for more or better goods and services than it did at F*
1. If the process is re peated, either periodically, in big steps, or incrementally, F* migrates forward over time. Presumably, the process could also occur in a reverse direction. Thus, F* is an elusive target, subject to short-term displacements and long-term migrations in either direction.
Shifting Support for Spending
Empirical Testing
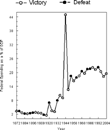
Figure 3 displays the empirical relationship between F and election outcome (victory or defeat in the two-party vote for president) across the 34 elections held between 1872 and 2004. The height of the line connecting the dots, the F-line, represents the ratio of federal outlays to GDP. At first glance there appears to be no relationship between the level of spending and election outcome. In the language of Figure 2, it seems as if the support function has shifted forward since the 1920s, so that incumbents are returned to the White House at any height of the F-line. However, in examining the turns in the F-line a relationship emerges. Most of the time, clockwise turns, representing decreases or decelerations in the growth of federal outlays relative to GDP, are associated with victory in the two-party vote for president. By contrast, counter-clockwise turns, generally describing increases or accelerations in the growth of spending, coincide with electoral defeat.
Victory or Defeat by FISCAL, 1872–2004
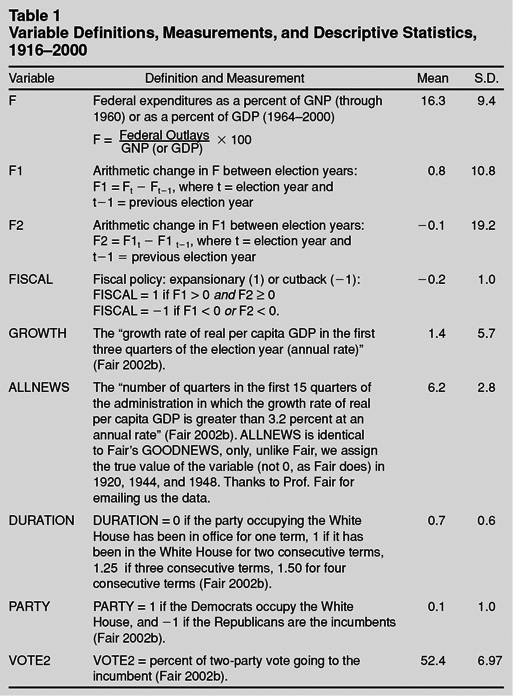
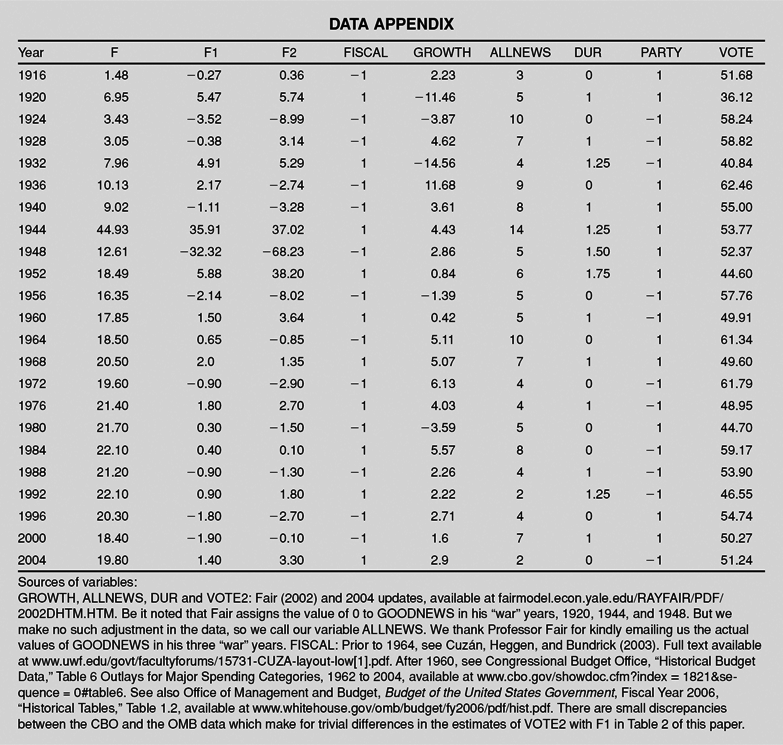
These turns in the F-line are quantified by the variable FISCAL. (This and all other variables included in this paper are defined and operationalized in Table 1. Their values across time are found in the Appendix.) FISCAL is the product of two measures of fiscal policy, F1 and F2, or the first and second derivative of F, respectively. F1 represents the change in F between election years. F2 describes the change in F1, or the rate of change in F between election years, i.e., an acceleration (F2 > 0) or a deceleration (F2 < 0) in spending growth. If F1 > 0 and F2 ≥ 0, this means that in the current term F has increased at the same or faster rate than in the previous administration. It is an unambiguous case of fiscal expansion, so that FISCAL = 1. If F1 < 0, regardless of the value of F2, this indicates that F has contracted since the last election. If F1 > 0 and F2 < 0, this shows that in the current term F has grown at a slower rate than in the previous term, i.e., its rate of growth has decelerated. Both of these are instances of a cutback fiscal policy, i.e., FISCAL = 1. Theoretically, FISCAL could take the value of zero (F1 = 0, F2 = 0), signifying a steady-state fiscal policy, but there's no case like it in the data (see Appendix.)
FISCAL is a powerful predictor of presidential election outcomes. As discerned in Figure 3, from 1872 to 2000 only twice did incumbents who pursued an expansionary policy return to the White House: Franklin D. Roosevelt in 1944 and Ronald Reagan four decades later. (In 2004, George W. Bush became the third exception.) In the remaining nine cases of fiscal expansion, the incumbents met defeat. By contrast, only in four out of 22 instances of fiscal cutback did the incumbents fail to secure victory in the two-party vote for president (1884, 1896, 1912, and 1980).
Next we show that FISCAL has a predictably negative effect on the share of the two-party vote going to the incumbents. To that end, we construct a five-variable multiple-regression model that includes, as well as FISCAL, metrics for three other factors. One is economic conditions, as their effect on incumbents' fortunes is well established theoretically and taken into account in almost all presidential election models (Erikson, MacKuen, and Stimson 2001; Fair 2002b; Garand and Campbell 2000).5
See, also, the most recent Campbell Collections in the October 2004 and January 2005 issues of PS: Political Science and Politics.
Another is time in office, called “time for change” by Abramowitz (
2004) and “voter fatigue” by Norpoth (
1996). Last is the party of the incumbents, because not only Fair (
2002b), but Alesina and Rosenthal (
1995), too, have shown that over the past century Republicans do better than Democrats at the polls.
To construct the fiscal model, we borrow three variables from Fair (2002b). GROWTH and GOODNEWS estimate economic growth, the former through the first three quarters of the election year and the latter over all but the last quarter of the presidential term. (Unlike Fair, we do not neutralize the value of GOODNEWS in 1920, 1944, or 1948, his “war” years, so we call our variable ALLNEWS. See Table 1.) The third variable borrowed from Fair is a weighted index of time in office (DURATION). Fair's three variables, plus the party of the incumbents, plus FISCAL make up the fiscal model, described in the following equation:
where all variables are defined and measured as indicated in Table 1, A is a constant (intercept), 1–5 are coefficients, and E is an error term.6
In alternative specifications, neither inflation nor presidential incumbency turned out to be a statistically significant predictor when all the values of the former are entered into the fiscal model, not neutralized in 1920, 1944 and 1948, as Fair does in his equation.
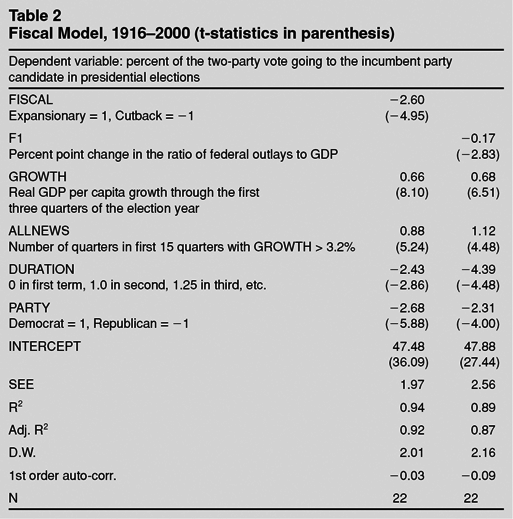
Table 2 displays the results of OLS estimates of the two-party vote obtained with the fiscal model over the same 1916–2000 period which Fair uses to calibrate the variables of his presidential vote equation. As hypothesized, FISCAL has a negative effect on VOTE2.7
To those who, not unreasonably, may think that the relationship between fiscal policy and the vote is spurious, both being tied to economic conditions, with bad times requiring greater spending and good times less, we point out that there is no statistically significant relationship between FISCAL and GROWTH or ALLNEWS. As for F1, it is uncorrelated with the former but positively though weakly (r = 0.44, P = 0.05) correlated with the latter. It could be that the better the economy performs, the greater the volume of revenues flowing into the Treasury, facilitating the financing of more spending.
A switch in policy from cutback to expansionary costs the incumbents five points in the two-party vote. (FISCAL ranges from 1 to 1, so in order to calculate its effect one multiplies the coefficient by two.) All variables are statistically significant and the model has a very good fit with the data, better, in fact, than Fair's own presidential vote equation (for a comparison, see Cuzán and Bundrick
2003).
Additionally, on the far right column of Table 2 we show another model where F1 is substituted for FISCAL. This is done simply to demonstrate that as well as FISCAL, which is binary, F1, a continuous variable, also has a negative impact on VOTE2.7 However, the coefficient for F1 seriously understates the electoral impact of fiscal policy. In order to affect a 1% reduction in the dependent variable, F1 has to be around 5–6%. But F1 has taken that large a value only three times since 1916 (in 1920, 1944, and 1952). This is bound to give the wrong impression both to researchers and to policy makers. Were an administration to take this model as the true representation of the relationship between spending and election outcome, it would derive a false sense of security if, under its watch, F1 amounted to no more than 3–4%, thinking it likely that such an increase would not lose it many votes. Yet, as Figure 3 and the Data Appendix show, most administrations that practiced fiscal expansion raised F by, at most, 1–2%, and all but three were defeated.
The coefficient for F1, then, simply does not do justice to the true impact on the incumbent's fortunes caused by a change in fiscal policy. But the coefficient for FISCAL does. A 5% difference in the incumbent share of the two-party vote resulting from a switch from a cutback to an expansionary mode is a matter of considerable import. It goes against the grain, because continuous variables are usually preferred to binary variables. Nevertheless, FISCAL is clearly a better choice for measuring fiscal policy. It is theoretically grounded, visually discernible in a graph (Figure 3), useful for constructing a simple typology of presidents (Cuzán and Bundrick 2000), and can be the basis for offering policy advice. Be it noted, too, that in the natural sciences as well as in engineering,8
Be it noted, too, that the co-originator of FISCAL, Richard J. Heggen, is professor emeritus of civil engineering at the University of New Mexico. See Cuzán and Heggen (1984).
it is not unusual to represent reality with a binary variable (e.g., digital circuits of negative and positive voltage, or the spin of the electron, which takes a value of plus half or minus half, both variables having many applications to everyday life).
9 We are indebted to UWF colleagues Mohamed Khabou, of the Department of Computer and Electrical Engineering, and Chandra Praga, of the Department of Physics, respectively, for these examples.
Accordingly, in the forecasting application that follows it is FISCAL that we employ to predict the vote.
Forecasting the 2004 Presidential Election
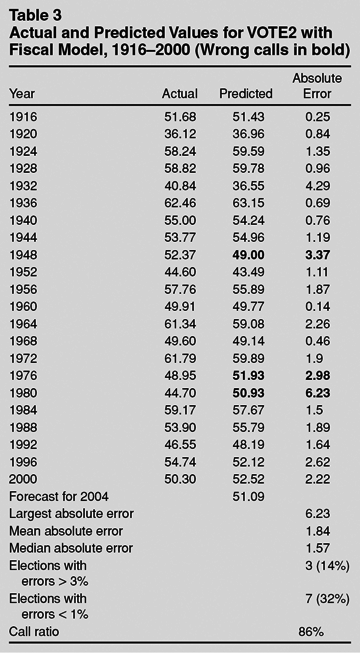
In Table 3 we display the out-of-sample forecasts of the incumbent share of the two-party vote obtained with the fiscal model over the 22 elections held between 1916 and 2000. The model correctly forecasts (out of sample) the winner of every election but three (1948, 1976, and 1980), which yields a call ratio of 86%. (The call ratio is the percent of all elections where the victor in the two-party vote was correctly identified.) Although the largest absolute error, incurred with the 1980 election, is high, the error exceeds 3% in only three elections (1932, 1948, 1980), or 14% of the total, exactly the same proportion as in Campbell's “trial heat” model (Campbell 2004a, 766). Both the mean and the median absolute error are less than 2%, and in almost one-third of the elections (7 of 22) the error amounted to less than 1%.
To generate a forecast for 2004, we proceeded as follows. First, since George W. Bush is a Republican president in the first term of a party reign, PARTY = 1 and DURATION = 0. Next, we estimated the direction of fiscal policy. As a percent of GDP, federal spending rose from 18.4 in 2000 to 19.9 in 2003, which was the latest estimate we had when we made the forecast. By no means confined to military spending, this was the largest growth in outlays in a quarter of a century. It represented a reversal of President Bill Clinton's two consecutive fiscal cutback terms and, not coincidentally, raised eyebrows on the Right (DeHaven 2004; de Rugy and DeHaven 2003; Hassett 2003; Riedl 2003). In short, in his first term Bush implemented an expansionary policy. Thus, FISCAL = 1.
All that remains is to plug into the model the values of GROWTH and ALLNEWS. Beginning in November, 2001, Fair posted forecasts of the values that his variables, including Bush's share of the two-party vote, would take on Election Day (see Fair's “Post-mortem” at http://fairmodel.econ.yale.edu/). For GROWTH and GOODNEWS (ALLNEWS in our model-see Table 1), these ranged, respectively, from 1.5 to 2.9% and from 1 to 3. Entering the July 31, 2004, estimates of 2.7 and 2, respectively (see August 1 update in Polly's Page at politicalforecasting.com), the fiscal model yields a point forecast of 51.1% of the two-party vote for Bush. Since the SEE of the model is 1.97, the prediction interval overlaps the 50% threshold of victory. In other words, the forecast lies within a range which included the very real possibility that the election could have gone the other way (see below). In fact, the probability of Bush taking a majority of the two-party vote was only 2/3, and of receiving more than 51%, a margin sufficient to forestall an adverse outcome in the Electoral College, a mere 0.51. Anticipating a close contest, we advised our readers to plan on staying up late on Election Night (Cuzán and Bundrick 2004). Indeed, it wasn't until the following afternoon that Democrat John Kerry conceded defeat. And, as it turned out, the forecast came within 0.1% of Bush's actual share, which was 51.2% (uselectionatlas.org).
The Fiscal Model and the Campbell Collection Compared
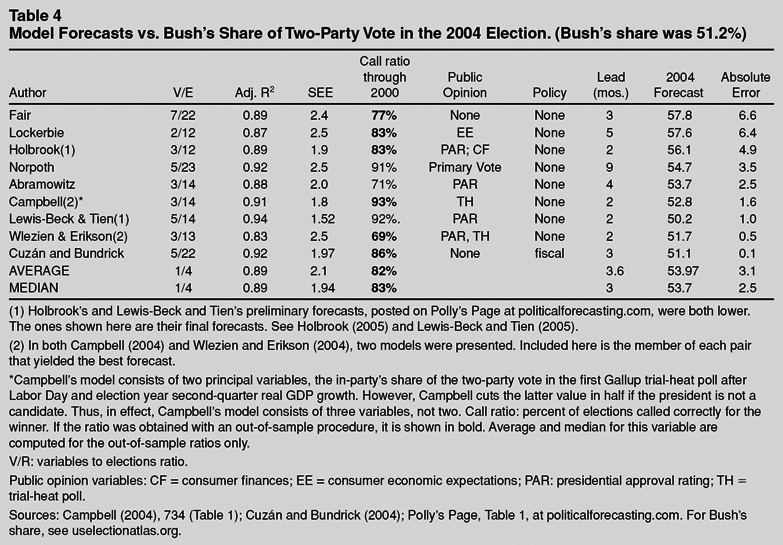
In Table 4 we compare the fiscal model with the Campbell Collection and Fair's presidential vote equation on operational and substantive criteria. On model fit, assessed with the R2 and SEE statistics, most models, including the fiscal model, are close to a mean of around 0.90 and 2.0, respectively, with Wlezien and Erikson's, Lockerbie's, and Fair's doing less well than the mean and Lewis-Beck and Tien's performing better than the mean. The median number of elections accounted for is 14, with Fair's, Norpoth's, and the fiscal model each including more than 20 elections. On the variables to elections ratio (V/E), most models, including the fiscal model, converge around a mean ratio of 1:4. Fair's and Lewis-Beck and Tien's are variable-heavy while Abramowitz's and Campbell's are the most parsimonious. Comparing only those models for which the call ratio was calculated with the out-of-sample procedure, the fiscal model ranks second, after Campbell's, while Wlezien and Erikson's and Fair's10
Fair reports the in-sample call ratio, but we calculated the out-of-sample ratio.
place last and next-to-last, respectively. Regarding lead, as with Norpoth's, one can generate forecasts with Fair's and the fiscal model early in the election year or even before then. However, while Norpoth's forecast is not subject to revision, those for the latter two are, as every succeeding quarter brings new data and presumably more accurate economic estimates. For the purpose of comparing the fiscal model with the rest of the Campbell Collection, we picked the August forecast, which occupies the median place (three months).
On the last of the operational criteria, how well the forecasts did this year, all models correctly picked the winner, even if by varying degrees of precision. So in this sense all were successful (Campbell 2005). However, in another sense Fair's and Lockerbie's models were clearly not successful, as they over-estimated Bush's margin of victory by over six points, or two and a half times the model's SEE. Although less so, Norpoth's and Holbrook's were deficient on this score, too. None of those models anticipated the highly competitive nature of this year's election.
At 51.2% of the two-party vote, President Bush was reelected by the slenderest majority won by any sitting president since Cleveland edged out Harrison in 1888, only to lose in the Electoral College. In fact, President Bush narrowly escaped defeat there, as well. At 286 electoral votes, only 16 above the minimum required for reelection and 53.1% of the total, Bush's margin was the thinnest since Woodrow Wilson's in 1916. If Ohio, where Bush's total exceeded Kerry's by less than 120,000 votes, or 2.1%, had gone the other way, President Bush would have shared Cleveland's fate.
Only three forecasts, those of Lewis-Beck and Tien, Wlezien and Erikson, and the fiscal model, conveyed how dicey Bush's prospects to retain the presidency actually were, a situation reflected in the polls all the way up to the eve of the election. (The average Bush share of the two-party vote in the 14 polls published in the two days prior to the election was 50.8%. See Polly's Page at politicalforecasting.com.) And of those three, only two came within less than one percent point of the actual Bush vote. On this score, the clear winners are Wlezien and Erikson's model (51.7%) and the fiscal model (51.1%).
Next we compare the models on substance, namely, the kind of variables used as predictors. Regardless of their forecasting accuracy, models that include one or more measures of public opinion to explain voting are less theoretically interesting than those that do not. The former involve a certain circularity, e.g., on Election Day voters will cast their ballots for the candidate they preferred in September (as in Campbell's model) or of the party they voted for in the previous election (as in Norpoth's). By contrast, models that do not explain voter choices by what the voters themselves were thinking or doing two months or four years earlier offer more causal insights. All the models in the Campbell Collection are of the first variety. They rely on one or more measures of public opinion or previous voter choices to forecast how the election will turn out. Wlezien and Erikson's is a case in point. Two of its three variables consist of survey data: the presidential approval rating half-way through the election year and trial heat polls pitting the incumbent party candidate against the challenger all the way into November.
By contrast, survey data do not make up any of the variables in the fiscal model. Moreover, only the fiscal model includes as a predictor a metric of what government actually does and for which, presumably, the voters hold the president or his party's candidate accountable, namely, fiscal policy.11
In an otherwise sympathetic review of Fair (2002), Armstrong (2003) notes the lack of a policy variable in Fair's presidential vote equation.
In terms of this model, Bush's meager majority was a consequence of his pursuing an expansionary fiscal policy, something that was not offset by extraordinary economic performance, as it was for Reagan in 1984, when GROWTH was nearly twice and ALLNEWS four times its 2004 value (see Appendix). What saved Bush from defeat was that he was a Republican facing the voters at the end of only the first term of a party reign.
In sum, by the light of the fiscal model the 2004 election turned out just as one would have expected. Be it noted that this model did not originate as a forecasting tool. Rather, it was designed to test what many of our contemporaries regard as a counter-intuitive hypothesis, namely, that voters are allergic to fiscal expansion. Forecasting is simply another way to evaluate empirically the validity of this idea. That the model performs so well at predicting the outcomes of presidential elections over a relatively long series constitutes what is perhaps the strongest evidence in its favor. As Ashby puts it, “test by demonstration is always treated as the ultimate test, let plausibility say what it will…. The operational test is the last court of appeal” (1970, 103–104).
Also, alone among its peers, the fiscal model offers practical advice for professional politicians. It says to presidents that if they wish to maximize the probability of keeping the White House in their own or their party's hands, they should forego a policy of fiscal expansion. This does not mean that spending cannot be increased. Spending can (and arguably should) expand in absolute terms to keep pace with population and economic growth. It can even rise relative to GDP without adverse electoral consequences, provided that the increase is less than what took place in the preceding term. What a president cannot do, absent a war commanding widespread support, as was the case in Franklin D. Roosevelt's third term but not in George W. Bush's first,12
In an MSNBC 2004 Election Day exit poll, only 51% of respondents approved of the original decision to go to war in Iraq.
is to increase spending relative to the rest of the economy at the same or greater rate than in the previous administration.
Incidentally, a prescription for fiscal frugality is not new. As long ago as the 16th century Machiavelli (1997, 59) wrote:
if he is prudent, [a prince] must not worry about the reputation of miser: because with time he will be considered even more liberal, when it is seen that because of his parsimony his income suffices him, that he can defend himself against whomever makes war on him, and that he can undertake enterprises without weighing down the peoples; by which token he comes to use liberality toward all those from whom he does not take, who are infinite, and miserliness toward all to whom he does not give, who are few.
An earlier draft was presented at the Northeastern Political Science Association Roundtable, “Hindsight is 20/20: Deconstructing the 2004 Presidential Election Forecasts,” Boston, November 13, 2004. Many thanks to Alan Abramowitz, J. Scott Armstrong, James Campbell, Bruce Caswell, Cal and Janet Clark, Robert Erikson, Ray Fair, Victoria FarrarMyers, Randall J. Jones, Jr., William Keech, William Niskanen, Sam Peltzman, Gordon Tullock, Chris Wlezien, and J. Mark Wrighton for their questions, criticisms, suggestions, or encouragement.