Introduction
Surface-enhanced Raman scattering (SERS) is an interesting phenomenon in which the Raman signals of the molecules adsorbed on a SERS-active nanostructure can be enormously enhanced [Reference Campion and Kambhampati1, Reference Xu, Aizpurua, Kall and Apell2]. Over the last decades, SERS has attracted widespread attention in the fields of chemical, material, and life sciences due to its ultrahigh sensitivity and selectivity [Reference Verma, Rao, Sathe, Bhartiya, Patel, Kaul and Singh3, Reference Smolsky, Kaur, Hayashi, Batra and Krasnoslobodtsev4, Reference Ko, Fang and Chen5, Reference Prakash, Sun, Swart and Gupta6]. It is generally agreed that the electromagnetic (EM) enhancement is major contributor to SERS processes [Reference Moskovits7]. The EM effect arises from the localized surface plasmon resonance occurred preferentially in the nanostructures of noble metals, such as nanopore, nanogap, nanosharp, and crevice [Reference Stiles, Dieringer, Shah and Van Duyne8].
Therefore, nanoporous metals, such as Ag and Au, have been widely studied for SERS substrates owing to their high local EM fields [Reference Ma, Trujillo and Camden9, Reference Qian, Yan, Fujita, Inoue and Chen10]. Nanoporous metals are usually prepared by template and dealloying [Reference Lee, Park, Hwang, Kang, Yim and Kim11, Reference Lawanstiend, Gatemala, Nootchanat, Eakasit, Wongravee and Srisa-Art12, Reference Li, Song, Sun, Yang, Ding, Yang, Yang and Wang13, Reference Li, Song, Lu, Sun, Yang, Yang and Ding14]. Thereinto dealloying has been proven to be a feasible and efficient approach to prepare nanoporous metals. Dealloying is essentially a corrosion process during which the relative active elements are selectively removed from a precursor alloy and the residual noble elements form a porous structure with interconnected channels [Reference Erlebacher, Aziz, Karma, Dimitrov and Sieradzki15]. However, the coarsening of pore/ligament is unavoidable during dealloying a crystalline alloy [Reference Jin, Li, Zuo and Zhang16]. Furthermore, it has been reported that some semiconductor oxides and sulfides, such as TiO2, ZnO, CuO, and MoS2, can also exhibited SERS ability in a certain degree, whose enhancement may be ascribed to the CT mechanism [Reference Han, Ji, Zhao and Ozaki17, Reference Yan, Qiu, Chen, Liu, Lai, Meng, Song, Liu, Liu and Zhan18, Reference Sun, Hu, Zhan, Yan, Liu, Teguh, Yeow and Lee19]. Chang et al. [Reference Chang, Ruan, Wu and Huang20] found that the CeO2 loaded on Ag nanoparticles could significantly improve the SERS performance. Therefore, the hybrid structure containing noble metal and oxide should exhibit an enhanced SERS active because of the synergistic interactions [Reference Chen, Shen, Huang, Zhu, Xiong and Ouyang21, Reference Jiang, Li, Fang and Wang22].
Traditionally, nanoporous metal/oxide nanocomposites were prepared by the implantation or deposition method [Reference Rao, Wang, Kups, Baradács, Parditka, Erdélyi and Schaaf23, Reference Biener, Biener, Wichmann, Wittstock, Baumann, Bäumer and Hamza24, Reference Shi, Schaefer, Wichmann, Murshed, Gesing, Wittstock and Bäumer25]. Recently, Fu et al. [Reference Fu, Lang, Hou, Wen, Zhu, Zhao, Li, Zheng, Liu and Jiang26] prepared nanoporous Au/SnO/Ag heterogenous films by the implantation of SnO nanoparticles into nanoporous Au/Ag bimetallic films. The hybrid films exhibited extraordinary SERS enhancements owing to the strong coupling effect among the protrusions. Nevertheless, the introduction of particles inside a porous structure will inevitably result in the blockage of pore channels due to the high-aspect-ratio. In recent years, many nanoporous metal/oxide nanocomposites prepared by dealloying have been reported [Reference Qiu, Peng, Li, Xu and Wang27, Reference Li, Lu, Wei, Song, Sun, Yang and Yang28, Reference Qi, Gong, Zhang, Xu, Wang, Zhao, Ji and Zhang29]. The oxide nanoparticles could be generated on the inner surface of a nanoporous metal during dealloying, resulting an enhanced interfacial interaction. And, the blockage of pore channels could be avoided. The uniformity of the prepared nanoporous materials, however, is easy to be affected by the complicated microstructure of precursory alloy.
Recently, we have developed a novel strategy, i.e., de-oxide, to prepare nanoporous CeO2 catalysts with different contents of Ag by etching the CuO/CeO2/Ag2O precursors for CO oxidation [Reference Li, Zhang, Feng, Fang and Liu30]. The interfacial interaction between CeO2 ligament and Ag particle resulted in an enhanced catalytic activity. In present work, we proposed the de-oxide strategy to prepare nanoporous metallic Ag with ultrafine CeO2 nanoparticles. This procedure involved the dissolution of ZnO in precursors and formation of porous Ag. Meanwhile, the residual CeO2 dispersed on the inner surfaces of Ag ligaments. The formation mechanism and microstructure were essentially different from the nanoporous Ag/CeO2 composite materials prepared by dealloying for electrochemical catalysis in our previous work [Reference Li, Lu, Wei, Song, Sun, Yang and Yang28]. The phase structures, microstructures, and interaction of the prepared nanoporous Ag/CeO2 materials were analyzed in detail. The performances of SERS active substrate including sensitivity were investigated. The synergetic contribution of the prepared nanoporous Ag and loaded CeO2 to SERS enhancement was discussed.
Results and discussion
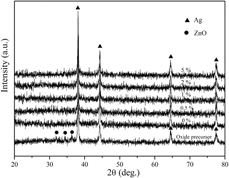
Figure 1 shows X-ray diffraction (XRD) patterns of the precursors and the as-prepared Ag/CeO2 materials with different contents of CeO2. The phase presents of the precursor, as shown in Fig. 1, consisted of Ag and ZnO. After the precursor was etched in NaOH solution, the diffraction peaks of ZnO disappeared and only Ag phase was found. Therefore, it could be proved that ZnO was removed completely. While, the diffraction peak of CeO2 was not found.
XRD patterns of the precursors and the prepared Ag/CeO2 materials with different CeO2 contents.

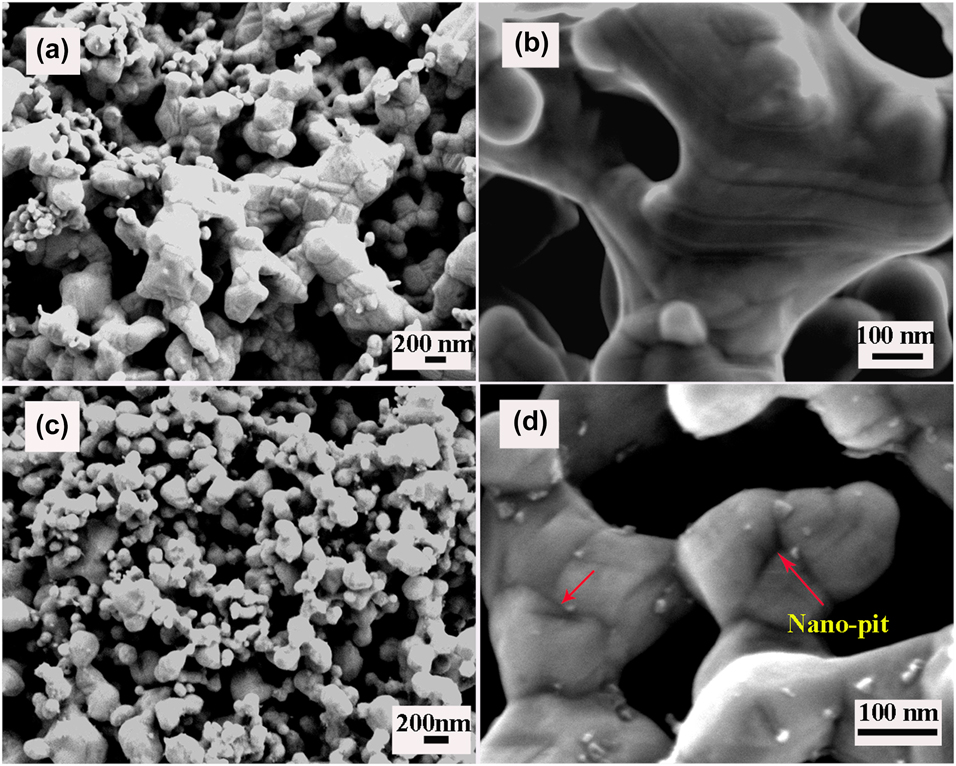
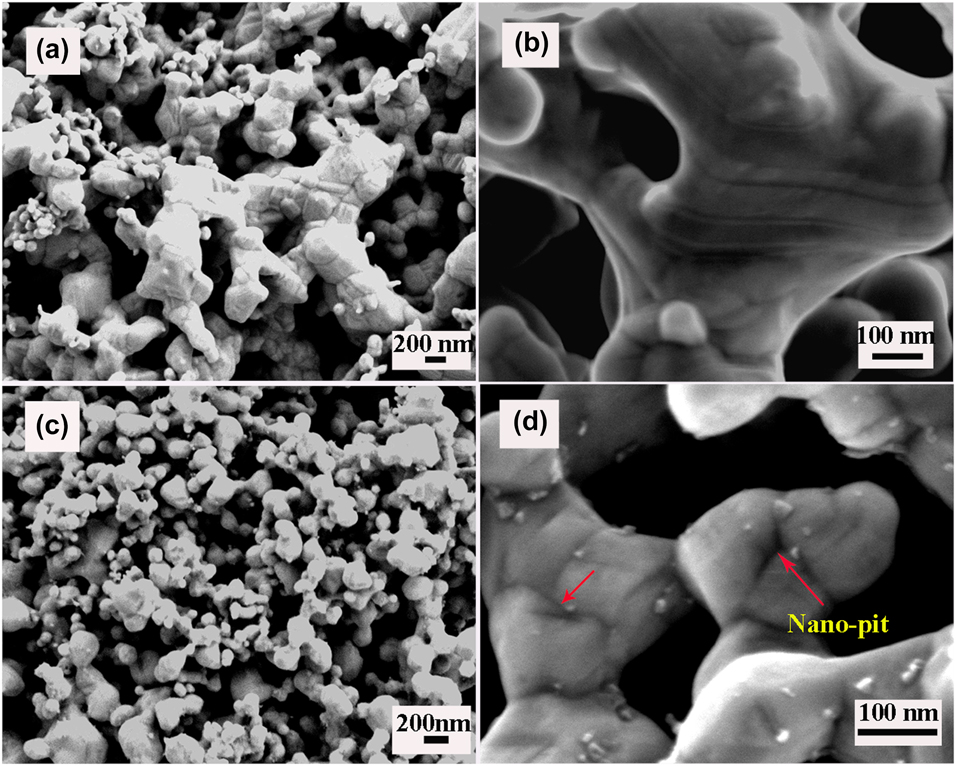
Figure 2 illustrates the scanning electron microscope (SEM) images of the as-prepared porous Ag and Ag/CeO2(0.5%) materials. The morphology of the etched Ag/ZnO precursor exhibited a bicontinuous porous structure and the pore channels ran throughout the whole sample, as shown in Fig. 2(a). Obviously, the ligaments were very large, which presented a rod-like shape with some small particles. From the SEM image at a higher magnification, as shown in Fig. 2(b), it could be found that the surface of the irregular ligament was very smooth. However, as can be seen in Fig. 2(c), the morphology of the as prepared Ag/CeO2(0.5%) materials exhibited a very uniform porous structure and the pore/ligament sizes were decreased obviously. In Fig. 2(d), it can be seen that many particulates less than 15 nm were distributed on the surface and junction of the grainy ligaments. Interestingly, it was noticed that the surfaces of Ag ligaments became very rough and some nanopits could be observed, as marked by the arrow in Fig. 2(d). The rough surface of ligaments should be a characteristic feature, which was to be distinguished from that of the nanoporous metals prepared by dealloying.
SEM images of the nanoporous Ag (a, b) and Ag/CeO2(0.5%) (c, d) materials.
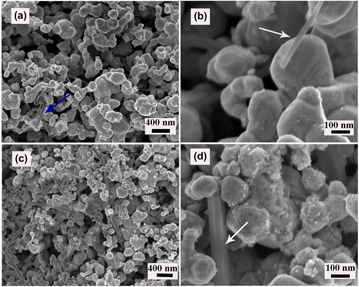
With the increase of CeO2 from 0.5 to 1%, the microstructure of the materials was further refined, as shown in Fig. 3(a). The pits observed on the surface of Ag ligaments, however, disappeared and the distribution of small particles became uneven. Obviously, some nanorods distributed among the ligaments, as marked by the arrow in Fig. 3(b). With the CeO2 content increased to 5%, the size of nanorods became very larger and the surface of ligaments were covered unevenly by many floccules, as shown in Figs. 3(c) and 3(d). In the Supplementary material, elemental analysis indicated that the nanorods were made up of CeO2 (Fig. S1). The contents of Ce and Zn in the nanoporous Ag/CeO2(5%) were 5.16 and 0.07 wt%, respectively (Fig. S2 in the Supplementary material). It was further confirmed that the ZnO in precursors was almost completely removed and the Ag/CeO2 composite materials were formed, which was in agreement with the theoretical composition.
SEM images of the nanoporous Ag/CeO2(1%) (a, b) and Ag/CeO2(5%) (c, d) materials.

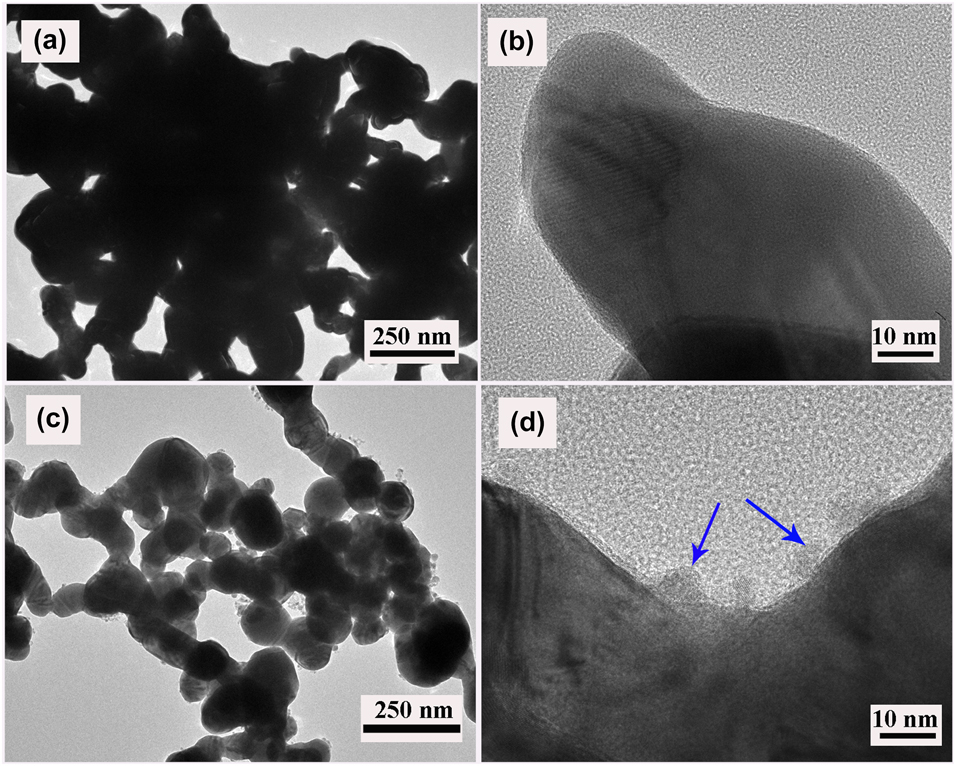
Figure 4 shows the transmission electron microscopy (TEM) and high resolution transmission electron microscopy (HRTEM) images of the prepared nanoporous Ag and Ag/CeO2(0.5%) materials. As can be seen from Figs. 4(a) and 4(c), the prepared Ag and Ag/CeO2 materials exhibited bicontinuous porous structure. The ligaments of Ag/CeO2 materials were obviously refined, which was in agreement with the SEM observation in Fig. 2. Compared with porous Ag, as shown in Figs. 4(b) and 4(d), it was noticed that some small particles about 10 nm appeared on the ligaments of Ag/CeO2 materials. From HRTEM images, as shown in Fig. 4(d), it could be proved that the particulates were CeO2. Figure S3 in the Supplementary material shows the pore size distribution and N2 adsorption–desorption isotherms curves of the prepared nanoporous Ag and Ag/CeO2 materials. It was found that the pore sizes were primarily distributed in the range of ∼10 nm.
TEM and HRTEM images of the nanoporous Ag (a, b) and Ag/CeO2(0.5%) materials (c, d).

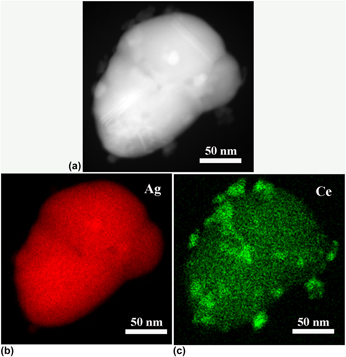
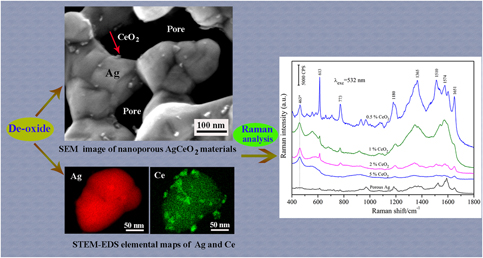
Figure 5 shows the STEM-HAADF images of a ligament in the nanoporous Ag/CeO2(0.5%) materials and the corresponding energy dispersive X-ray spectroscopy (EDS) elemental maps of Ag and Ce. As can be seen in Fig. 5(a), some small particles were distributed on the ligament. Based on Figs. 5(b) and 5(c), it can be clearly demonstrated that the larger ligament was metal Ag and the distributed small particles were CeO2. The results further confirmed that the small particles were CeO2 in nanoporous structure, as shown in Figs. 2(d) and 4(d).
STEM-HAADF image (a) of the nanoporous Ag/CeO2(0.5%) materials and the corresponding EDS elemental maps of Ag (b) and Ce (c).

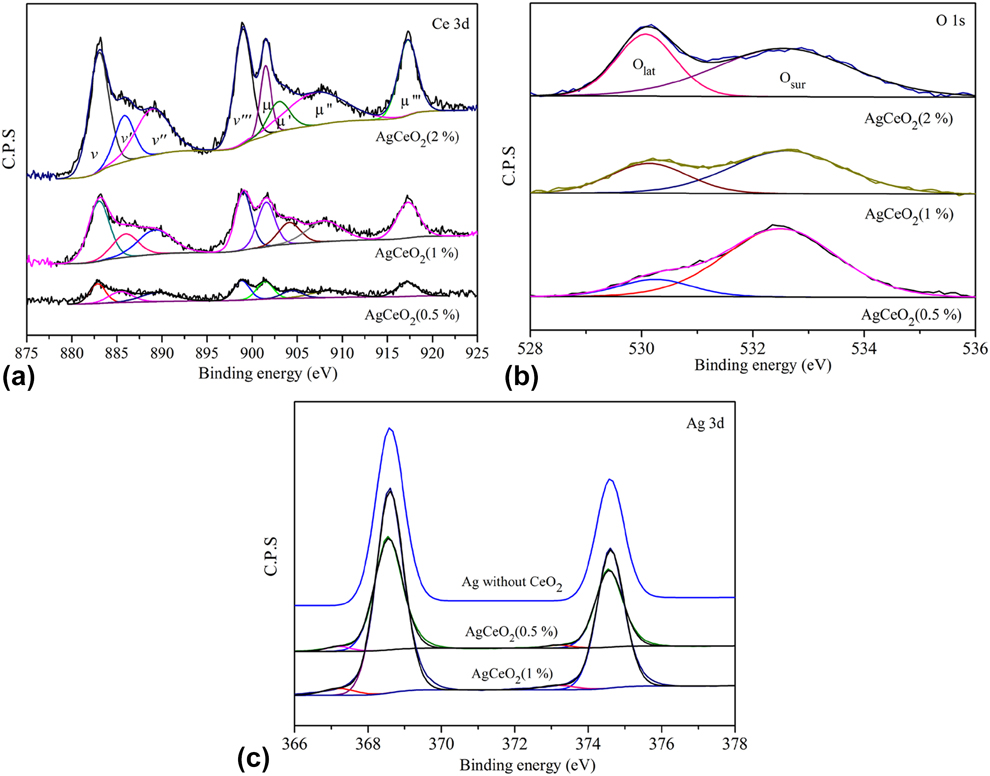
Figure 6 presents the X-ray photoelectron spectroscopy (XPS) spectra of Ce 3d, Ag 3d, and O 1s of the nanoporous Ag/CeO2 materials. As shown in Fig. 6(a), the peaks at 917.3 (μ‴), 908.6 (μ″), 901.6 (μ), 898.8 (v‴), 889.5 (v‴), and 882.8 eV (v) were attributed to the level of Ce4+ [Reference Lykaki, Pachatouridou, Iliopoulou, Carabineiro and Konsolakis31, Reference Santos, Carabineiro, Bakker, Soares, Chen, Pereira, Órfão, Figueiredo, Gascon and Kapteijn32], while the other peaks at 904.4 (μ′) and 885.5 eV (v′) were assigned to Ce3+ [Reference Kato, Ammann, Huthwelker, Paun, Lampimäki, Lee, Rothensteiner and van Bokhoven33]. The O 1s spectra of the prepared nanoporous Ag/CeO2 were shown in Fig. 6(b). The peak at about 530 eV could be assigned to lattice oxygen (Olat). And then, the peak at about 532 eV was attributed to surface adsorbed oxygen ions (Osur) on surface oxygen vacancies [Reference Konsolakis, Sgourakis and Carabineiro34]. In addition, the peaks at about 368.5 and 374.5 eV, as shown in Fig. 6(c), were attributed to metallic Ag [Reference Schoen35]. Compared with nanoporous Ag, the extra peaks appeared at about 373 and 367 eV on the Ag/CeO2 materials were characteristic of Ag2O [Reference Gaarenstroom and Winograd36]. The above results proved that a certain amount quality of Ce3+ and Ag ions coexisted in the nanoporous composites due to the interaction between Ag ligament and CeO2. Based on the corresponding peak areas, the relative concentration ratios of Ce3+, Ag+, and Osur in the nanoporous Ag/CeO2 were shown in Table SI in the Supplementary material. It was noticed that the adsorbed oxygen ions significantly reduced with the formation of more CeO2 in porous Ag. The relative quantities of Ag2O and Ce3+, however, increased to a certain degree.
XPS spectra of Ce 3d (a), O 1s (b), and Ag 3d (c) for the prepared nanoporous Ag/CeO2 materials with different contents of CeO2.

XPS and EDS elemental maps results confirmed that the nanoporous Ag/CeO2 materials were successfully prepared by etching Ag/ZnO/CeO2 precursors in a NaOH solution. As we all know, ZnO is easy to react with NaOH aqueous to produce soluble Na2ZnO2, while the CeO2 phase in the precursor is very stable in NaOH solution. The CeO2 has not been detected by XRD possibly because of its low content or crystallinity. During de-oxide, the Ag phase should be remained and formed a nanoporous structure after ZnO was removed. At the same time, the released CeO2 was evenly distributed on the inner surfaces of Ag ligaments. However, the distribution of CeO2 became uneven due to the formation of mixture structure with nanorods and nanoparticles, resulting in a decrease of interfaces the between Ag and CeO2.
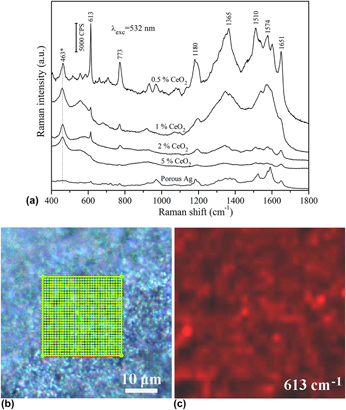
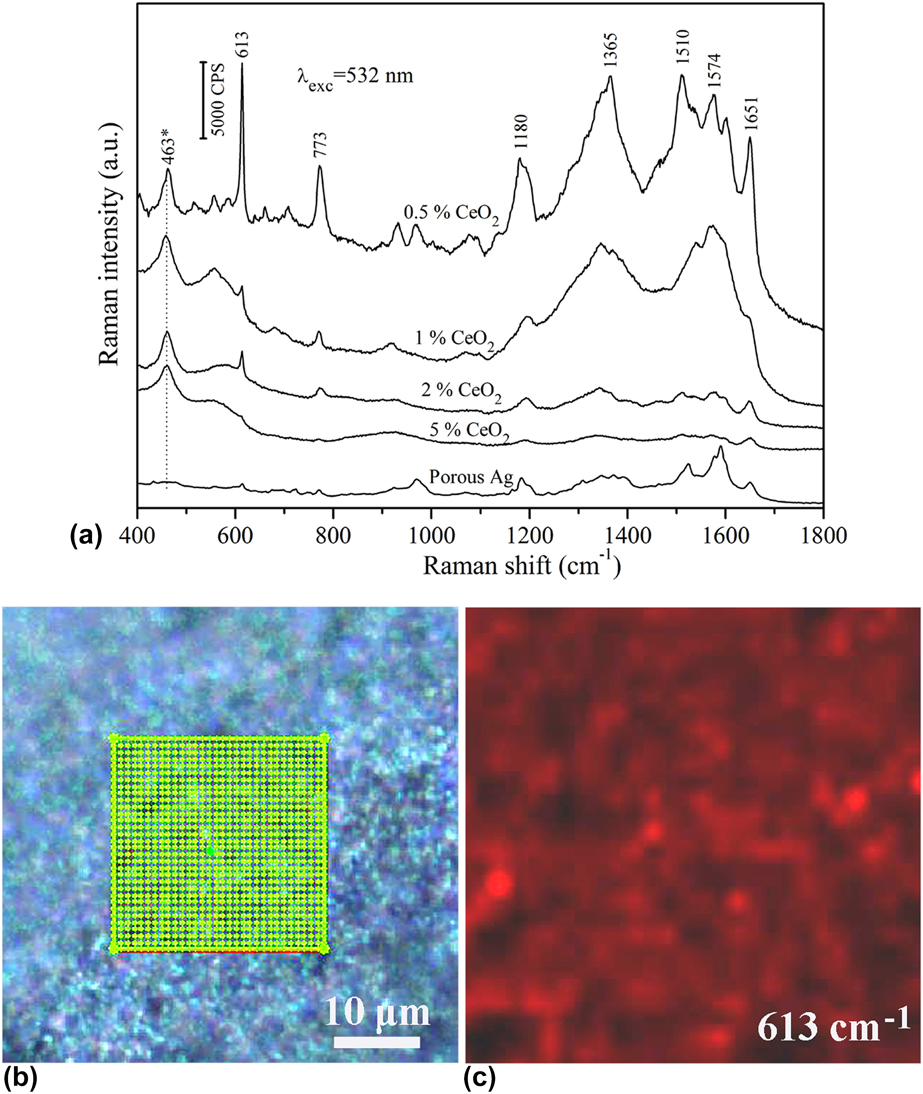
Figure 7(a) shows the SERS spectra of R6G with a concentration of 10−5 M collected from the nanoporous pure Ag and Ag/CeO2 substrates with different CeO2 contents. Obviously, the intensity of the SERS signals from the nanoporous Ag/CeO2(0.5%) substrate was considerably greater than that from the porous pure Ag. As can be seen, there were some visible characteristic peaks of R6G at 613, 773, 1180, 1365, 1574, and 1651 cm−1. Compared to pure Ag, the peak intensity at 613 cm−1 on the Ag/CeO2(0.5%) substrates was increased about 26 times. In addition, the peaks at about 463 and 550 cm−1 were assigned to the F2g mode of CeO2 and the oxygen vacancies, respectively [Reference Weber, Hass and McBride37]. The peak at 660 cm−1 corresponded to the second-order longitudinal optical (2LO) mode resulted from the surface-adsorbed oxygen species [Reference Wu, Li, Howe, Meyer and Overbury38]. However, with the increase of CeO2, the SERS intensity on the nanoporous substrates was decreased obviously. Besides, it was noticed that the peak at 660 cm−1 disappeared, meaning that the surface-adsorbed oxygen species were reduced. Figure 7(c) shows the point-by-point Raman mapping of R6G on a 25 × 25 μm2 area selected from the Ag/CeO2(0.5%) substrates [Fig. 7(b)]. Obviously, the distribution of the Raman intensity was homogenous, which indicated that the SERS signal was reproducibility and the structure of the prepared materials was uniform.
SERS spectra of R6G with a concentration of 10−5 M collected from the nanoporous pure Ag and Ag/CeO2 materials with different contents of CeO2 (a), white light image of the nanoporous Ag/CeO2(0.5%) materials (b), and SERS intensity map at 613 cm−1 on a selected 25 × 25 μm2 area (c).
The SERS enhancement factor (EF) of the nanoporous Ag/CeO2 materials is difficult to estimate by average SERS EF. The main reason is that the average number of molecules adsorbed on the hotspots, such as CeO2 nanoparticles, junctions, and nanopits, is not easy to obtain accurately. Therefore, the analytical enhancement factor (AEF) was used to estimate the SERS active based on the related studies [Reference Hsiao, Chen, Yang, Chen, Lee and Chiu39]. The AEF can be defined as Eq. (1) [Reference Le Ru, Blackie, Meyer and Etchegoin40]
 $${\rm{AEF}} = {{\left( {{{{I_{{\rm{SERS}}}}} / {{C_{{\rm{SERS}}}}}}} \right)} / {\left( {{{{I_{{\rm{RS}}}}} / {{C_{{\rm{RS}}}}}}} \right)}}\quad ,$$
where I SERS is the SERS intensity obtained from a SERS-active substrate with an analyte concentration C SERS. I RS represents the Raman intensity of an analyte with a concentration C RS on a non-SERS substrate. In this work, the nanoporous Ag/CeO2(0.5%) materials were employed as SERS-active substrate, while a glass plate was used as the non-SERS substrate. The Raman signals of R6G on these substrates were showed in Fig. S4 in the Supplementary material. The I SERS and I RS were obtained from the peaks at 613 cm−1. The averaged AEF of the nanoporous Ag/CeO2(0.5%) substrates was estimated to be about 1.2 × 10⁸.
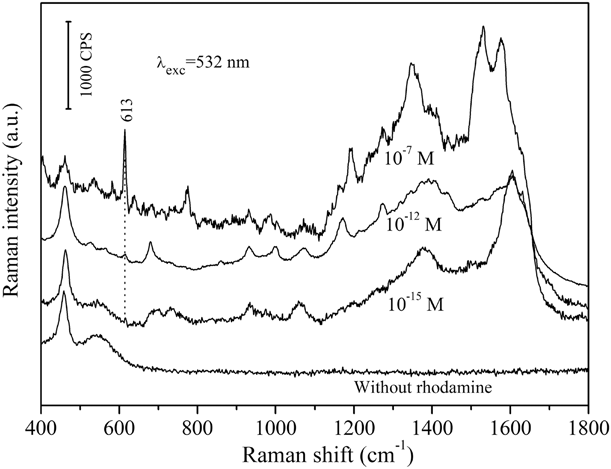
In order to estimate the detection sensitivity of the prepared nanoporous materials, the SERS spectra of R6G with low concentrations from 10−7 to 10−15 M dispensed on the Ag/CeO2(0.5%) substrates were measured. As shown in Fig. 8, the signal intensity became gradually weaker as the concentration decreased. However, the typical Raman peaks of R6G were identified clearly. The results indicated that the Ag/CeO2 substrates were highly suitable for the detection of small molecules. The high sensitivity of the nanoporous Ag/CeO2 substrates should be attributed to the coupling effect between nanostructures and ultrafine CeO2 nanoparticles. In addition, it is found that the positions of Raman peaks at 1510 and 1574 cm−1 stemmed from aromatic C–C stretching vibrations showed gradual blue shift with the decrease of R6G concentration, which should be ascribed to the distinct charge transfer between substrates and probe molecules [Reference Zhao, Zhang, Ai, Zhang, Cao, Liu, Sun, Wang and Lu41].
SERS spectra collected from the nanoporous Ag/CeO2(0.5%) materials with 10−7, 10−12, 10−15 M and without R6G.

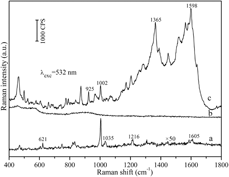
The Raman spectrum of L-phenylalanine powder was shown in Fig. 9(a). Obviously, the peaks at 621, 1002, 1035, 1216, and 1605 cm−1 were observed, which could be ascribed to the vibrational modes involving the benzene ring [Reference Kim, Kim and Suh42]. Figures 9(b) and 9(c) shown the SERS spectra of 10−3 M aqueous solution of L-phenylalanine in Ag/CeO2/ZnO precursor and the prepared nanoporous Ag/CeO2(0.5%) materials. The enhanced peaks in the SERS spectra occurred at about 925, 1002 1054, 1365, and 1598 cm−1, as shown in Fig. 9(c). The results suggested that the prepared nanoporous Ag/CeO2 materials by decomposing the oxide precursor had also a significant enhanced SERS effect on the biomolecules molecules.
Ordinary Raman spectra of L-phenylalanine powder (a) and SERS spectra of 10−3 M aqueous solution of L-phenylalanine in precursor (b), and nanoporous Ag/CeO2(0.5%) materials (c).

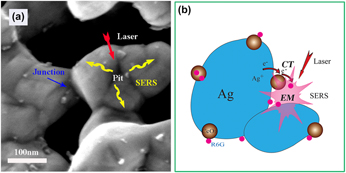
Schematics of the electromagnetic enhancement (a) and charge-transfer mechanism (b) contributed to the SERS enhancement of adsorbed R6G molecule in the nanoporous Ag/CeO2 materials.

It is almost accepted that EM enhancement plays a dominant role on the enhancement of SERS, which is direct related to metal nanostructures, i.e., hotspots, such as nanospheres or nanorods. However, probe molecules attached to the single hotspot usually exhibit a moderate SERS spectrum. The coupled nanostructures should be considered to achieve more intense SERS activity [Reference Ding, You, Tian and Moskovits43]. For example, the Ag nanoparticles with ultra-small nanogaps (0.8 nm) exhibited the excellent SERS behaviors. In this work, the prepared nanoporous Ag/CeO2(0.5%) substrates showed a remarkable SERS performance compared with pure Ag, which was ascribed to the coupling effect between nanostructures and CeO2 nanoparticles. Based on nanostructures, more junctions appeared between two Ag ligaments due to the refinement of Ag/CeO2 materials [Figs. 2(b) and 2(d)]. The junction can act as the hotspots because the chemisorbed R6G molecule may interact directly with the metallic excited-state wave function [Reference Michaels, Jiang and Brus44]. On the same principle, the nanopits appeared on the surfaces of Ag ligaments [Fig. 2(d)] should also serve as hotspots for SERS intensity, as shown in Fig. 10(a).
In addition to nanostructures, surface electronic structure also plays an important role in determining the character of the charge transfer state responsible for the chemical enhancement in SERS [Reference Campion and Kambhampati1]. With the formation of CeO2, Ag+, and Ce3+ were detected in the nanoporous Ag/CeO2(0.5%) substrates (Table SI in the Supplementary material), which indicated that a certain amount quality oxygen vacancies were formed due to the interfacial interaction. Oxygen vacancy can bring significant Raman enhancement for R6G molecule by the means of the efficient charge transfer between the substrate and the adsorbed molecule [Reference Cong, Yuan, Chen, Hou, Yang, Su, Zhang, Li, Li, Geng and Zhao45]. As effective adsorption sites, therefore, CeO2 nanoparticle distributed on Ag ligament can act as an electron-trapping center in nanocomposites [Fig. 10(b)]. Moreover, some CeO2 nanoparticles were distributed nearby the junctions and nanopits in the nanoporous structure. The coupling effect between nanostructures and CeO2 nanoparticles was responsible for the enhanced SERS activity. However, with the increase of CeO2, the intensity of the R6G signals from the nanoporous Ag/CeO2 substrate with more oxygen vacancies was considerably decreased. The mixture structure containing nanorods should counteract the interaction related to charge transfer between Ag and CeO2 (Fig. 3). On the other hand, the roughness of a SERS substrate can promote the enhancement of SERS activity [Reference Lee, Robertson, Nguyen, Kahraman and Wachsmann-Hogiu46]. The ligament of nanoporous Ag/CeO2 substrates with more CeO2 showed a smooth surface, which was against the EM enhancement [Reference Zhao, Liu, Lei and Chai47]. Furthermore, due to the formation of nanorod structures, CeO2 particles could not disperse equally on the surface of Ag ligaments [Fig. 3(b)]. The interface interaction between Ag and CeO2 was weakened. As a result, the Osur was decreased by about 20% with the increase of CeO2 content from 0.5 to 1% (Table SI in the Supplementary material). In this case, the SERS actives of the nanoporous materials were significantly decreased or disappeared even [Fig. 7(a)]. In addition to EM and CT enhancements, it was considered that surface adsorbed oxygen ions can also contribute to the enhanced SERS due to the O–O vibrations [Reference Nguyen, Kang, Chiang, Chen, Seideman, Hersam, Schatz and Van Duyne48]. As a result, the best percentage of the CeO2 in the nanoporous Ag/CeO2 materials should be controlled to about 0.5%.
Conclusions
In this work, nanoporous Ag/CeO2 materials were successfully prepared by a facile method of de-oxide. With the removal of ZnO from the Ag/CeO2/ZnO precursors, the bulk nanoporous Ag containing different morphologies of CeO2 were successfully obtained. More junctions and nanopits appeared in the prepared nanoporous Ag/CeO2(0.5%) materials in comparison with Ag without CeO2. A large number of surface adsorbed oxygen ions were formed in the Ag/CeO2(0.5%) materials because of the interfacial interactions between Ag ligament and CeO2 nanoparticles. The nanoporous Ag/CeO2 materials as SERS substrates exhibited highly enhancement and sensitivity to the detection of R6G molecules, depending on the content and shape of CeO2. The calculated EF value of the R6G adsorbed on Ag/CeO2(0.5%) materials was about 1.2 × 10⁸. With the further addition of CeO2, the rod-like structures appeared in the nanoporous, resulting in a decrease of SERS actives. In addition, the prepared nanoporous Ag/CeO2 materials had also an enhanced SERS performance on the L-phenylalanine molecules. The excellent SERS performances can be ascribed to the coupling effect between nanostructures and CeO2 nanoparticles. It is expected that this work could be useful to design metal based nanoporous composites for practical application in the fields of SERS technology.
Experimental
Preparation of Ag/ZnO and Ag/ZnO/CeO2 precursors
A conventional co-precipitation method was used to prepared Ag/ZnO and Ag/ZnO/CeO2 mixtures. The mol ratio of Ag to Zn was 3:2 and the nominal contents of CeO2 in Ag were set to 0, 0.5, 1.0, 2.0, and 5.0 wt%, respectively. First, AgNO3 (99.99%), Zn(NO3)2·6H2O (99.95%), and Ce(NO3)3·6H2O (99.95%) were dissolved in 50 mL of distilled water. The mixture was slowly dropped into a 1 wt% NaOH + 1 wt% PVP(K29-30) solution heated in water bath under magnetic stirring at 70 °C. The black sediment was fully formed in about 10 min. Subsequently, a NaBH4 solution (0.1%) was added for the reduction of Ag+. The suspend solution was agitated for 10 h in 70 °C. After standing for 10 h, the precipitate was centrifuged and washed with distilled water. The isolated substance was dried in a drying oven at 60 °C for 12 h. Finally, the Ag/ZnO/CeO2 oxides powder was prepared after calcination at 350 °C for 2 h.
Preparation of nanoporous Ag/CeO2 materials
The obtained Ag/ZnO and Ag/ZnO/CeO2 precursors were ground into powder and immersed into a 10 wt% NaOH solution at 70 °C. During 24 h corrosion, the powder was washed with ultrapure water and anhydrous ethanol for several times. The nanoporous Ag/CeO2 nanocomposites were finally achieved after the washed reactant was dried at 70 °C.
Characterization
To analyze the phase structures of the precursors and prepared samples, a Bruker D8, Karlsruhe, Germany advanced XRD was used. The morphology of the samples was characterized by a Sigma SEM 300 SEM (ZEISS, Oberkochen, Germany), and a Tecnai G2 F20 scanning transmission electron microscopy (STEM, FEI, Hillsboro, US). The elemental distribution of the sample was analyzed by the FEI talos F200 TEM equipped with an EDS. XPS measurements of the prepared samples were carried out on a K-Alpha spectrometer (Axis Supra, KRATOS, Kyoto, Japan). After degassed at 300 °C, N2 adsorption isotherms of the as-prepared samples were measured by a Micromeritics ASAP 2020, Norcross, US surface area and porosimetry analyzer at 77.3 K. The surface areas and pore size distributions of the prepared samples were calculated by the BET and BJH method, respectively.
SERS measurements
The SERS performance of nanoporous Ag/CeO2 materials was demonstrated using Rhodamine 6G and L-phenylalanine as probe molecules. The prepared materials were separately immersed in R6G (99%) and L-phenylalanine aqueous solution with different concentrations for 150 min and dried in air. The SERS tests were performed using a Raman spectrometer (LabRAMAramis, HORIBA Jobin Yvon, Paris, France). The wavelength of the laser used was 532 nm at laser power of 1.3 mW (R6G) and 0.13 mW (L-phenylalanine). The laser power was reduced to 0.13 mW when. The spectra were collected with an acquisition time of 1 s using 50 × objective. The Raman mapping was recorded on a random 25 × 25 μm2 area selected from a Ag/CeO2(0.5%) substrates immersed in 10−5 M R6G.
Supplementary material
To view supplementary material for this article, please visit https://doi.org/10.1557/jmr.2019.85.
Acknowledgments
This work was financially supported by the Hebei Province Natural Science Foundation of China (E2017210060), Key Project of Hebei Provincial Education Department (Grant No. ZD2018075), and National Natural Science Foundation of China (11872257, 11572358).