1 Introduction
One day in 2008 a French newspaper headline read ‘In Spain, the party's over’Footnote 1, a message echoed in the English pressFootnote 2 and appearing to mark the end of what was known as the ‘Spanish economic miracle’, a period covering from 1994 to 2007. This so-called ‘miracle’ is an extremely widespread myth disseminated by the political classes and is simply another name for the considerable growth in Gross domestic product (GDP) and employment that took place during those years. Year after year, Spain's per capita income drew closer to the European standard, and in 2006 the country overtook Italy in this respect. It seemed only a matter of time before it would catch up with France, but the Spanish success story came to a sudden end.
According to the Active Population Survey (Encuesta de Población Activa, EPA), the unemployment rate (ER) fell from 24.55% of the active population in the first quarter of 1994–7.95% in the second quarter of 2007. Over this period 60% of the jobs in the EU were created in Spain, but many of these new jobs were in low-productivity sectors of the Spanish economy such as construction and domestic services, while other economic sectors remained lethargic. In the first quarter of 2013 the un-ER was 27.16%. Annual accumulative growth in GDP for the period 1994–2007 was 3.70%, while between 2008 and 2012 it became negative, falling by an annual average of −0.83%. The growth of GDP in 2012 was −1.4%.
The Spanish economic miracle cannot be explained by good political-economic management or by increased productivity, which is the measure normally used to analyse a production system's efficiency. Over the period 1995–2009, according to the EU KLEMS database the average annual growth in productivity was 0.84%, which was lower than the 1.15% in the EU-15 and the 1.39% in the EU-25, and much lower than Japan's 1.80% and the USA's 1.93%. A likelier explanation for the ‘miracle’ is the growth in population – which increased from 39.3 million in 1994 to 45.2 million in 2008, with the immigrant population rising from 1% of the total in 1994 to 11% in 2008 – along with unsustainable private foreign debt and the well-known Spanish ‘real estate bubble’Footnote 3.
The inflow of massive external financial resources that fuelled consumption and the induced domestic demand boom pushed up wages and prices. House prices almost tripled between 1997 and early 2008, and the number of new homes built increased from just over 200,000 in 1994 to almost 900,000 in 2007, more than Germany, France, Italy and the UK combined. The forecast is that no more than 100,000 homes will be built in 2012. To make matters worse, the government deficit was 9.4% of GDP in 2011 and 10.6% in 2012 if we include support given to the banking sector. Official sources estimate that the deficit will fall to 4.5% of GDP in 2013, although influential economic analysts predict that it will be much higher.
As far as the public pension system is concerned, there was a sense of euphoria, which reached a peak in 2007 due to the sustained growth resulting from massive job creation leading to record numbers of contributors, which rose from 11.9 million in 2004 to 19.4 million in 2007. In the early 1990s, the ‘pension problem’ had triggered widespread discussion in Spain, but this now became a far less urgent issue for politicians and was therefore left off the agenda for public debate.
Despite official optimism about the system's financial health, the real situation was unknown to the less informed population due to the fact that no official actuarial reports on the system's solvency were compiled on a regular basis. Boado-Penas et al. (Reference Boado-Penas, Valdés-Prieto and Vidal-Meliá2008) were the first to use the Swedish methodology to estimate the actuarial balance (AB) for the Spanish contributory pension system based on official data for the old-age contingency. A comparison of the consecutive balance sheets for 2001–2006 showed that the degree of insolvency was growing over time, even though the cash-flow outcome had improved over the same period. The absence of a balance sheet in this specific case produced a ‘mirage effect’, i.e., the presence of a hidden capital deficit reduced the importance of future cash deficits and there was an urgent need to take steps to restore the system's structural actuarial balanceFootnote 4.
The process for discussing the reform of the Spanish public pension system could be said to have started on 22 April 2008, with the creation of another watchdog committee to review the Toledo Pact agreements, signed by all political parties in 1995 with the aim of putting the social protection system beyond party politics, analysing the social security system's structural problems and establishing plans for action and reform. The committee issued a new report on the Assessment and Reform of the Toledo Pact (MTIN, 2011), which was passed by the Spanish Parliament on 25 January 2011. Finally, at the end of a lengthy process of legislative changes, on 1 August 2011 the Official State Gazette (Boletín Oficial del Estado, BOE) published Act 27/2011 concerning the updating, adaptation and modernization of the social security system, officially based on the Toledo Pact report.
The most important aspects of the reform involve retirement age, calculating the regulating base, the coefficients per year worked and incentives for remaining in the labour market. However, it preserves the structure of the pre-reform formula for calculating the initial retirement pension and reproduces most of its main flaws.
The aim of this paper is to assess the 2011 reform of the Spanish public pension system from the perspective of some of the principles that govern the Swedish system – actuarial fairness, actuarial transparency, solvency and communication with the public – although some reference to the US pension system is also made. The Swedish public pension system has become a benchmark due to its ability to integrate actuarial analysis methodology into the field of public management so as to minimize the political risk to which pay-as-you-go (PAYG) pension systems are exposed and to correct almost automatically any imbalances that come about due to fluctuations caused by demography, the economy and/or the financial markets.
A quantitative analysis of the 2011 Spanish pension reform has already been performed using different methodologies – the papers by Boado-Penas and Lanot (Reference Boado-Penas and Lanot2012), Conde-Ruiz and González (Reference Conde-Ruiz and González2012), De la Fuente and Doménech (Reference De la Fuente and Doménech2013), Díaz-Giménez and Díaz-Saavedra (Reference Díaz-Giménez and Díaz-Saavedra2011), Dominguez-Fabián et al. (Reference Domínguez-Fabián, Devesa-Carpio and Rosado-Cebrián2012) and Meneu-Gaya and Encinas-Goenechea (Reference Meneu-Gaya and Encinas-Goenechea2012) are valuable examples – but there is a large gap in the literature, which we are attempting fill because the Spanish reform has not been assessed from a qualitative approach. This innovative approach, using the Swedish system as a benchmark, complements the quantitative valuations of the reformed pension system and will enable us to accurately answer questions like:
✓ What was the system's solvency or sustainability level, as measured in accordance with public Social Security Administration (SSA) practices in countries such as Sweden and the USA, in the year in which the Spanish reform was conceived?
✓ Was the reform justified from an actuarial point of view?
✓ Has the system become more transparent since the reform?
✓ Is the new formula for calculating retirement pension fair and simple, and does it include mechanisms for reflecting economic and demographic changes?
✓ Are there instruments to push the system towards solvency in the short term?
✓ Does the new legislation try to involve contributors and pensioners in the functioning of the system?
The paper is structured as follows. After this introduction, Section 2 briefly describes the pension system in Spain and comments on certain significant data. Section 3 focuses on the 2011 reform, explaining its aims, breaking down the main contents and examining the official view. Section 4 describes the expected ageing of the Spanish population. Section 5 analyses the reform from the perspective of the principles of the public pension system in Sweden, and the paper ends with the conclusions, bibliographical references and a technical appendix.
2 A brief description of the Spanish public pension system and some significant data
In this section, there is a brief description of the Spanish pension system. However, it is important to bear in mind that this paper mainly analyses the second pillar – specifically the pension reforms affecting it – although a brief overview of the whole system is considered appropriate here.
The Spanish pension system can be separated into three different pillars:
First pillar – Non-contributory public protection, the purpose of which is to provide financial cover for disability, old age, unemployment and family responsibilities. The amount payable is the same for everyone and conditional upon the beneficiary's lack of resources. This type of protection is financed and managed by the state through taxation.
Second pillar – Contributory public social insurance programmes, organized along occupational lines. These programmes award benefits to compensate for income no longer earned due to sickness, accident, unemployment, family responsibilities, disability, old age or death. The amount payable depends to some extent on how much has been contributed and for how long. This type of protection is financed by contributions from employees and/or employers and is run by the state. In short, this is a DB PAYG pillar.
Third pillar – Employer retirement plans. Alongside the previous two types of state-run protection there is also a complementary system of privately run protection which is fully funded, mainly defined contribution, and enjoys advantageous tax treatmentFootnote 5. This pillar is currently composed of three parts – corporate pension schemes (CPS – Plan de Pensiones de Empresa/PPE), collective insurance plans (CIP – Seguro Colectivo sobre la Vida/SCV) and mixed corporate plans (MCP – Plan de Previsión Social Empresarial/PPSE) – which together cover about 20% of the Spanish workforce. These plans are generally offered by large companies, where workers are more likely to earn above the Social Security maximum than they are in smaller companies. CPSs, the legal structure of which was first introduced in 1988, include both traditional defined benefit and defined contribution plans, although the latter now predominate. Together they cover less than 10% of the workforce. The plans are generally financed entirely by the employer (86.2% of contributions made in 2011) and most are negotiated and managed through collective bargaining agreements. Total assets in CPSs in 2011 amounted to around 3% of GDP.
CIPs are partly a legacy of book reserve employer plans, although after a transitional period all these plans are legally required to be fully funded. They do not receive favourable tax treatment, although they are exempt from vesting, commissions of control and other requirements imposed on CPSs. Most CIPs are for death and disability benefits, but a significant number also provide retirement benefits, sometimes for highly paid workers who need coverage in excess of the tax maximums of pension plans. Assets in CIPs in 2011 represented around 2.8% of GDP.
2007 saw the introduction of a new type of employer retirement plan – the MCP – which combines aspects of both CPSs and CIPs. It offers the same tax advantages as CPSs as well as some of their benefit requirements, but does not require commissions of control. This type of plan has to give a guaranteed rate of return and allow asset transfers to other individual and employer pension plans. Assets in this new type of plan in 2011 were around 0.01% of GDP.
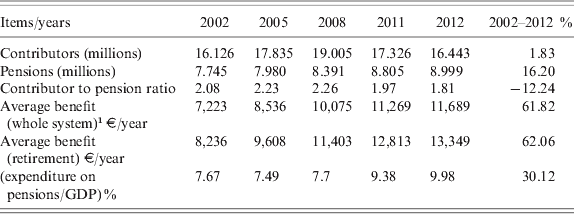
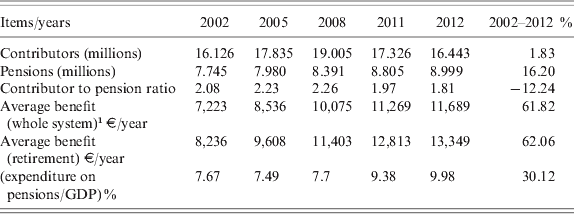
Table 1 shows some recent data for the public pension system. Over the period 2002–2012, the number of contributors has risen by 1.83%, despite the fact that there has been a sharp fall over the last 4 years due to the economic crisis. The number of pensions has increased by 16.20%, resulting in a 12.24% narrowing of the contributor–pension ratio, which in December 2012 reached its lowest level in recent times with just 1.81 contributors maintaining one pension. The contributor–pensioner ratio is slightly higher (2.01) than the contributor–pension ratio (1.81) because, on average, a pensioner receives more than one benefit: 1.10 pensions per pensioner in December 2012.
Some significant data for the Spanish public pension system (2002–2012)
1 The average benefit includes the main benefits of the second pillar: retirement, permanent disability, survivourship and family responsibilities.
Source: Own based on
The average pensions paid by the system have increased considerably in nominal and real terms over these last 10 years, the main cause being the generous increases in minimum pensionsFootnote 6 and the strong replacement effect, i.e., pensions leaving the system are notably smaller than newly awarded onesFootnote 7.
The direct consequence of this –fewer contributors and more pensioners with bigger pensions – is that spending on pensions as a percentage of GDP has risen by 30.12% in real terms over the last 10 years. The system (including unemployment costs) had a treasury shortfall of 998 million euro (€) (0.09% of GDP) in 2011, although this would already have come about in 2010 if the interest generated by the reserve fund, which amounted to 6.11% of GDP in 2010, had not been taken into account. The treasury shortfall for 2012 was around 0.96% of GDP – 10,131 million € – and for first time the reserve fund accumulated over recent years has been used to pay scheduled pensions in 2012.
The average retirement age in 2011 was around 63 as opposed to the ordinary retirement age of 65. The minimum retirement pension set for 2012 ranged from 7,658 to 10,690 €/year depending on age and dependents, while the maximum annual pension was 34,971 €. The ratio between average retirement pension and average salary was around 58% in 2011, but it is expected to rise due to a generalized drop in wages in 2012. There are also 450,000 non-contributory pensions and 604,000 public service pensions, amounting to 1.35% of forecast GDP for 2012, which are paid directly out of the public purse. It can therefore be said that spending on the public pension system – contributory, non-contributory and public service – amounted to approximately 11.30% of expected GDP in 2012.
3 The 2011 reform
According to official Spanish government information in 2011, GE (2011), inspiration for the system's reform stemmed from recommendations included in the Toledo Pact. Parametric reforms of the pension system have been carried out within the framework of the pact aimed at simultaneously achieving two clearly contradictory objectives – to improve the system's financial sustainability and increase coverage and benefits – and therefore the reform has not eliminated the deep-rooted practice of populism in pensions, i.e., the political use of the public system as an electoral weapon. Barea's (Reference Barea2007) paper expressly points to one of the most serious problems in the Spanish system as being ‘the (confirmed) temptation of politicians to use the system as an instrument for winning votes’Footnote 8.
It is understandable that there would be a permanent contradiction at the heart of the pact since the underlying idea, in complete opposition to expert opinion, was that the pension system's lack of financial viability was not as serious as certain organizations, (interested) sectors and experts would have people believe, and thus the necessary reforms were not so urgent and need not be so far-reaching. Reports submitted to the Toledo Pact committee by experts and prestigious institutions were frequently discredited and sparked controversy regarding their basic assumptions, the quality of the data, the methodology and the accuracy of their projections and resultsFootnote 9.
The fact of the matter is that the reform of the Spanish pension system was rushed through because of the country's economic and financial difficulties, which reached a climax in May 2010 with the freezing of pensions in payment, the cutting of civil service salaries and the announcement of a reform of the public pension system. This came as no surprise since the most important previous reform took place in 1985, a critical moment for workers to become affiliated to the social security system due to the rapid descent of the contributor–pension ratio, which was then 1.99. The 2011 reform came about in very similar or even worse circumstances, with a cash shortfall in the system, a steep drop in contributors, a contributor–pension ratio of less than 2 in 2011, a widening of the government deficit and tighter credit conditions associated with the financial crisis.
The reform of the Spanish pension system came into force from 1 January 2013 and will be applied gradually over a transitional period of 15 years, ending in 2027. From that year onwards the system's parameters will be reviewed every 5 years to take into account any differences between life expectancy at age 67 in the year the review is carried out and life expectancy at age 67 in 2027, but as we will see later the government is considering the possibility of introducing a redesigned sustainability factor and bringing forward its application to January 1 2019.
According to document Gobierno de España (Reference Gobierno de España2011) and Act 27/2011, the aim of the reform is to meet the enormous challenge posed by population ageing and to partially correct the imbalance between what people contribute and what they receive.
3.1 Main contentFootnote 10
Until 31 December 2012 the resulting initial monthly pension (Pr ,ret), payable 14 times per year, was the product of two main factors – the total stipulated replacement rate (Tsrr) and the calculated regulating base (Rbase) – as shown in Formula (1):
 $$\mathop P\nolimits_{r\comma ret} \equals \overbrace {r\lpar r\comma c\rpar \ \cdot r\lpar c\rpar }^{\ \lpar Tsrr\rpar } \cdot \overbrace {{{\sum\limits_{i \equals \setnum{1}}^{\setnum{24}} {\mathop {MCB}\nolimits_{i} \plus \sum\limits_{i \equals \setnum{25}}^{\setnum{180}} {\mathop {MCB}\nolimits_{i} \cdot {{\mathop {RPI}\nolimits_{\setnum{25}} } \over {\mathop {RPI}\nolimits_{i} }}} } } \over {210}}}^{\ \lpar Rbase\rpar }$$
The regulating base was calculated using the last 15 years of contributions before retirement. MCBi was the monthly contribution base (MCB) in month 1, and i=1 was the month before retirement. Monthly contribution bases were equal to monthly wages but limited by a maximum (3,262 € per month in 2012) and a minimum (850.20 € per month in 2012), i.e., if the wage was below the minimum MCB it was considered to be the minimum, and if the wage was above the maximum MCB it was considered to be the maximum. These two limits were decided annually by the Spanish government. Amounts were indexed, only before month 24, using the Spanish Retail Price Index (RPI). Gaps in contributions were payable monthly, with the minimum amount payable being the minimum contribution base for that period.
The Tsrr was the product of two rates:
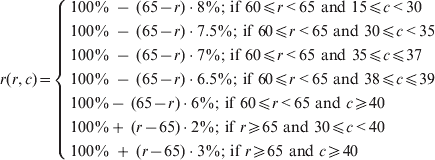
1 r(r,c): Replacement rate according to retirement age and years contributed, which, ignoring various special circumstances and in a very simplified way, could be represented as:
(2) $$r\lpar r\comma c\rpar \equals \left\{ {\openup3\matrix{ {100\percnt \ \minus \ \lpar 65 \minus r\rpar \cdot 8\percnt \semi \ {\rm if}\ 60\leqslant r \lt 65\ {\rm and}\ 15\leqslant c \lt 30} \hfill \cr {100\percnt \ \minus \ \lpar 65 \minus r\rpar \cdot 7.5\percnt \semi \ {\rm if}\ 60\leqslant r \lt 65\ {\rm and}\ 30\leqslant c \lt 35} \hfill \cr {100\percnt \ \minus \ \lpar 65 \minus r\rpar \cdot 7\percnt \semi \ {\rm if}\ 60\leqslant r \lt 65\ {\rm and}\ 35\leqslant c\leqslant 37} \hfill \cr {100\percnt \ \minus \ \lpar 65 \minus r\rpar \cdot 6.5\percnt \semi \ {\rm if}\ 60\leqslant r \lt 65\ {\rm and}\ 38\leqslant c\leqslant 39} \hfill \cr {100\percnt \minus \ \lpar 65 \minus r\rpar \cdot 6\percnt \semi \ {\rm if}\ 60\leqslant r \lt 65\ {\rm and}\ c\geqslant 40} \hfill \cr {100\percnt \plus \ \lpar r \minus 65\rpar \cdot 2\percnt \semi \ {\rm if}\ r\geqslant 65\ {\rm and}\ 30\leqslant c \lt 40} \hfill \cr {100\percnt \ \plus \ \lpar r \minus 65\rpar \cdot 3\percnt \semi \ {\rm if}\ r\geqslant 65\ {\rm and}\ c\geqslant 40} \hfill \cr} } \right.$$
As Formula (2) shows, in cases of early retirement before 65 the initial pension was subject to reduction. This was done by applying an annual penalty coefficient of between 6% and 8% per year depending on the number of years contributed by the worker. Only affiliates who had contributed before 1967 had the right to retire at 60. In addition, there were incentives to voluntarily postpone retirement until after 65, with an annual extra benefit of 2% or 3% per year being awarded depending on the number of years contributed. In this case, the resulting pension could not be higher than the maximum pension.
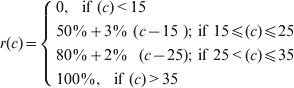
2 r(c): Replacement rate according to the number of years contributed.
(3)$$r\lpar c\rpar \equals \left\{ {\openup3\matrix{ {0\comma \ {\rm \ if}\ \lpar c\rpar \lt 15} \hfill \cr {50\percnt \plus 3\percnt \ \lpar c \minus 15\ \rpar \semi \ {\rm if}\ 15\leqslant \lpar c\rpar \leqslant 25\ } \hfill \cr {80\percnt \plus 2\percnt \ \ \lpar c \minus 25\rpar \semi \ {\rm if}\ 25 \lt \lpar c\rpar \leqslant 35} \hfill \cr {100\percnt \comma \ \ {\rm if}\ \lpar c\rpar \gt 35}\hfill} \right} \cr}$$In order to get retirement pension it was necessary to contribute for at least 15 years, including at least 2 years of contributions in the last 15 years. Formula (3) clearly shows that r(c) was biased in favour of shorter careers, i.e., it was unfair to those who had longer careers.
The Tsrr determines a structure of pension increments (decrements) for late retirement (early retirement) that fall short of actuarial neutralityFootnote 11. Most of all they penalize affiliates with long careers of contributions who take late retirement, but also under certain circumstances affiliates who take early retirementFootnote 12.
The 2011 reform has partially corrected this problem.
Pensions in payment were adjusted annually in January according to forecast changes in the RPI, and they should now be reviewed every year in line with the real RPI data for November.
It is worth highlighting that for r=65 and c=35, Pr ,ret=Rbase
The 2011 reform preserves the structure of the pre-reform formula used for calculating the initial retirement pension, but many parametric changes affect Rbase, r(c), and r(r, c).
The legal retirement age will generally be between 63 and 67 and the concept of a complete work history is introduced, set at 38.5 years. In fact there will be two normal retirement ages: 65 with 38.5 years’ contributions and 67 with 37 years’ contributions. The changeover from 65 to 67 years will take place gradually between 2013 and 2027.
To obtain a 100% pension it will be necessary to contribute for 37 years and retire at 67 or contribute for 38.5 years and retire at 65 (until 31 December 2012, age 65 with 35 years’ contributions). Calculations will be made on the basis of monthly contributions rather than rounding up to the next full year as was the case prior to the reform. It is worth bearing in mind that in other OECD countries where there are conditions related to the number of years of contributions needed in order to retire with full benefits before the normal pension age, the rules are generally stricter. According to the OECD (2011), France is increasing the number of years to 42, whereas in Italy and Luxembourg, for example, it is 40. When pension age reaches 67 in Germany, full benefits from age 65 will only be available to those with 45 years’ contributions. Consequently, it would not be unreasonable to say that the Spanish reform falls short in this respect.
For mothers who interrupt their contributing careers to have children, the accredited contribution period will be increased to account for this interruption. Under certain circumstances, it will be increased by the duration of the interruption period, up to a maximum of 9 months per child and 24 months per family.
There are changes to the scale applied (see Formulas (3) and (6)), which rises smoothly and proportionally from a 50% minimum with 15 years’ contributions.
Early retirement will continue to be possible for people with particularly ‘hazardous and arduous jobs’Footnote 13. Act 27/2011 has not modified the main rules of early retirement based on occupational groups or activities involving exceptionally arduous, dangerous, toxic or unhealthy jobs and high mortality or morbidity ratesFootnote 14. Generally speaking, an early retirement pension at an age below 52 is not possible. The reform has missed an opportunity to seriously consider whether some of these schemes should continue, and this, as Zaidi and Whitehouse (Reference Zaidi and Whitehouse2009) point out, is due to more institutional resistance to change than their usefulness as a supplementary public pension scheme.
There are two other ways to access early retirement (Royal Decree 5/2013) subject to a minimum of 33 or 35 years’ contributions (30 years prior to the reform): when a worker loses their job through no fault of their own (age 61 or 63 and over, depending on the number of years contributed) and when a worker voluntarily gives up their job (age 63 or 65 and over, depending on the number of years contributed).
In cases of early retirement, the pension will be subject to reduction. This is done by applying an annual penalty coefficient of between 6% and 8% for each year of retirement before age 67 or 65, depending on whether a worker loses their job through no fault of their own or voluntarily gives up their job and on the number of years contributed by the worker (see Formula (5)). The resulting benefit cannot be lower than the minimum pension appropriate to the beneficiary's family circumstances.
The period for calculating the regulating base will be extended from 15 to 25 years over a transitional period of 10 years. The period will be progressively increased by 1 year from 2013 to 2022. The way of dealing with gaps in contributions also changes. There will be a maximum of 48 monthly contributions payable at least at the minimum contribution base at the time of payment, while most of any remaining contributions will be payable at 50% of the minimum contribution base.
There are better incentives to voluntarily prolong working life: 2% per year for up to 25 years contributed, 2.75% for between 25 and 37 years contributed, and 4% for over 37 years contributed. However, no pension can exceed maximum taxable earnings at any particular time (41,108.40 €/year in 2013). A partial exemption from contributing for common contingenciesFootnote 15 is also established – except for temporary incapacity deriving from those contingencies – once age 65 is reached with 38.5 years’ contributions or age 67 with 37 years’ contributions.
Royal Decree 5/2013 also establishes that, for workers who reach age 65 with 38.5 years' contributions or age 67 with 37 years’ contributions, it is possible to continue in full-time or part-time employment and receive 50% of the retirement pension they would have received if they had retired, with exemption from contributing for common contingencies.
The new legislation in Spain has also introduced a sustainability factor based on differences between life expectancy at age 67 in the year of adjustment and life expectancy at age 67 in 2027. The first adjustment will be in 2032. This sustainability factor will be analysed in Section 5.3.
Finally, the way pensions in payment are indexed has not been modified; although at the time of this writing (November 2013) the Spanish government is considering removing the annual inflation-linked pension increase. The new indexation rule would take into account the ratio between the contributory pension system's spending and revenues for a period of 11 years, the pension replacement effect – i.e., the ratio between the amount of a pension leaving the system and a newly awarded one – and the retail price indexFootnote 16.
From 1 January 2027 onwards, once the transitional period is over, the formula for determining the initial monthly amount of retirement pension
 $\lpar \mathop {\bar{P}}\nolimits_{r\comma \ ret} \rpar $, omitting various special circumstances and exceptions, will have the same structure as that prior to the reform, as shown in Formula (4):
 $$\mathop {\bar{P}}\nolimits_{r\comma ret} \equals \overbrace {\bar{r}\lpar r\comma c\rpar \ \cdot \bar{r}\lpar c\rpar }^{\ \lpar T\bar{s}rr\rpar } \cdot \overbrace {{{\sum\limits_{i \equals \setnum{1}}^{\setnum{24}} {\mathop {MCB}\nolimits_{i} \plus \sum\limits_{i \equals \setnum{25}}^{\setnum{300}} {\mathop {MCB}\nolimits_{i} \cdot {{\mathop {RPI}\nolimits_{\setnum{25}} } \over {\mathop {RPI}\nolimits_{i} }}} } } \over {350}}}^{{\rm \ }\lpar \bar{R}base\rpar }$$
 $${\bar{r}}\lpar r\comma c\rpar \equals \left\{ {\matrix{ {\overbrace {\left( {\matrix{ {100\percnt \ \minus \ \lpar 67 \minus r\rpar \cdot 7.5\percnt \semi \ {\rm if}\ 63\leqslant r \lt 67\ {\rm and}\ 33\leqslant c\leqslant 38.5} \hfill \cr {100\percnt \ \minus \ \lpar 65 \minus r\rpar \cdot 7\percnt \semi \ {\rm if}\ \ 61\leqslant r \lt 65\ \ {\rm and}\ 38.5 \lt c\leqslant 41.5} \hfill \cr {100\percnt \ \minus \ \lpar 65 \minus r\rpar \cdot 6.5\percnt \semi \ {\rm if}\ \ 61\leqslant r \lt 65\ \ {\rm and}\ 41.5 \lt c\leqslant 44.5} \hfill \cr {100\percnt \ \minus \ \lpar 65 \minus r\rpar \cdot 6\percnt \semi \tab {\rm if}\ \ 61\leqslant r \lt 65\ \ {\rm and}\ \ c\geqslant 44.5} \hfill \cr} } \right)}^{{\rm If}\;{\rm the}\;{\rm worker}\;{\rm loses}\;{\rm their}\;{\rm job}\;{\rm through}\;{\rm no}\;{\rm fault}\;{\rm of}\;{\rm their}\;{\rm own}}} \hfill \cr {} \hfill \cr {\overbrace {\left( {\matrix{ {100\percnt \ \minus \ \lpar 67 \minus r\rpar \cdot 8\percnt \semi \ {\rm if}\ 65\leqslant r \lt 67\ {\rm and}\ 35\leqslant c\leqslant 38.5} \hfill \cr {100\percnt \ \minus \ \lpar 65 \minus r\rpar \cdot 7.5\percnt \semi \ {\rm if}\ \ 63\leqslant r \lt 65\ \ {\rm and}\ 38.5 \lt c\leqslant 41.5} \hfill \cr {100\percnt \ \minus \ \lpar 65 \minus r\rpar \cdot 7\percnt \semi \tab {\rm if}\ \ 63\leqslant r \lt 65\ \ {\rm and}\ 41.5 \lt c\leqslant 44.5} \hfill \cr {100\percnt \ \minus \ \lpar 65 \minus r\rpar \cdot 6.5\percnt \semi \ {\rm if}\ \ 63\leqslant r \lt 65\ \ {\rm and}\ \ c\geqslant 44.5} \hfill \cr} } \right)}^{{\rm If}\,{\rm the}\,{\rm worker}\;{\rm voluntarily}\;{\rm gives}\;{\rm up}\;{\rm their}\;{\rm job}}} \hfill \cr {} \hfill \cr {\overbrace {\left( {\matrix{ {100\percnt \ \plus \ \lpar r \minus 67\rpar \cdot 2\percnt \semi \ {\rm if}\ r\geqslant 67\ {\rm and}\ 15\leqslant c \lt 25} \hfill \cr {100\percnt \ \plus \ \lpar r \minus 67\rpar \cdot 2.75\percnt \semi {\rm \ if}\ r\geqslant 67\ {\rm and}\ 25\leqslant c \lt 37} \hfill \cr {100\percnt \plus \ \lpar r \minus 67\rpar \cdot 4\percnt \semi \ {\rm if}\ r\geqslant 67\ {\rm and}\ c\geqslant 37} \hfill \cr {100\percnt \ \plus \ \lpar r \minus 65\rpar \cdot 4\percnt \semi \ {\rm if}\ r\geqslant 65\ {\rm and}\ c\geqslant 38.5} \hfill \cr} } \right)}^{{\rm If}\;{\rm the}\;{\rm worker}\;{\rm voluntarily}\;{\rm prolong}\;{\rm working}\;{\rm life}}} \hfill \cr} } \right.$$
 $$\bar{r}\lpar c\rpar \equals \left\{ {\openup3\matrix{ {0\comma\ {\rm if}\ \lpar c\rpar \lt 15}\hfill \cr {50\percnt \plus \lpar 50\sol 22\rpar \percnt \cdot \lpar c \minus 15\ \rpar \semi\hfill \ {\rm if}\ 15\leqslant \lpar c\rpar \leqslant 37\ } \hfill \cr {100\percnt \comma\hfill \ {\rm if}\ \lpar c\rpar \gt 37} \hfill \cr} } \right.$$
It should be remembered that for r=65 and c=38.5, or for r=67 and c=37,  $\mathop {\bar{P}}\nolimits_{r\comma \ ret} \equals \mathop {\bar{R}}\nolimits_{base} $.
To sum up, the 2011 pension reform retains the traditional defined-benefit formula for calculating retirement pension, but has a lot of exceptions in the transitional period. It is complex and badly designed because it does not take into account each monetary unit contributed to the system by individuals, and the different parameters and coefficients are arbitrarily calculated with very little justification from an actuarial point of view. Neither does it introduce an indicator of the system's financial health into the indexing of contributions and pensions in payment, although, as mentioned above, the government is considering introducing some type of automatic mechanism to index pensions in payment.
3.2 The official view
To end this section we examine the official view of the reform according to the presentation (GE 2011) given after the cabinet meeting held on 25 March 2011. This official view was full of self-congratulatory statements with no reasoned justification to back them up, as we will see in the following extracts:
(1) ‘The reform guarantees the sustainability and adequacy of the public pension system in the medium and long term; it will slow down the rapid growth in spending that would destabilize the social security system in the future; and it will mean savings of 1.4% of GDP in 2030, 2.8% in 2040 and 3.5% in 2050. Spending on pensions will increase but not as much, and this will be in line with other EU countries’
This assessment of the reform's impact is not based on the results of any official actuarial balance. There are no details about what methodology and hypotheses have been used to make the assessment or how the so-called sustainability factor has been applied, the legislation for which is anyway far from clear and does not specify how it would be applied in real life. In addition to this, there are no references as to how high spending on pensions will be as a proportion of GDP or what contribution rate will be needed to finance the scheduled benefits with or without reforms.
Domínguez-Fabián et al. (Reference Domínguez-Fabián, Devesa-Carpio and Rosado-Cebrián2012), Meneu-Gaya and Encinas-Goenechea (Reference Meneu-Gaya and Encinas-Goenechea2012) and Boado-Penas and Lanot (Reference Boado-Penas and Lanot2012), using actuarial tools mainly based on an analysis of the expected internal rate of return (eIRR) of the reformed system, reach similar outcomes – the reform reduces the eIRR for most present and future contributors, but the system's eIRR exceeds the estimated growth of the system's tax base.
Meanwhile Conde-Ruiz and González (Reference Conde-Ruiz and González2012), De la Fuente and Doménech (Reference De la Fuente and Doménech2013) and Díaz-Giménez and Díaz-Saavedra (Reference Díaz-Giménez and Díaz-Saavedra2011) have made ‘first assessments’ or ‘quick estimates’ of the reform's impact, especially the effect of pension spending on projected GDP. The conclusions these papers come to are similar: the reform will delay growth in pension spending as a proportion of GDP by around 10 years in relation to projected spending for 2050, but it will only ‘save’ just over a third of the projected increase in spending and therefore the other two-thirds of the increase in spending will need to be financed by other means. In other words, there is no sound basis for claiming that the system's sustainability is assured in the medium term, the long term or even the short term.
Just 2 years after the publication of the 2011 Act, the current government has recognized the need to introduce more reforms (Royal Decree 5/2013) because the sustainability of the public pension system is not guaranteed.
(2) The reform ‘will, over the coming decades, enable social security to pay more and bigger pensions for longer’
This official conclusion is wrong because in order to obtain the same benefits the affiliate has to contribute longer and retire later. If it were right it would contradict the explanatory preamble to Act 27/2011, which establishes that the reform ‘aims to partially correct the imbalance between what one contributes and what one receives’.
According to Sáenz de Jauregui (Reference Saénz de Jauregui2011), for a typical contributor the reduction in the amount of pension resulting from the reform could be up to 28%. Without taking the sustainability factor into account, Conde-Ruiz and González (Reference Conde-Ruiz and González2012) estimate a much smaller reduction in the average pension, around 9%, with this being greater for men than for women. Finally, according to the OECD (2011), the projected pension gross replacement rate – i.e., the pension relative to earnings when working, on the OECD's standard assumptions of 2.5% price inflation and 2% real earnings growth – for a full-career worker under the old legislation is 81.2%. The reform, without taking into account further adjustments to parameters after 2027, is expected to reduce the replacement rate to 73.9%. Even so, this ratio averages out much lower in the 34 OECD countries: 57.3%.
(3) The reform ‘also makes the pension system more sensitive to situations of vulnerability, strengthening its supportive role’
It is on this point that the conflict between aims like supportiveness and actuarial fairness appears with greater clarity. For example, the eleventh additional provision of Act 27/2011 talks about the ‘advisability of establishing possible scenarios for the complementary funding of our social security system in the medium and long term’ which would weaken the direct link between contributions and benefits and as a result, Lindbeck and Persson (Reference Lindbeck and Persson2003), would tend to reduce efficiency in the labour market. Meanwhile the thirteenth additional provision ‘establishes a gradual increase in the amount of widows’ pensions’ without any modification of the contribution rate allocated to the widows’ contingency. The reform establishes no clear mechanisms for all the non-contributory elements to be accounted for and fully funded through taxes.
(4) The reform ‘changes the conditions for entitlement to a retirement pension, making them more flexible and thereby strengthening the concept of retirement as a right’
A number of criticisms can be made on this point because the supposed flexibility comes at the cost of an excessively complex formula for calculating retirement pension that does not take into account the full contribution record, includes a great many exceptions, is not based on explicit actuarial elements, gives no real incentives for remaining longer in the labour market and contains no mechanisms for adapting it to any demographic changes that may affect the system.
As will be explained in Section 5, the formula should have been designed to take the entire working history into account when calculating the regulating base, to balance the weight of years contributed in the replacement rate and to make the actuarial factor determining the pension automatic.
4 The expected ageing of the population
Given that according to Act 27/2011 the main aim of the reform is to meet the enormous challenge posed by population ageing, information needs to be supplied about this aspect. To deal with the question of ageing we will look at data provided by the National Institute of Statistics (Instituto Nacional de Estadística, INE)Footnote 17 and the scenarios drawn up by Vidal-Meliá et al. (Reference Vidal-Meliá, García-García and Regúlez-Castillo2011) for the FIPROS 2010/27 project under the auspices of the Spanish Ministry of Work and Immigration.
The population of Spain will evolve as follows over the period 2009–2048:
✓ Population growth will progressively decrease over the next few decades.
✓ There will be negative population growth from 2,020 onwards.
✓ The population over 64 will double over the next 40 years and represent over 30% of the total.
✓ Life expectancy at birth is expected to increase by 6.25 and 5.50 years for men and women, respectively.
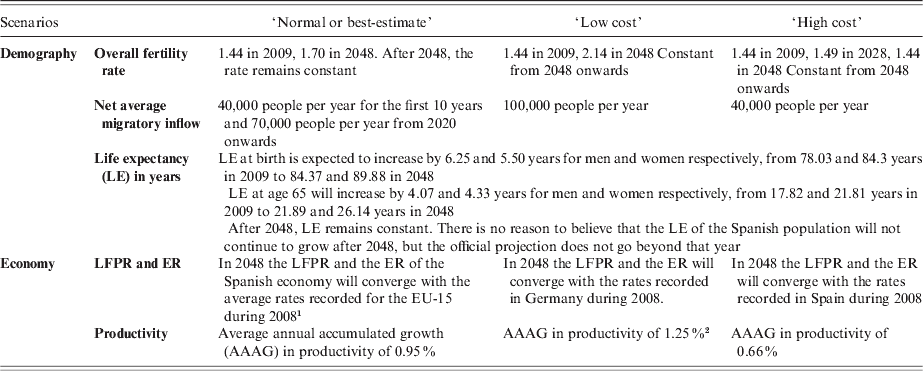
In order to take into account the uncertainty surrounding demographic evolution over the usual 75-year projection period needed for compiling an actuarial balance, Vidal-Meliá et al. (Reference Vidal-Meliá, García-García and Regúlez-Castillo2011) establish three sets of assumptions affecting the main elements that determine the evolution of the population and the economy: fertility, migration, mortality, the labour force participation rate (LFPR), the ER and productivity. Each assumption will determine a particular socio-demographic scenario.
Table 2 shows a summary of the main assumptions made for each scenario.
Socio-demographic scenarios. Summary of main assumptions
Source: Own based on Vidal-Meliá et al. (Reference Vidal-Meliá, García-García and Regúlez-Castillo2011).
1 The EU-15 comprises Austria, Belgium, Denmark, Finland, France, Germany, Greece, Ireland, Italy, Luxembourg, the Netherlands, Portugal, Spain, Sweden and the UK, as far as migration.
2 The productivity hypothesis for 2011–2050 under the low-cost scenario is the same as the productivity path assumed by the European Commission in the 2009 Ageing Report (2008).
As far as the scenarios considered for the demographic projection are concerned, the first is designated the ‘best estimate’ or normal scenario and is based on the hypotheses established by the INE (2009) up to 2048. The second and third scenarios are designated ‘favourable’ or ‘low cost’ and ‘unfavourable’ or ‘high cost’. After 2048 the various assumptions for each scenario will remain constant at the values reached on that date for the remaining part of the projection period. Beyond 2048 the population is projected for each scenario using the same methodology employed by the INE (2009) Footnote 18
As far as the main assumptions for the demographic projection are concerned, the INE forecasts a sustained increase in the overall fertility rate (OFR) from 1.44 in 2009 to 1.70 in 2048. Under the ‘low cost’ scenario it is assumed that there will be an even greater increase in the OFR than in the best estimate scenario, from 1.44 in 2009 to 2.14 in 2048, while in the ‘high cost’ scenario it undergoes a slight increase over the first two decades projected, from 1.44 in 2009 to 1.49 in 2028, but then falls back to the value assumed for 2009.
is concerned, the INE assumes a net average migratory inflow of 70,000 people a year. The first 10 years of the projection take into account the effect of the economic crisis on this variable, which in quantitative terms translates into a significant reduction in the average migratory inflow down to an average net migration inflow of around 40,000 people. The optimistic and pessimistic scenarios assume net average migratory inflows of 100,000 and 40,000 people respectively during the projection periodFootnote 19.
The evolution of mortality assumed by the INE implies that there will be a significant increase in life expectancy both at birth and at age 65. Life expectancy at birth is expected to increase by 6.25 and 5.50 years for men and women, respectively, from 78.03 and 84.3 years in 2009 to 84.37 and 89.88 in 2048. Life expectancy at age 65 will increase by 4.07 and 4.33 years for men and women, respectively, from 17.82 and 21.81 years in 2009 to 21.89 and 26.14 years in 2048. The increase in life expectancy at birth is mainly due to the increased life expectancy for the elderly. The three demographic scenarios assumed show the same evolution of mortality for the projection period. Given that in the last 50 years in Spain life expectancy at age 65 has steadily increased, the assumption that after 2048 it will remain constant may involve an underestimation of pension expenditure from 2048 onwards.
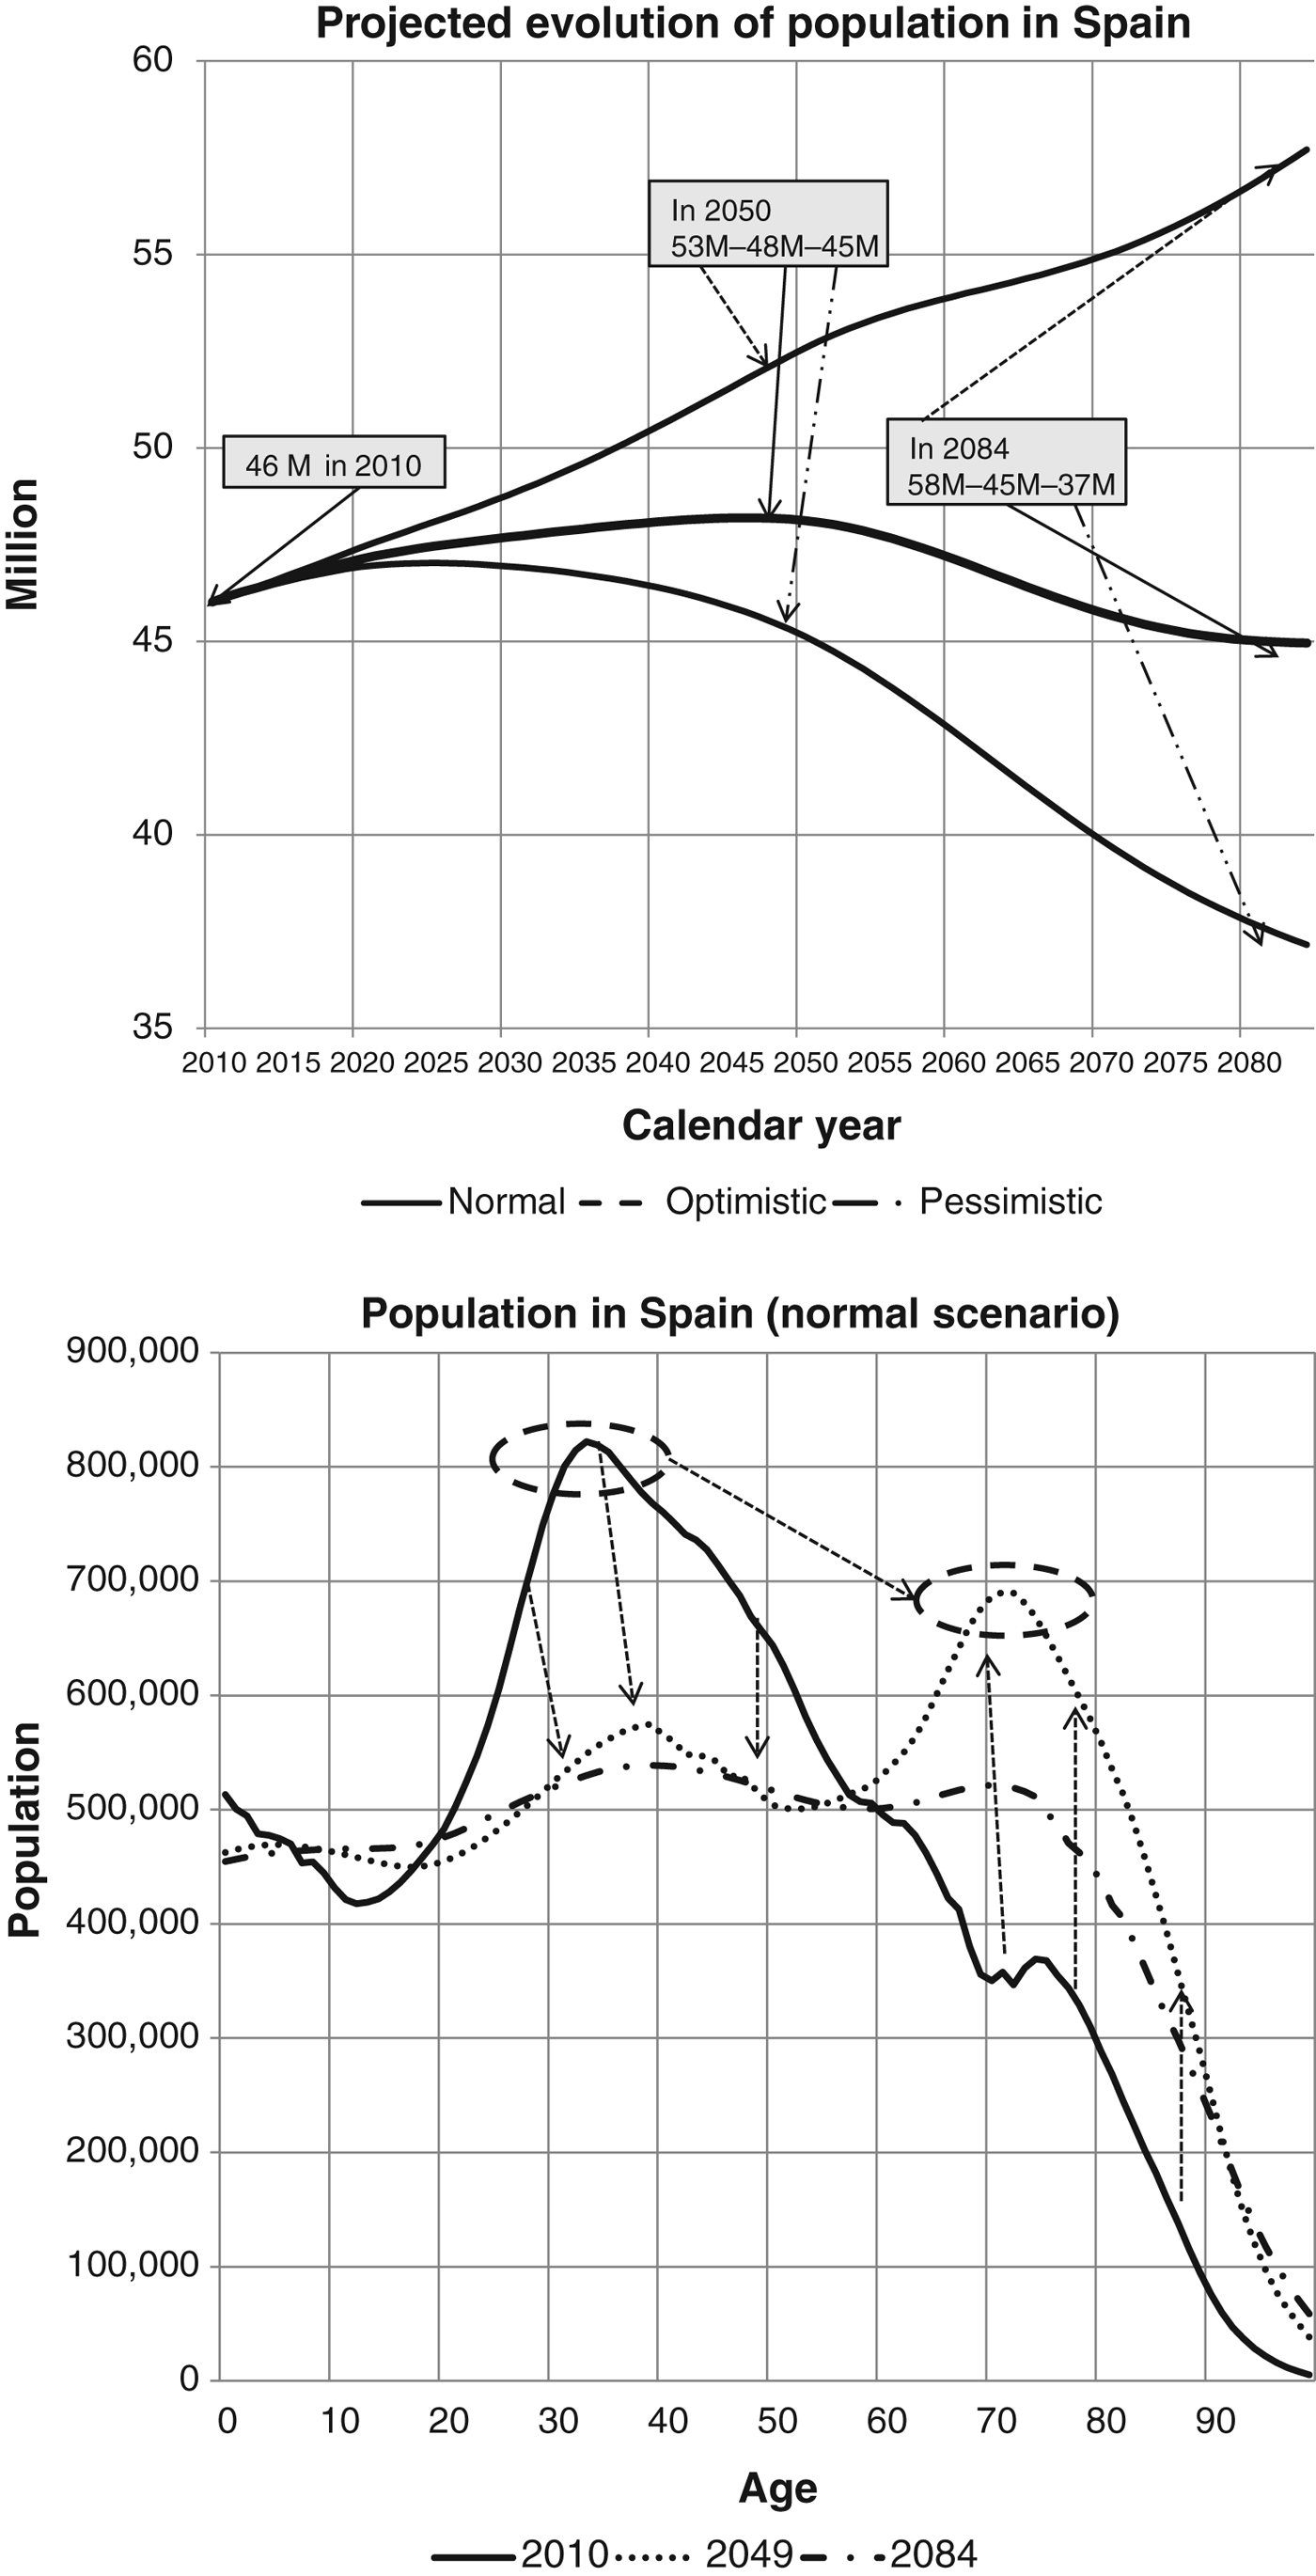
The demographic projection for Spain can be seen in Figure 1, which shows population evolution for the period 2010–2084 for the three different scenarios, broken down by age group for the normal scenario.
The changes manifest themselves gradually over the years, but by the last year of the projection the population could show very different results: under the normal scenario there will be around 45 million inhabitants, while under the optimistic and pessimistic scenarios there will be 58 and 37 million, respectively. The most important aspect, however, is the considerable ageing of the population seen in the second part of Figure 1, which shows that in 2049 there will be a big reduction in the working-age population and an increase in the retired or more elderly population. The trend may partially reverse by 2084.
Population evolution in Spain for the period 2010–2084 under three scenarios, broken down by age group for the best estimate scenario. Source: Own based on Vidal-Meliá et al. (Reference Vidal-Meliá, García-García and Regúlez-Castillo2011).
In Figure 2, which shows the projected population pyramids for Spain, the effect of ageing can be seen even more clearly. The demographic dependency ratio, i.e., the population aged between 16 and 64 divided by the population aged 65 and over (based on Figure 2)Footnote 20, will undergo a very sharp drop over the next four decades, from 4 in 2010 to 1.66 in 2049. At the end of the projection period there is a slight improvement over the situation in 2049, with a ratio value of around 2.
Population pyramids for Spain in 2010, 2049 and 2084. Normal scenario. Source: Own based on Vidal-Meliá et al. (Reference Vidal-Meliá, García-García and Regúlez-Castillo2011).
5 Assessment of the reform of the Spanish system from the perspective of the Swedish pension system
The Swedish public pension systemFootnote 21 has become a benchmark due to its ability to integrate actuarial analysis methodology into the field of public management. The instruments on which this methodology is based – notional accounts, actuarial balances, automatic balance (stabilizing or adjustment) mechanisms (ABMs) and personalized information statements – help to improve the system's actuarial fairness, transparency, solvency and communication with contributors and pensioners. For Diamond (Reference Diamond2009), the Swedish pension system is by and large well designed and suited to handling the effects of globalization, while according to Knox (Reference Knox2012), Sweden is the country with the highest sustainability index values of current retirement income systems. But the Swedish system does have its critics. Scherman (Reference Scherman2011), for example, claims that it has abandoned the inseparable and automatic connection between benefits and contributions because it does not fulfil basic ideas about the need for a proper balance between social goals and financial constraints.
In Spain, specifically within the Toledo Pact, the philosophy that inspired the reform of the public pension system in Sweden was proposed as a reference for reforming the Spanish pension systemFootnote 22, but, as will be shown below, the results of the Spanish reform deviate significantly away from the path followed in Sweden.
5.1 Actuarial transparency
In the Swedish system the principle of actuarial transparency, Pensionsmyndigheten (2011), is fundamentally linked to the AB sheet. The regular publication of an official AB is also standard practice in countries such as the USA, Japan, Canada, the UK and Finland. There are compelling reasons for this: the growing social demand for transparency in the management of public finances, the need to protect the DB PAYG system from populism in pensions, the desire to give the system more credibility in the eyes of contributors and pensioners, and the advisability of introducing ABMs, to name just a few.
In the case of Spain it is clear that there is much room for improvement as far as the system's transparency is concerned. The opportunity should have been taken to establish an obligation to compile an AB officially and periodically in order to show stakeholders the pension system's real financial situation, since there has always been a divergence between political discourse and expert opinion. The government authorities had systematically denied that the pension system had sustainability problems, and this situation was helped by the absence of an official actuarial balance.
The absence of an AB means there are a number of unknown quantities: the level of solvency in the year the reform was conceived, justification for the reform from an actuarial point of view, and the opportunity any reform presents. To enable these questions to be answered, we compile two AB models for the Spanish public retirement pension system at 1-1-2010 and 31-12-2010 and then compare them with those for Sweden and the USAFootnote 23. The underlying idea behind actuarial balances, in line with Barr and Diamond (Reference Barr and Diamond2010), is that any analysis that looks only at the future liabilities of PAYG pension systems while ignoring explicit or implicit assets is misleading.
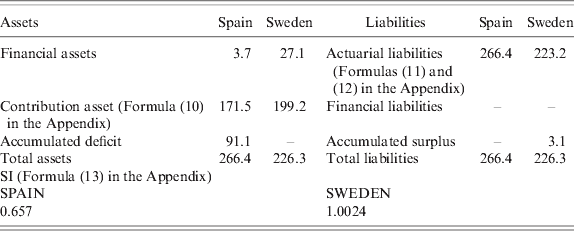
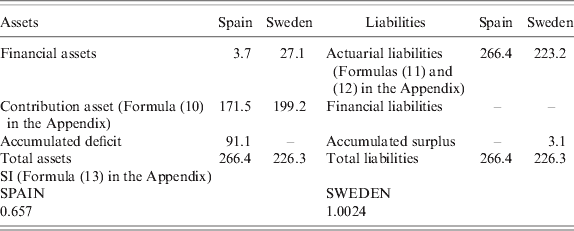
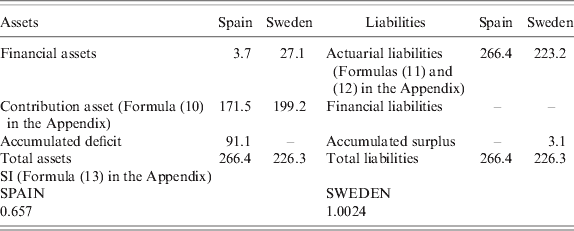
Table 3 takes the AB for all regimes of the Spanish retirement pension system as a percentage of GDP and compares it with that for the Swedish notional account system, which is financed by PAYG. In this type of AB sheet, the main accounting entries are developed using the principles of double-entry bookkeeping and can briefly be summed up as showing the actuarial (im)balance in pension systems in clear language in the shape of assets and liabilities, without needing to use explicit projections, although for the Spanish system, in order to calculate liabilities to contributors it is necessary to make explicit assumptions. The system's solvency is measured (see the Technical Appendix, Formula (13)) using the solvency indicator (SI). This is one case in which the saying ‘comparisons are hateful’ would apply.
Balance sheet as % of GDP for Spain (all regimes, retirement contingency, central scenario) and Sweden (NDC system) at 31-12-2010
Source: Own based on Vidal-Meliá et al. (Reference Vidal-Meliá, García-García and Regúlez-Castillo2011) and Settergren (Reference Settergren, Holzmann, Palmer and Robalino2012).
It can be seen that the Swedish system is solvent, but what draws the attention is the extraordinary level of accumulated deficit in relation to GDP in the case of Spain for the central scenario. As a result the SI reaches a value of 0.657, i.e., 34.3% of the commitments taken on are uncovered, or to put it another way, only 65.7% of the actuarial liabilities are backed up by assetsFootnote 24.
The perspectives for the Spanish system from the point of view of solvency are also very negative. Figure 3 shows the projected evolution of the SI for the central socio-demographic scenario and the total result (TR), both with the strictly actuarial part (AR) separated.
Projected solvency ratios and actuarial results for the Spanish pension system under the best estimate scenario. Source: Own based on Vidal-Meliá et al. (Reference Vidal-Meliá, García-García and Regúlez-Castillo2011).
The so-called central socio-demographic scenario combines the normal demographic scenario with the central economic scenario shown in Table 2. The best estimate economic scenario assumes that in 2048 the LFPR and the ER of the Spanish economy will converge with the average rates recorded for the EU-15 during 2008, and that annual accumulated growth in productivity will be 0.95% for the period 2009–2084, slightly higher than the growth in productivity recorded over the period 1995–2009, 0.84%.
The SI will worsen considerably, although the strictly actuarial solvency indicator (ASI, Formula (14) in the Appendix) improves after 2045 because, if the demographic forecasts for the normal scenario shown in Figure 1 are correct, the pension system will benefit from an increase in the contributor–pensioner ratio.
The system will obtain strictly actuarial profits (AR) for the period 2049–2069 and again from 2079, but the total result (TR) will always be negative due to the high volume of financial obligations the system will have to take on in order to continue paying the scheduled pensions. At the end of the projection period the SI reaches its minimum value (0.33), while a slight improvement can be seen in the strictly ASI (0.463) in comparison with the situation in 2045 (0.412)Footnote 25.
Table 4 compares the AB for all regimes of the Spanish retirement pension system as a percentage of GDP with that for the US model, which is financed by PAYG and also includes a disability contingency. This type of AB uses explicit projections to highlight future challenges to the financial side deriving basically from ageing, the expected increase in longevity and fluctuations in economic activity. In accordance with Formula (15) in the Technical Appendix, its sustainability is measured using the AB indicator.
Elements of the 75-year actuarial balance 2010–2084. Present value at January 2010. Best estimate assumption
Source: Own based on Vidal-Meliá et al. (Reference Vidal-Meliá, García-García and Regúlez-Castillo2011) and BOT (2010).
1 In thousands of millions of €. Consolidated for all regimes. Normal scenario.
2 In billions of dollars. OASDI.
Comparisons are hateful in this case too. Judging from the result for the AB, which is −1.92%, the US system is reasonably sustainable, although some reforms will be needed. In theory the payment of scheduled benefits are assured until 2037. The results for the Spanish system under the normal socio-economic scenario (Table 2) are unequivocal in that the system's financial health is far more delicate than it may appearFootnote 26. It can be seen that the first deficit already makes an appearance in 2010Footnote 27 and the reserve fund is exhausted in 2019. The result of the AB is −13.95%, i.e., the contribution rate would need to be increased by 13.95% immediately and over the entire projection horizon in order to cover all the scheduled pensions, or to put in another way, the system could regain financial solvency in 75 years if a 13.95% increase in the contribution rate were to be implemented immediately and applied to taxable earningsFootnote 28.
In terms of GDP – the last two rows in Table 4 – the results are even more striking. If the aim were to ‘assure’ payment of estimated benefits for the next 75 years, the initial financial contribution that would have to be added to the initial reserve fund would be 250.6% of GDP for the base year, or paid in instalments at the rate of 4.17% of GDP for each year. If the benchmark were the contribution base for the base year, 8.39 times that contribution base would need to be injected to ‘assure’ benefits.
These outcomes leave little room for doubt as far as justifying the recent reform of the pension system from an actuarial point of view is concerned. Indeed it could be said that, unlike what it states in the explanatory preamble to Act 27/2011, the main argument for justifying the 2011 reform is the pension system's actuarial imbalance over and above any demographic questions, although it is true that the projected evolution of the demographic variables according to Figures 1 and 2 will also present a serious threat to the system's health.
It is likely that if there had been some kind of official actuarial balance, the reform would indeed have been introduced earlier because, although the system's treasury situation enabled benefit payments to be made, the system's solvency, due to problems of actuarial imbalance caused by the lack of adjustment to the system's parameters and the projected effect of ageing, was already in a perilous state even though the impression it gave was the opposite. The way the system has been affected by the economic crisis, i.e., fewer contributors and more pensioners, makes the SI deteriorate even faster.
A question closely linked to the one above concerns what the impact of the pension reform will be. If an AB had been in place, it could have been clearly shown what the benefits of the changes introduced into the system would be.
5.2 Actuarial fairness
As Queisser and Whitehouse (Reference Queisser and Whitehouse2006) point out, the concept of actuarial fairness refers to the entire lifetime of contributions and benefits, i.e., the relation (link) between contributions and benefits at the individual level, and requires that the expected (actuarial) value of lifetime contributions equals the expected present value of lifetime benefits. It is important not to confuse this concept with the idea of ‘actuarial neutrality’ or ‘actuarial fairness at margin’, which was mentioned in Section 3 and refers to the effect of working an additional year. Actuarial fairness at margin ensures that, for each individual, the present value of lifetime benefits, net of expected contributions to pay in case of continued work, does not depend on the worker's retirement age.
In the Swedish system, the concept of actuarial fairness is fulfilled through notional defined contribution accounts (NDCs), which, as explained by Chłoń-Domińczak et al. (Reference Chłoń-Domińczak, Franco, Palmer, Holzmann, Palmer and Robalino2012), have also been set up in other countries such as Latvia, Poland and Italy. Egypt and Norway, Holzmann et al. (Reference Holzmann, Palmer and Robalino2012), have also recently legislated NDC reforms.
A notional account, Holzmann and Palmer (Reference Holzmann and Palmer2006), is a virtual account reflecting each participant's individual contributions and the fictitious returns these contributions generate over the course of the participant's working life. The contribution rate is fixed and the returns are calculated in line with a notional rate that may be the growth rate of GDP, the wage bill, contribution payments, etc. When the individual retires, they receive a pension deriving from the value of the accumulated notional account, the expected mortality of the cohort retiring in that year and, possibly, a notional imputed future indexation rate. In this way, the notional model combines PAYG financing with a pension formula that depends on the amount contributed and the return on it.
According to Holzmann (Reference Holzmann, Holzmann and Palmer2006, Reference Holzmann2007), NDCs have sufficient positive features for them to be put forward as a fundamental referent for the future unified pension system of the European Union.
Whitehouse (Reference Whitehouse2010) points out that NDCs are an example of good practice in social security because they deliver retirement incomes in an equitable and economically efficient manner. However, some well-designed DB schemes in OECD countries share almost identical characteristics. He examines four economic advantagesFootnote 29 of NDCs, and finds that the Spanish pension system falls significantly short of best practice in at least two of them.
Generally speaking, well-designed NDCs are considered to have a high level of actuarial fairness (quasi-actuarial fairness) because the pension benefit is computed taking into account contributions paid into the scheme plus the notional returns accrued. However, as Queisser and Whitehouse (Reference Queisser and Whitehouse2006) point out, the picture is more complex, and although at the ‘saving’ phase NDCs are quite fair, at the withdrawal stage actuarial fairness depends on the choice of discount rate in the annuity calculation. In this respect, Belloni and Maccheroni (Reference Belloni and Maccheroni2013) state that the 2007 Italian pension reform, which reduced the temporal validity of the conversion coefficients from 10 years to 3 years, was quite effective in improving actuarial fairness. Nevertheless, actuarial unfairness is still embedded in the Italian DC system due to the use of historical cross-sectional mortality rates in the annuity calculation.
From the perspective of the NDC system, the formula for calculating the retirement pension resulting from the Spanish reform to a great extent reproduces the flaws of the previous legislation and could be much improved as regards actuarial fairness and simplicity. The new formula does not take into account all the contribution effort made by contributors, and it has an excessively complex legal framework full of exceptions in the transitional period.
The level of actuarial (un)fairness of the Spanish system under the new rules is assessed by Boado-Penas and Lanot (Reference Boado-Penas and Lanot2012). They also analyse what the impact on the initial retirement pension amount would be if a generic NDC scheme were applied, using a notional rate equal to the average growth in GDP, the most recent Spanish mortality rates, price indexation of pensions in payment and real data based on the Continuous Sample on Working Lives (2010). Their main findings are that the reform reduces the level of actuarial unfairness for most present and future contributors, but the system's eIRR (3.48%) by far exceeds the average growth rate of GDP recorded in Spain over the period 1992–2011 (2.60%). If the initial retirement pensions were calculated using notional philosophy, this would bring the eIRR closer to the average growth rate of GDP and the pension system could achieve actuarial equilibrium in the medium term.
The advantages, not only as regards actuarial fairness and financial sustainability, would have been considerable if a calculation formula based on notional philosophy had been introduced instead of keeping to the traditional defined-benefit formula:
✓ It would have stimulated contributors’ interest in the pension system.
✓ Initial retirement pensions would have been automatically linked to life expectancy, i.e., there would be an automatic link between changes in life expectancy and the value of benefits.
✓ Pensions in payment would have been automatically linked to the system's financial health, avoiding arbitrariness in benefit indexation rules and adjustment factors.
✓ It would have increased transparency and shown up hidden redistribution.
✓ It would have enabled easy portability of pension rights between jobs, occupations and sectors.
✓ It would have been very easy to implement and would still have used the PAYG system.
Over the last ten years several researchers have recommended that NDCs should be introduced in the Spanish pension system. The first precise and rigorous proposals for reforming the Spanish pension system in the direction of notional accounts were made by Devesa-Carpio and Vidal-Meliá (Reference Devesa-Carpio and Vidal-Meliá2004), Vidal-Meliá and Domínguez-Fabián (Reference Vidal-Meliá, Domínguez-Fabián, Holzmann and Palmer2006), Vidal-Meliá et al. (Reference Vidal-Meliá, Domínguez-Fabián and Devesa-Carpio2006) and Boado-Penas et al. (Reference Boado-Penas, Domínguez-Fabián and Vidal-Meliá2007). Prestigious organizations and ‘think-tanks’ in Spain, such as Fedea (2010) and Unespa (2011), have also recently recognized that the best option for the Spanish system would be to advance in the direction of notional accounts. Unfortunately, none of these proposals were taken into consideration, and they were frequently discredited and ruled out for unsound reasons. Paradoxically, as mentioned in Section 3, just two and a half years after the publication of the 2011 Act, the government is seriously considering the possibility of introducing two of the most noteworthy advantages of NDCs: to link the initial amount of the retirement pensions to life expectancy, and to index pensions in payment to an indicator of the system's financial health.
5.3 Solvency
In the Swedish system this principle mainly involves what is known as the automatic balance mechanism (ABM). Sweden's ABM adjusts pension benefits based on the SI emerging from the pension system's actuarial balance. Generally speaking, Bosworth and Weaver (Reference Bosworth and Weaver2011), ABMs do not specify the exact dimensions and timing of policy changes through advance legislation. Instead, system parameters are adjusted over time without further legislative action in line with movements in actual or projected changes in demographic indicators, economic performance or the financial status of the pension system.
Weaver (2011) reviews the experiences of ABMs in three countries – Canada, Sweden and Germany – and the result clearly suggests that the sustainability of ABMs should not be taken for granted. He concludes that ad hoc interventions by politicians to mitigate potential benefit cuts can be a problem, especially when the losses the ABMs would impose are substantial (notably during financial crises) and/or when elections are imminent. In Sweden, for instance, the mechanism triggered pension cuts in 2010 and 2011, but it was revised to make a slower adjustment, and the effects on benefits were partially offset by changes in pension taxation.
As mentioned in Section 3.1, Spain has legislated a sustainability factor based on differences in life expectancy at age 67 in the year of adjustment and life expectancy at age 67 in 2027. The first adjustment will be in 2032. The Spanish sustainability factor is really a discretionary balance mechanism with a very high level of arbitrariness implicit in its future activation. This presumptuously-named sustainability factor does not fulfil any of the relevant criteria for ABMs:
✓ Automation. The sustainability factor for Spain is not automatic and is only based on life expectancy in 2027. Decisions that may have to be taken to deal with potential situations of insolvency would therefore not be automatic and would not be based on a full solvency or sustainability indicator.
✓ Short-term effects. The Spanish sustainability factor has no short-term effects. The strength of its long-term financial stability is very weak and the rule itself will be modified unpredictably by the political process. As a result the ABM could lose its effectiveness.
✓ Rationality. For Börsch-Supan (Reference Börsch-Supan2007), ABMs make the process of pension system reform more rational in that, first of all, a number of rules that most people would consider reasonable are established but are then subsequently applied automatically only in specific situations in which legislation allowing the same measures would be accepted only with difficulty. In the Spanish case, there are no predetermined rules, only an imprecise commitment to review the parameters of the system every 5 years starting in 2032.
✓ Transparency. In the Spanish case, the designed mechanism is not transparent because it is unclear how adjustments will be made and who will bear the costs when an adjustment occurs.
✓ Gradualness. The measures deriving from the application of ABMs should take the form of progressive changes without any individual or generation carrying too heavy a load over a short period of time. In the case of Spain there is a missed opportunity of at least 20 years (2012–2032) in which an ABM could be applied, and therefore possibly drastic adjustments will have to be made in line with the demographic projections shown in Figure 1.
So far, there has been no legislation detailing how the sustainability factor will really work, but, at the time of this writing (November 2013), due to the harsh criticism received about this aspect of the reform and long-standing demands from the European Commission, the International Monetary Fund and the European Central Bank, the Spanish government is considering introducing a sustainability factor based on life expectancy coefficientsFootnote 30. This would be in force from January 1 2019 onwardsFootnote 31.
According to Meneu-Gaya and Encinas-Goenechea (Reference Meneu-Gaya and Encinas-Goenechea2012), if the sustainability factor currently under discussion in Spain (similar to those in force in Portugal and Finland) and the projected life expectancy provided by the National Institute of Statistics were taken into account, the initial retirement pension in 2032 would be reduced by about 11% in comparison to the same pension awarded in 2013. If the sustainability factor were anticipated and applied every 5 years, however, the initial retirement pension would be reduced by about 2.5% every revision.
Regardless of whether the government eventually decides to introduce the sustainability factor currently under discussion, it would not be unreasonable to say that the Spanish reform falls short from a solvency point of view. An ABM along the lines of those in force in Sweden, Canada and Japan, based on the solvency or sustainability indicator emerging from an actuarial balance, should have been included in the legislation. The advantages would have been clear:
✓ Adjustments would be gradual and objective depending on the solvency or sustainability indicator.
✓ Measures would be applied immediately with a long-term planning horizon matching the pension system's time perspective.
✓ Amendments would bring about greater intergenerational fairness due to the fact that ABMs can be considered time-consistent because no unnecessary adjustments are passed on to future generations.
5.4 Communication with contributors
In the Swedish system, this principle mainly involves the so-called ‘orange envelope’, which has been the cornerstone of communications with participants about the pension system. This method is not limited to Sweden. As Regúlez-Castillo and Vidal-Meliá (Reference Regúlez-Castillo and Vidal-Meliá2012) point out, a number of other countries also provide individual pension information statements on an annual basis, e.g., the ‘blue envelope’ in France, the ‘yellow envelope’ in Germany or the ‘social security statement’ in the USA.
Individual information on pensions can be defined as all the information that individuals require to enabling them to make suitable plans for the non-active period of their adult lives and to cover the risks associated with disability and death, in particular. The statement can also provide information on how the pension system works.
According to Larsson et al. (Reference Larsson, Sundén and Settergren2008), it is significant that many countries made meaningful improvements to the way in which they provided information – or introduced such a system to provide information – in the wake of a reform of their pension system. The provision of individual statements has proved to be an extremely useful tool, as pointed out by Bottazzi et al. (Reference Bottazzi, Jappelli and Padula2006), given that the perceived impact of reforms on individuals depends to a large extent on the information provided about such changes. Similarly, as indicated by Boeri and Tabellini (Reference Boeri and Tabellini2010), necessary reforms can obtain popular support if they are fully described, explained and understood. This also highlights the importance of efforts (by governments) to improve transparency and provide information as regards the future of the social security system as well as possible alternatives in order to guarantee its long-term solvency.
The Spanish social security system only provides annual information about contributions paid, enabling contributors to inform the administration if they detect any anomalies. It recently included computer software on its website to enable contributors to calculate the approximate amount of their future retirement pension, but this is based solely on information the contributors themselves enter.
The reform may be a slight improvement on the previous situation, bearing in mind that Additional Provision 26 reads: ‘Proposal for sending information regarding retirement entitlement’. It is recognized that citizens have a right to receive more and better information from the State and from the private sector in connection with their future rights based on contributions they have made. Despite recognizing this right, which should have been put into practice at the beginning of 2013, the law does not establish exactly to what extent the regulation should be carried out, and neither does it establish whether information about the system's solvency should be included.
So far Additional Provision 26 has not been put into practice, but at the time of this writing (November 2013), the government is currently considering sending out individual pension statements every year to contributors aged 50 and above with the aim of informing them about past contributions and future expected benefits. It is expected that contributors may start to receive their statements through the post from 1 January 2014.
In short, it would not be an exaggeration to say that the reform is weak when it comes to communications with the public because it does not get the message across to affiliates that benefits are dependent on individual and collective elements. On the one hand, individual elements means that benefits are dependent upon the affiliates’ own actions, i.e., the amount of their contributions, the period during which they contribute, the age they retire, etc., while on the other hand, collective elements refers to the system's ability to fulfil its commitments to contributors and pensioners, i.e., the system's financial difficulties may also affect the amount of benefit.
6 Concluding remarks
The 2011 reform of the Spanish public pension system, which would have been unexpected by most of the less well-informed relying on statements made by the government until 2009 and the absence of a recurrently compiled actuarial balance, is a small step towards containing the growth in pension spending as a proportion of GDP and reduces the eIRR for most present and future contributors. However, there is no sound basis for claiming that the system's sustainability is assured in the medium term, the long term or even the short term, and it leaves much to be desired when it comes to reducing the political risk to which the system is exposed and which has been so damaging to it.
In order to assess the 2011 Spanish pension reform we adopt a new qualitative approach instead of quantitative techniques. We review the Spanish pension system using the Swedish system as a benchmark, although some reference to the US pension system is also made, and this could be of interest to social security actuaries, public finance economists and policy-makers and complements the very valuable quantitative assessments made by other researchers. We look at the principles of actuarial fairness, actuarial transparency, solvency and communication with the public, as embodied in instruments to bring them closer to actuarial practices in social security, and the result is disheartening.
If actuarial transparency were a principle that was fully applied in public life in Spain, the reform would have been carried out much earlier. If an official AB had been available, it would have been impossible to disguise the system's true situation and the hoped-for impact of the reform could have been assessed more accurately. However, the worst thing as regards transparency is that there are no plans to compile an AB in the short term to enable the system's situation to be assessed on a regular basis, and therefore it appears that the practice of populism in pensions can continue unabated.
The formula for calculating retirement pension could clearly be improved from the viewpoint of actuarial fairness and simplicity given that it does not take into account the full contributory effort made by affiliates, it has an excessively complex legal framework full of exceptions, it does not explicitly incorporate actuarial elements that ‘reward’ people who remain in the labour market or ‘punish’ those who leave early, and it does not automatically introduce an indicator of the system's financial health when indexing contributions. The formula for calculating benefits does not include mechanisms to reflect economic and demographic changes and therefore does not avoid unnecessary future reforms and gives politicians no incentive not to increase benefits should the economic situation improve.
The reform includes no effective instrument for pushing the system steadily towards solvency. The presumptuously named ‘sustainability factor’ fulfils none of the properties applicable to ABMs: it is not automatic, it is based on only one aspect, i.e., life expectancy, and it has no short-term effects and no predetermined rules, only an intention to review the system's parameters in 2032. It has very little transparency since it is not specified how it might be applied and what groups or collectives might bear the brunt of its application. Finally, it lacks any gradualness given that it ignores an opportunity of at least 20 years, which means that possibly drastic adjustments will need to be carried out later if the projected increase in longevity comes about.
Even if the government eventually decides to introduce the new sustainability factor currently under discussion, it does not appear to be the panacea that will solve the problems faced by the Spanish system caused by serious actuarial imbalances. However, it would certainly be better than the sustainability factor legislated under Act 27/2011, which would not have come into force until 2032.
The reform conveys no message to contributors and pensioners that their benefits depend on both their individual actions (more contributions over more time, retirement age, etc.) and the system's ability to fulfil its acquired commitments to contributors and pensioners. It does not make it clear to affiliates that complicated financial situations, measured by solvency or sustainability indicators, can also affect the amount of benefit.
As a final conclusion it only remains to be said that the reform is a wasted opportunity given that Spain has not taken advantage of the lessons learned in Sweden. It does not ensure the system's sustainability in the short term, it does not increase transparency, it is a long way from achieving actuarial fairness, it does not encourage contributors to think about retirement and the risks to which they are exposed, it does not automatically link benefits to the system's financial health, it does not make redistribution clear and it does not reduce the politicians' incentive to make promises about future pension benefits.
The new parametric reforms currently under consideration in Spain are targeted to correct some of the pension system's design faults that have been highlighted in this paper. However, as happened in a number of badly designed operating systems until it was decided to replace them with new ones, this succession of reforms does not eliminate the feeling that the Spanish pension system will often need to be patched up in the future in an attempt to overcome the serious problems caused by its poor structural design and the lack of appropriate automatic mechanisms to adapt it to changing economic and demographic circumstances.
7 Technical appendix
7.1 Population projection
We apply the same methodology used by the INE (2009) to project the long-term Spanish population. The X-years and s-gender population,
 $P_{S\comma X \plus \setnum{1}}^{t \plus \setnum{1}} $, is projected by the following equation:
 $$P_{S\comma X \plus \setnum{1}}^{t \plus \setnum{1}} \equals {{\lsqb 1 \minus 0.5 \cdot \lpar m_{S\comma X}^{t} \plus e_{S\comma X}^{t} \rpar \rsqb P_{S\comma X}^{t} \plus IM_{S\comma X}^{t} } \over {\left[ {1 \plus 0.5\ \left( {m_{S\comma X}^{t} \plus e_{S\comma X}^{t} } \right)} \right]}}\semi \quad X \equals 0\comma 1\comma \ldots \comma w \minus 1\semi \quad S \equals M\comma F\comma $$
where ‘w’ is the highest age for any member of the group, at which point there are no longer any survivors;
 $m_{S\comma X}^{t} $ is the X-years old and s-gender mortality rate during year t;
 $e_{S\comma X}^{t} $ is the X-years old and s-gender emigration rate during year t; and
 $IM_{S\comma X}^{t} $ is the X-years old and s-gender flow of people abroad during year t.
Those born during year t can be projected using the following expression:
 $$P_{S\comma \setnum{0}}^{t \plus \setnum{1}} \equals {{\left[ {1 \minus 0.5 \cdot \left( {m_{S\comma \minus \setnum{1}}^{t} \plus e_{S\comma \minus \setnum{1}}^{t} } \right)} \right]N_{S}^{t} \plus IM_{S\comma \minus \setnum{1}}^{t} } \over {\left[ {1 \plus 0.5 \cdot \left( {m_{S\comma \minus \setnum{1}}^{t} \plus e_{S\comma \minus \setnum{1}}^{t} } \right)} \right]}}\semi \quad S \equals M\comma F\comma $$
where
 $N_{S}^{t} $ are those of S-gender born during year t. This magnitude is independent of the number of women of childbearing age and X-age fertility rate,
 $f_{x}^{t} $:
 $$N_{S\comma x}^{t} \equals \left( {{{P{}_{M\comma x \minus \setnum{1}}^{t} \plus P{}_{M\comma x}^{t} } \over 2}} \right) \cdot {{f_{x \minus \setnum{1}}^{t} } \over 2} \plus \left( {{{P{}_{M\comma x}^{t} \plus P{}_{M\comma x \plus \setnum{1}}^{t} } \over 2}} \right) \cdot {{f_{x}^{t} } \over 2}\semi \quad X \equals 16\comma \ldots \comma 49\semi \quad S \equals M\comma F.$$
7.2 AB sheet of a DB PAYG system (Swedish model)
According to Vidal-Meliá and Boado-Penas (Reference Vidal-Meliá and Boado-Penas2013), the main entries on the AB sheet for a DB PAYG system are:
Financial asset (FAt). This is the value of the FA owned by the pension system at the date of the balance sheet.
Contribution Asset (CAt). The value of the CA is the product of the turnover duration (TD) and the value of contributions Ct made in that period. The TD is the time expected to elapse from when a monetary unit enters the system as a contribution until it leaves in the form of a pension, assuming economic, demographic and legal conditions to be constant. Likewise, the TD is always equal to the difference in the weighted average ages of contributors
 $\mathop A\nolimits_{c}^{t} $ (weighted by contribution size that takes into account the age-wage profile) and pensioners
 $\mathop A\nolimits_{r}^{t} $ (weighted by pension size that takes into account the age-benefit profile):
 $$\mathop {CA}\nolimits_{t} \equals \mathop C\nolimits_{t} \cdot \underbrace {\lpar \mathop A\nolimits_{r}^{t} \minus \mathop A\nolimits_{c}^{t} \rpar }_{\mathop {TD}\nolimits_{t} .}.$$
Accumulated Deficit (Dat). The accumulation of actuarial losses in each period determines the value of the accumulated shortfall at the date of the balance sheet, and the ‘losses in each period’ represents the difference between the increase in value of the actuarial liabilities and assets for the period.
Financial Liabilities (FLt). This is the value of the system's explicit debt to finance treasury deficits.
Actuarial liabilities are broken down into two groups, liabilities to contributors and liabilities to pensioners:
Liabilities to pensioners  $\lpar V\nolimits_{t}^{r} \rpar $. This is the present actuarial value of benefits in payment and can be expressed in a simplified way as:
 $$\mathop V\nolimits_{t}^{\,r} \equals P_{\lpar x_{e} \plus A\comma t\rpar } \mathop{\sum}\limits_{k \equals \setnum{0}}^{w {\mbox {-}} xe {\mbox {-}} A {\mbox {-}} \setnum{1}} {\mathop N\nolimits_{\lpar x_{e} \plus A \plus k\comma \ t\rpar \ \cdot \ } } \ddot{a}_{x_{e} \plus A \plus k}^{\lambda } \ \mathop {\left[ {{{1 \plus \lambda } \over {1 \plus G}}} \right]}\nolimits^{k} \comma $$
where  $P_{\lpar x_{e} \plus A\comma \ t\rpar } $ is the annual retirement benefit for an individual aged ‘xe+A’ years in year t; ‘xe+A’ years is the ordinary age of retirement;
 $\mathop N\nolimits_{\lpar x_{e} \plus A \plus k\comma \ t\rpar } $ is the number of pensioners aged ‘xe+A+k’ years;
 $\ddot{a}_{x_{e} \plus A \plus k}^{\lambda } $ is the present value of a lifetime annuity due of 1 per year payable in advance and growing at real rate λ, valued at age ‘xe+A+k’ years, with a technical interest rate equal to d=G; ‘xe’ is the age of entry into the system; and ‘A’ is the maximum number of generations of contributors that coexist at the same time.
Liabilities to current contributors  $\mathop {\lpar V}\nolimits_{t}^{c} \rpar $. This can be calculated as the difference between the present value of future pensions and the present value of future contributions:
 $$\mathop V\nolimits_{t}^{c}\! \equals\! \overbrace {P_{\lpar x_{e} \plus A\comma \ t\rpar } \cdot \mathop {\mathop N\nolimits_{\lpar xe \plus A\comma \ t\rpar } }\nolimits_{} \cdot \ddot{a}_{xe \plus A}^{\lambda } \mathop{\sum}\limits_{h \equals \setnum{1}}^{A} {\mathop {\mathop {\left[ {{{1 \plus G} \over {1 \plus d}}} \right]}\nolimits^{h} }\nolimits^{} } }^{{\rm Future\ benefits}}\!\!\minus\! \underbrace {\theta \cdot\! \mathop{\sum}\limits_{k \equals \setnum{0}}^{A \minus \setnum{1}} {\mathop{\sum}\limits_{h \equals \setnum{0}}^{k} {N_{\lpar xe \plus k\comma \ t\rpar } } } \cdot \mathop {y_{\lpar xe \plus k\comma \ t\rpar } }\!\mathop {\left[ {{{1 \plus G} \over {1 \plus d}}} \right]}\nolimits^{h} }_{{\rm Future\ contributions}}\comma $$
where θ is the total contribution rate for the retirement contingency and y (xe+k, t) is the average contribution base by age at time t.
Accumulated Surplus (Sat). This is determined by the accumulation of actuarial profits in each period considered. The annual actuarial profit is calculated as the difference between the increase in the value of the assets and the actuarial liabilities.
The solvency ratio (SIt) indicator emerges from the AB sheet and can be expressed as:
 $$\eqalign{\mathop {SI}\nolimits_{t} \equals {{{\rm Assets\ }} \over {{\rm \ Liabilities}}} \equals {{\overbrace {\mathop\ \ {FA}\nolimits_{t}^{}\ \ }^{{\rm Financial\ asset\ }} \plus \overbrace {\mathop {AC}\nolimits_{t} }^{{\rm Contribution\ asset\ }}} \over {\underbrace {\mathop V\nolimits_{t}^{c\ } }_{{\rm Liabilities\ to\ contributors\ }} \plus \underbrace {\mathop V\nolimits_{t}^{r\ } }_{{\rm Liabilities\ to\ pensioners\ }} \plus \underbrace {\mathop {FL}\nolimits_{t} }_{{\rm Financial\ liabilities}}}} \approx 1$$
and is equal to one in the case of a balanced pension system. If only the system's actuarial entries are taken into account with the aim of disregarding the financial effect, then the new indicator, ASIt, is:
 $$\mathop {ASI}\nolimits_{t} \equals {{\mathop {AC}\nolimits_{t} } \over {\mathop V\nolimits_{t}^{c\ } \plus \mathop V\nolimits_{t}^{r\ } }}.$$
The methodology used to project the SI for a long-term horizon is based on an aggregate accounting projection model (AAM) of spending on pensions, which is briefly explained in the next section.
7.3 The US AB model
This measures the difference between the present value – discounted by the projected yield on trust fund assets – of income from contributions and spending on pensions, expressed as a percentage of the present value of the contribution bases for that time horizon, taking into account that the level of financial reserves (trust fund) at the end of the time horizon reaches a magnitude of 1 year's expenditure.
In simplified form, the AB can be expressed as:
 $$\eqalign{AB \equals\tab \underbrace {\left[ {{{\overbrace {\mathop {TF}\nolimits_{\setnum{0}} }^{{\rm Trust\ \ fund}} \plus \overbrace {\mathop y\nolimits_{\setnum{0}} \cdot \sum\limits_{t \equals \setnum{0}}^{\setnum{74}} {\mathop {\mathop {\mathop {\mathop \theta \nolimits_{t} \cdot N}\nolimits_{t} \cdot \prod\limits_{h \equals \setnum{1}}^{t} {{{\lpar 1 \plus \mathop g\nolimits_{h} \rpar } \over {\lpar 1 \plus \mathop r\nolimits_{h} \rpar }}} }\nolimits^{} }\nolimits_{} } }^{{\rm Present\ value\ of\ contributions}}} \over {\underbrace {\mathop y\nolimits_{\setnum{0}} \cdot \sum\limits_{t \equals \setnum{0}}^{\setnum{74}} {\mathop {\mathop {\mathop N\nolimits_{t} \cdot \prod\limits_{h \equals \setnum{1}}^{t} {{{\lpar 1 \plus \mathop g\nolimits_{h} \rpar } \over {\lpar 1 \plus \mathop r\nolimits_{h} \rpar }}} }\nolimits^{} }\nolimits_{} } }_{{\rm Present\ value\ of\ payrolls}}}}} \right]}_{{\rm Summarized\ income\ rate}} \cr\tab\minus \underbrace {\left[ {{{\overbrace {\mathop B\nolimits_{\setnum{0}} \cdot \sum\limits_{t \equals \setnum{0}}^{\setnum{74}} {\mathop {\mathop {\mathop R\nolimits_{t} \cdot \prod\limits_{h \equals \setnum{1}}^{t} {{{\lpar 1 \plus \mathop \lambda \nolimits_{h} \rpar } \over {\lpar 1 \plus \mathop r\nolimits_{h} \rpar }}} }\nolimits^{} }\nolimits_{} } }^{{\rm Present\ value\ of\ benefits}} \plus \overbrace {\prod\limits_{h \equals \setnum{1}}^{\setnum{74}} {{{\lpar \mathop {TF}\nolimits_{\setnum{74}} \rpar } \over {\lpar 1 \plus \mathop r\nolimits_{h} \rpar }}} }^{{\rm Trust\ fund}}} \over {\underbrace {\mathop y\nolimits_{\setnum{0}} \cdot \sum\limits_{t \equals \setnum{0}}^{\setnum{74}} {\mathop {\mathop {\mathop N\nolimits_{t} \cdot \prod\limits_{h \equals \setnum{1}}^{t} {{{\lpar 1 \plus \mathop g\nolimits_{h} \rpar } \over {\lpar 1 \plus \mathop r\nolimits_{h} \rpar }}} }\nolimits^{} }\nolimits_{} } }_{{\rm Present\ value\ of\ payrolls}}}}} \right]}_{{\rm Summarized\ cost\ rate}} \approx 0\comma $$
which in a situation of financial equilibrium for the valuation period, should give a zero value, where: TF0 is the value of the assets at the beginning of the valuation period; θt is the payroll tax (contribution) rate in year t; y 0 is the average contribution base in year 0; Nt is the number of contributors in year t; g is the annual real growth rate of wages; r is the projected yield on trust fund assets; B 0 is the average pension (benefit) in year 0; Rt is the number of pensioners in year t; λ is the annual real growth rate of benefits; and TF74 is the value of the assets at the end of the valuation period.
For Goss (Reference Goss2010), it is often desirable to express the outcome of a complex process in a single number. Historically, a single summary number, referred to as the US AB, has been used as a measure of the financial status of the OASDI programme.
The main methodology used to compile the US AB might best be described as an AAM of spending on pensions. This approach basically relies on making a variety of assumptions regarding the economy as a whole, taking into account future trends in demography (fertility rates, migration flows, life expectancy), economic conditions (participation and ERs, productivity, wages, interest rates) and the rules governing the pension system (coverage, pension levels).
7.4 The annual growth factor (AGF) for all pensions proposed by the Committee of Experts on the sustainability factor of the public pension system (CESFPPS)
The AGF proposed by CESFPPS (2013) determines the indexation of all pensions in payment according to a rate that depends on the growth of the system's revenue and on the number of pensions, the replacement effect (derived from the fact that the pensioners who enter the system every year do so with pensions that are different from those who exit the system) and the differences between revenue and expenditure over the economic cycle.
The AGF that would be applied to index all pensions in payment in t+1 would be calculated according to the following formula:
 $$\mathop {AGF}\nolimits_{t \plus \setnum{1}} \equals \mathop {\bar{g}r}\nolimits_{t} \minus \mathop {\bar{g}p}\nolimits_{t} \minus \mathop {\bar{g}re}\nolimits_{t} \plus \alpha \cdot \left( {{{\mathop R\nolimits_{t}{\hskip -4pt\ast } \minus \mathop E\nolimits_{t}{\hskip -4pt\ast } } \over {\mathop R\nolimits_{t}{\hskip -4pt\ast } }}} \right)\comma $$
where
 $\mathop {\bar{g}r}\nolimits_{t} $ is the growth rate of the system's revenue in t;
 $\mathop {\bar{g}p}\nolimits_{t} $ is the growth rate of the number of pensions;
 $\mathop {\bar{g}re}\nolimits_{t} $ is the increase in the average pension due to the replacement effect; α is a parameter that redistributes the adjustment caused by budget imbalances between pensioners and contributors in the system;
 $\mathop R\nolimits_{t}{\hskip -4pt\ast } $ is the system's income; and
 $\mathop E\nolimits_{t}{\hskip -4pt\ast } $ the spending on pensions. All the variables are defined in nominal terms.
The bar (−) above the growth rates indicates that they have to be calculated as a moving arithmetic mean. The asterisk (*) indicates that the revenue and expenditure have to be calculated as a moving geometric mean. Both averages have to be calculated taking into account an uneven number of years (n) and are centred on t, i.e., they take into account the (n−1)/2 previous periods and the (n−1)/2 subsequent periods.
If the systems were in equilibrium
 $\lpar R\nolimits_{t}{\hskip -3pt\ast } \minus E\nolimits_{t}{\hskip -3pt\ast } \rpar $, and if the real growth of revenue were greater than the growth in the number of pensions plus the growth of the replacement effect, the AGF would be greater than the average rate of inflation, i.e., the rate of indexation would be positive in real terms.
The government has proposed (November 2013) to set limits on the annual result of the indexation rule:
 $$0.0025{\rm \ \ }\leqslant {\rm \ \ }\overbrace {\mathop {\bar{g}r}\nolimits_{t} \minus \mathop {\bar{g}p}\nolimits_{t} \minus \mathop {\bar{g}re}\nolimits_{t} \plus \alpha \cdot \left( {{{\mathop R\nolimits_{t}{\hskip -4pt\ast } \minus \mathop E\nolimits_{t}{\hskip -4pt\ast } } \over {\mathop R\nolimits_{t}{\hskip -4pt\ast } }}} \right)}^{\mathop {AGF}\nolimits_{{t \plus \setnum{1}}} }{\rm \ \ }\leqslant \mathop {{\rm \ }RPI}\nolimits_{t} \plus 0.005.$$
As Formula (17) shows, in the worst scenario, pensions in payment would increase by 0.25%; i.e., some growth in nominal terms of the pensions in payment would be assured.
Finally, CESFPPS (2013) has suggested that the value of α should be between 1/4 and 1/3, but the Spanish government has proposed that the value of this coefficient be agreed annually. The minimum value recommended by the Committee is the same that was fixed, Börsch-Supan (2007), for the equivalent coefficient in the sustainability factor introduced in Germany in 2005.