1. Introduction
Turbulent plumes generated by continuous sources or sinks of buoyancy are ubiquitous in nature. Examples include smoke emitted into the atmosphere from chimneys or volcanic eruptions (e.g. Turner Reference Turner1973; Baines & Sparks Reference Baines and Sparks2005), descending convection in high-latitude oceans or under polynyas caused by surface cooling (e.g. Marshall & Schott Reference Marshall and Schott1999; Okada, Ikeda & Minobe Reference Okada, Ikeda and Minobe2004), and hot springs in volcanic lakes and oceans both on and beyond Earth (e.g. Lupton et al. Reference Lupton, Delaney, Johnson and Tivey1985; Varekamp & Rowe Reference Varekamp and Rowe1997; Goodman & Lenferink Reference Goodman and Lenferink2012). Such plumes can affect the spread of pollutants, transport and mixing of heat and materials (e.g. nutrition and biomass), and hence the local environment and biosphere. Understanding the growth and dynamics of such plumes is therefore crucial.
Here, we focus on hydrothermal plumes driven by isolated point sources – also referred to as point plumes – in an unstratified environment. This configuration is less investigated in the context of Earth oceanography, because weakly stratified oceans are less common on Earth as the oceans are predominantly heated from above, and the buoyancy source from the atmosphere is usually associated with large spatial scales (Schott & Leaman Reference Schott and Leaman1991; Marshall & Schott Reference Marshall and Schott1999). For these reasons, most previous studies of plume convection have focused on penetrative plumes in a stratified ocean or convection driven by wide-spread buoyancy sources (see e.g. Jones & Marshall Reference Jones and Marshall1993; Maxworthy Reference Maxworthy1997; Marshall & Schott Reference Marshall and Schott1999). However, under certain conditions, oceans or lakes can become unstratified or even convectively unstable due to heat sources at the sea floor or cooling at the surface. Examples include the polar oceans during winter (e.g. the Gulf of Lions and the Greenland sea; MEDOC-Group 1970; Schott, Visbeck & Fischer Reference Schott, Visbeck and Fischer1993), lakes beneath polynyas (e.g. Lakes Vostok and Onega; Wüest & Carmack Reference Wüest and Carmack2000; Bouffard & Wüest Reference Bouffard and Wüest2019), subsurface oceans on Snowball Earth (Yang, Peltier & Hu Reference Yang, Peltier and Hu2012; Ashkenazy et al. Reference Ashkenazy, Gildor, Losch, Macdonald, Schrag and Tziperman2013), and icy moons such as Europa (the second moon of Jupiter; Goodman et al. Reference Goodman, Collins, Marshall and Pierrehumbert2004) and Enceladus (the second moon of Saturn; Kang et al. Reference Kang, Marshall, Mittal and Bire2022a , Reference Kang, Mittal, Bire, Campin and Marshallb ). In addition, hydrothermal vent activities have been found to exist on Earth (Thomson et al. Reference Thomson, Delaney, McDuff, Janecky and McClain1992) and have been hypothesised for icy satellites (Vance & Goodman Reference Vance and Goodman2009; Choblet et al. Reference Choblet, Tobie, Sotin, Běhounková, Čadek, Postberg and Souček2017), motivating us to investigate the behaviour of rotating point plumes in an unstratified fluid (ocean).
Point plumes in an unstratified fluid in the absence of background rotation were first investigated in the milestone study of Morton et al. (Reference Morton, Taylor and Turner1956), hereafter referred to as MTT. By hypothesising that entrainment varies in proportion to the plume velocity, MTT found analytical solutions for the plume characteristics (width, buoyancy and speed). Such plumes are found to rise in a conical shape with decreasing buoyancy and speed, and have been studied in laboratory experiments (e.g. Morton et al. Reference Morton, Taylor and Turner1956; Boubnov & van Heijst Reference Boubnov and van Heijst1994; Ferrero et al. Reference Ferrero, Salizzoni, Ive, Manfrin, Forza, Bisignano and Mortarini2022) and numerical simulations (e.g. Abdalla, Cook & Hunt Reference Abdalla, Cook and Hunt2009; Bhaganagar & Bhimireddy Reference Bhaganagar and Bhimireddy2020).
In the presence of rotation, a point plume would start life as a non-rotating MTT plume, then transit to a cylindrical plume with constant buoyancy anomaly surrounded by rim currents. The transition height and the width of the plume follow the rotational length scale
 $ L_{ \!\textit{ rot}}^p\equiv (F_0/f^3)^{1/4}$
, the only length scale in the system independent of diffusivity and viscosity. Here,
 $F_0$
is the buoyancy flux at the source, and
 $f$
is the Coriolis parameter. This is supported by laboratory experiments (Fernando, Chen & Ayotte Reference Fernando, Chen and Ayotte1998; Goodman et al. Reference Goodman, Collins, Marshall and Pierrehumbert2004; Frank et al. Reference Frank, Landel, Dalziel and Linden2017; Ma, Flynn & Sutherland Reference Ma, Flynn and Sutherland2020; Ferrero et al. Reference Ferrero, Salizzoni, Ive, Manfrin, Forza, Bisignano and Mortarini2022) and numerical simulations (Goodman & Lenferink Reference Goodman and Lenferink2012). Upon impact of an upper boundary, cylindrical plumes are found to undergo baroclinic instability, scattering buoyancy away from the source (Fernando et al. Reference Fernando, Chen and Ayotte1998; Goodman et al. Reference Goodman, Collins, Marshall and Pierrehumbert2004).
However, a rotating plume does not necessarily reach the top surface in an unstratified environment. Water tank experiments by Goodman et al. (Reference Goodman, Collins, Marshall and Pierrehumbert2004) and oceanic numerical simulations by Kang et al. (Reference Kang, Marshall, Mittal and Bire2022a ) and Bire et al. (Reference Bire, Mittal, Kang, Ramadhan, Tuckman, German, Thurnherr and Marshall2023) demonstrate that concentrated plumes can break up into eddies in mid-tank/ocean, indicating that the rotation-dominated cylindrical plume may not be the final stage of their evolution. This final stage has rarely been investigated, despite its critical role in determining whether heat and tracers remain concentrated during transport to the surface.
In this paper, we investigate the development of rotating point plumes in an unstratified fluid using both theoretical analysis and numerical simulations. Specifically, we are interested in the transport of tracers originating from the heat source, motivated by the observation that fluid from hydrothermal vents can have markedly different chemical compositions than the surrounding fluid (German & Seyfried Reference German and Seyfried2014). Since the transport of these tracers follows the same governing equation as buoyancy, we can track their distribution without introducing an additional tracer field. Future work is needed to account for the possibility that tracers may not originate from the heat source, may have finite lifetimes, and/or may undergo phase changes (e.g. bubble plumes; Frank et al. Reference Frank, Landel, Dalziel and Linden2021). Here, we aim to address two key questions. (i) What factors determine whether a plume remains concentrated as it approaches the top surface or instead disperses before doing so? (ii) How does a plume evolve after impacting boundaries? Our paper is organised as follows. A brief description of our numerical method is provided in § 2. The development of a free point plume unconstrained by boundaries is first presented in § 3. Then the development of the plume in a finite domain is investigated in § 4, where the two key questions are answered. The effect of source size is discussed in § 5, and key conclusions are summarised in § 6. Additional information not directly related to the main results is provided in the supplementary material available at https://doi.org/10.1017/jfm.2025.10533.
2. Numerical method
2.1. Key parameters
The plume is driven by a buoyancy source at the bottom and grows in a rectangular domain that rotates along the
 $z\hbox {-}$
axis at rate
 $\varOmega$
. Since we focus on the fully developed plume that is independent of diffusivity and viscosity, we expect five free parameters determining the plume dynamics,
 $L,H,r_{ { s}},F_0,f$
. Here,
 $L$
and
 $H$
are the width and height of the domain,
 $r_{ { s}}$
is the radius of the source as the ‘point’ source is actually a finite circular area,
 $F_0$
(with units m
 $^{4}$
s
 $^{-3}$
) is the buoyancy flux imposed at the source, and
 $f=2\varOmega$
is the Coriolis parameter.
The dynamics of the rotating point plumes, where the source size
 $r_{ { s}}$
is small enough to be approximated as a geometric point, is primarily governed by
 $F_0$
and
 $f$
. These two physical parameters define a length scale
 \begin{equation} L_{ \!\textit{ rot}}^p=\left (\frac {F_0}{f^3}\right )^{\frac{1}{4}}, \end{equation}
where the superscript
 $p$
indicates a point plume. This rotational length scale has been used extensively to describe the characteristic scale of convective plumes in a rotating regime, such as by Speer & Marshall (Reference Speer and Marshall1995), Fernando et al. (Reference Fernando, Chen and Ayotte1998) and Bire et al. (Reference Bire, Mittal, Kang, Ramadhan, Tuckman, German, Thurnherr and Marshall2023).
Naturally, the system can be non-dimensionlised using
 $L_{ \!\textit{ rot}}^p$
, yielding the dimensionless parameters
 \begin{equation} \left (\widehat {L},\widehat {H},\widehat {r}_{ { s}}\right )\equiv \left (\frac {L}{L_{ \!\textit{ rot}}^p},\frac {H}{L_{ \!\textit{ rot}}^p},\frac {r_{ { s}}}{L_{ \!\textit{ rot}}^p}\right )\!. \end{equation}
Hereafter,
 $\widehat { ({\cdot })}$
denotes dimensionless parameters. The point source corresponds to
 $\widehat {r}_{ { s}}\ll 1$
, so its geometry is negligible. Instead of using
 $\widehat {L}$
and
 $\widehat {H}$
, the following two dimensionless numbers are more commonly used and more convenient for analyses:
 \begin{equation} (\varGamma ,Ro^{*p})\equiv \left (\frac {L}{H},\frac {L_{ \!\textit{ rot}}^p}{H}\right )\!, \end{equation}
where
 $\varGamma$
is the domain aspect ratio, and
 $Ro^{*p}$
describes the extent to which rotation dominates the dynamics when the plume reaches the surface at height
 $H$
(Goodman et al. Reference Goodman, Collins, Marshall and Pierrehumbert2004; Goodman & Lenferink Reference Goodman and Lenferink2012; Bire et al. Reference Bire, Mittal, Kang, Ramadhan, Tuckman, German, Thurnherr and Marshall2023). This
 $Ro^{*p}$
is often referred to as a natural Rossby number, since the characteristic velocity of rotating plumes is typically scaled by
 $L_{ \!\textit{ rot}}^pf$
, making
 $Ro^{*p}$
equivalent to the Rossby number (Jones & Marshall Reference Jones and Marshall1993).
When the source size is non-negligible, i.e.
 $\widehat {r}_{ { s}}\gtrsim 1$
, the buoyancy flux per unit area should be the key parameter determining plume dynamics. In this circumstance, the rotational length scale can be formulated as
 \begin{equation} L_{ \!\textit{ rot}}^a=\left (\frac {F_0}{r_{ { s}}^2f^3}\right )^{\frac{1}{2}}\!, \end{equation}
where the superscript
 $a$
represents per unit area. This
 $L_{ \!\textit{ rot}}^a$
has been commonly used in studies of convection driven by wide and homogeneous buoyancy sources (e.g. Stone Reference Stone1968; Fernando, Chen & Boyer Reference Fernando, Chen and Boyer1991; Bire et al. Reference Bire, Kang, Ramadhan, Campin and Marshall2022).
In §§ 3 and 4, we focus on the former case, where the buoyancy source can be treated as a geometric point, and the influence of the source radius on the plume dynamics is explored further in § 5.
2.2. Model description and simulation design
We perform high-resolution simulations for rotating hydrothermal plumes using Oceananigans.jl, a GPU-based model that solves non-hydrostatic equations (Ramadhan et al. Reference Ramadhan, Wagner, Hill, Campin, Churavy, Besard, Souza, Edelman, Ferrari and Marshall2020)
 \begin{align}&\qquad\qquad\quad \boldsymbol{\nabla }\boldsymbol{\cdot }\boldsymbol{u}=0, \end{align}
 \begin{align} \frac {\partial \boldsymbol{u}}{\partial t}&=-\boldsymbol{u}\boldsymbol{\cdot }\boldsymbol{\nabla }\boldsymbol{u}-f\boldsymbol{k}\times \boldsymbol{u}+b\boldsymbol{k}+\nu {\nabla} ^2\boldsymbol{u}, \end{align}
 \begin{align} \frac {\partial b}{\partial t}&=-\boldsymbol{u}\boldsymbol{\cdot }\boldsymbol{\nabla }b+\kappa {\nabla} ^2b, \end{align}
where
 $\boldsymbol{u}=(u,v,w)$
is the three-component velocity,
 $\boldsymbol{k}$
is the unit vector along the
 $z$
-axis,
 $b$
is the buoyancy, and
 $\nu$
and
 $\kappa$
are viscosity and diffusivity, respectively.
Rather than adopting an explicit subgrid-scale turbulence closure as in conventional large eddy simulations (LES), we utilise the high-order weighted, essentially non-oscillatory (WENO; Shu Reference Shu2009) advection scheme to stabilise the solution, which is implemented in Oceananigans.jl. This scheme acts as an implicit, adaptive hyper-viscosity mechanism that provides dissipation based on the local smoothness of the solution, which is usually categorised as an implicit LES framework (Grinstein, Margolin & Rider Reference Grinstein, Margolin and Rider2007; Karaca, Lardjane & Fedioun Reference Karaca, Lardjane and Fedioun2012; Pressel et al. Reference Pressel, Mishra, Schneider, Kaul and Tan2017). By relying on the WENO scheme, this model avoids the need to tune uncertain free parameters, and retains effective resolution of turbulence even at lower grid resolutions (Silvestri et al. Reference Silvestri, Wagner, Campin, Constantinou, Hill, Souza and Ferrari2024).
Our domain spans from
 $-L/2$
to
 $L/2$
in both the
 $x$
- and
 $y$
-directions with doubly periodic boundary conditions. This set-up is intended to represent a scenario in which a cluster of hydrothermal vents is evenly distributed over an extended surface area. Caution needs to be taken if the application’s configuration is different. In the vertical direction (
 $z$
-direction), our domain covers
 $z=0$
to
 $z=H$
. The rotation rate is set to
 $\varOmega$
along the
 $z$
-axis. The initial velocity and buoyancy are both set to zero. At the top, we adopt a stress-free condition for velocity and a no-flux condition for buoyancy, i.e.
 \begin{equation} w=0,\quad \frac {\partial ^2w}{\partial z^2}=0,\quad \frac {\partial b}{\partial z}=0\qquad \mathrm{at}\ z=H. \end{equation}
This corresponds to a scenario where the rate of heat exchange with the top surface is much slower compared to the motion and evolution of the plume (Goodman & Lenferink Reference Goodman and Lenferink2012). At the bottom, we still adopt a stress-free condition for velocity, but prescribe a steady, axis-symmetric, Gaussian-like buoyancy flux
 $F$
:
 \begin{equation} w=0,\quad \frac {\partial ^2w}{\partial z^2}=0,\quad F(x,y)=F_A\exp \left (-\frac {x^2+y^2}{r_{ { s}}^2}\right )\qquad \mathrm{at}\ z=0, \end{equation}
where
 $F_A$
(with units m
 $^2$
s
 $^{-3}$
) is the maximum buoyancy flux per unit area. The total buoyancy flux is thus given by
 \begin{equation} F_0=\iint F(x,y)\,\mathrm{d}x\mathrm{d}y=\unicode{x03C0} r_{ { s}}^2F_A. \end{equation}
In this rotating-plume system, two types of instabilities play a role in the plume development. The first is the Kelvin–Helmholtz instability (KHI), which occurs during the initial stage, and triggers the transition from a laminar state to a turbulent state (Kitamura & Sumita Reference Kitamura and Sumita2011; Ward Reference Ward2022). The second instability is baroclinic instability (BCI), which occurs after the plume fully develops (Fernando et al. Reference Fernando, Chen and Ayotte1998; Goodman et al. Reference Goodman, Collins, Marshall and Pierrehumbert2004), and drives lateral mixing between the plume and the ambient fluid. Capturing both instabilities is challenging as BCI occurs at much larger length scales than KHI. To proceed, we set a non-uniform mesh that is refined near the source and gradually coarsens in the upper domain. The dimensionless horizontal and vertical grid sizes,
 $\widehat {\varDelta }_h$
and
 $\widehat {\varDelta }_z$
, are given by
 \begin{equation} \widehat {\varDelta }_h\equiv \frac {\varDelta _h}{L_{ \!\textit{ rot}}^p}=0.04,\quad\widehat {\varDelta }_z\equiv \frac {\varDelta _z}{L_{ \!\textit{ rot}}^p}=\left \{\!\! \begin{array}{ll} 0.02 & 1\leqslant N_z\leqslant 300, \\ 0.02\times 1.01^{(N_z-300)} &301\leqslant N_z\leqslant 450, \\ 0.02\times 1.01^{150} & 451\leqslant N_z\leqslant 1050, \end{array} \right . \end{equation}
where
 $N_z$
denotes the vertical grid index, and subscripts
 $h$
and
 $z$
refer to horizontal and vertical directions, respectively. The total number of grid cells is 486 in both
 $x$
- and
 $y$
-directions, and is 1050 in the vertical, resulting in dimensionless domain size
 $\widehat {L}=19.44$
and
 $\widehat {H}=66.34$
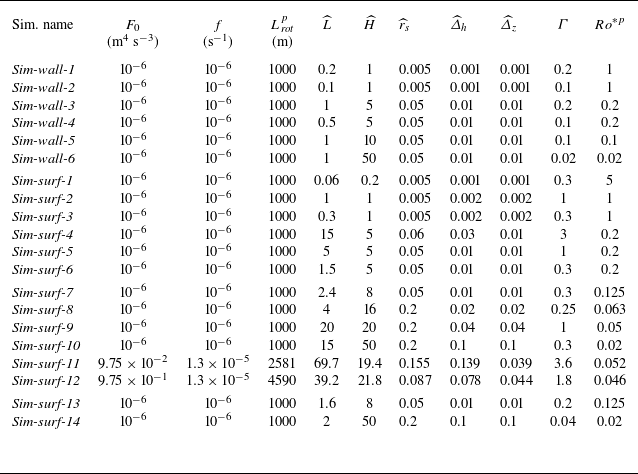
. One simulation using this refined mesh is conducted as the reference case, which is referred to as Sim-refine (table 1). The results of this simulation are presented in figure 1. However, due to computational resource limitations, most simulations are performed on a uniform mesh with somewhat lower resolution (tables 1 and 2). The reduced resolution may delay the onset of KHI due to a compromised ability to resolve small-scale turbulence (i.e. the WENO scheme leads to larger numerical diffusivity and viscosity), potentially affecting the subsequent onset of BCI and our main results. To assess the numerical convergence with respect to resolution, a grid sensitivity analysis is presented in § 3.4.
Summary of parameters used in the numerical simulations for free plumes discussed in § 3: names of simulations, buoyancy flux
 $F_0$
, Coriolis parameter
 $f$
, rotational length scale
 $L_{ \!\textit{ rot}}^p$
, dimensionless (hereafter) domain width
 $\widehat {L}$
and height
 $\widehat {H}$
, source radius
 $\widehat {r}_{ { s}}$
, horizontal and vertical grid sizes
 $\widehat {\varDelta }_h$
and
 $\widehat {\varDelta }_z$
, domain aspect ratio
 $\varGamma$
, and natural Rossby number
 $Ro^{*p}$
. Parameters in Sim-repeat are the same as one simulation in Bire et al. (Reference Bire, Mittal, Kang, Ramadhan, Tuckman, German, Thurnherr and Marshall2023).

2.3. Diagnosis of plume morphology
To diagnose the height and width of the plume, we first compute the buoyancy field averaged along the
 $y$
-direction, and then diagnose the envelope of the plume
 $\mathcal{C}$
following
 \begin{equation} \mathcal{C}(t)\equiv \left \{(x,z)\,\bigg |\,\frac {\overline {b}^y}{\overline {b}^y_s}=0.1\, \%\right \}\!, \end{equation}
where
 $\overline {({\cdot })}^y$
denotes the average along the
 $y$
-direction, and the subscript
 $s$
indicates calculation at the source. This approach, equivalent to a side-view perspective, minimises the need to store large three-dimensional datasets, and ensures that the farthest plume front is captured regardless of its position. In this way, the plume height
 $h_{ { p}}$
is then diagnosed as the height of the highest point on
 $\mathcal{C}$
, and the plume width
 $d_{ { p}}$
is diagnosed as the horizontal distance between the minimum and maximum
 $x$
-coordinates on
 $\mathcal{C}$
, i.e.
 \begin{equation} h_{ { p}}\equiv \max(z(\mathcal{C})),\quad d_{ { p}}\equiv \max(x(\mathcal{C}))-\min(x(\mathcal{C})). \end{equation}
The three development stages of a free rotating point plume in an unstratified environment. (a) Diagram of three stages during a plume’s growth. (b–g) Instantaneous snapshots of the dimensionless buoyancy in the simulation Sim-refine in table 1: (b–d) side view, (e–g) bird’s-eye view. Superscripts
 $y$
and
 $z$
denote averaging along the
 $y$
- and
 $z$
-directions, respectively. In each panel, the theoretical predictions of geometry (if they exist) are represented by black dashed curves. (h–j) Vertical profiles of scaled vertical velocity (blue) and buoyancy (green) at the plume centre. Dashed curves represent theoretical predictions (
 $W$
and
 $B$
, if they exist), and solid curves represent simulated results (
 $W_{sim}$
and
 $B_{sim}$
). In (h), the vertical velocity and buoyancy are scaled by
 $W(L_{ \!\textit{ rot}}^p)$
and
 $B(L_{ \!\textit{ rot}}^p)$
calculated from (3.2) and (3.3), respectively. In (i) and ( j), they are scaled by
 $w_{ { c}}$
and
 $b_{ { c}}$
from (3.8) and (3.9), respectively.

Same as table 1, but for plumes constrained by boundaries discussed in § 4. Parameters in Sim-surf-11 and Sim-surf-12 are the same as simulations shown in figures 2 and 3 in Goodman & Lenferink (Reference Goodman and Lenferink2012).

The 0.1 % threshold is chosen as it captures the bulk of the convective plume while minimising the influence of diffusion at the edges. Our results in this study are insensitive to the choice of the threshold, as the transition from a finite
 $b$
to zero occurs in a very narrow spatial region (see supplementary figures S1 and S2).
3. Development of a free single point plume
We begin by investigating the development of a single free plume, unaffected by any boundaries. Initially, it behaves like a free-turbulent plume. As rotation becomes significant, it transforms into a Taylor column and eventually becomes destabilised (figure 1).
In this section, we conduct the numerical simulations listed in table 1. The results used to visualise the plume evolution are taken from Sim-refine. Other simulations were performed on a lower resolution uniform mesh. The sensitivity of our results to grid resolution is examined in § 3.4.
3.1. Stage-1: free-turbulent plume
In the first stage, the buoyant fluid emanating from the source is not yet influenced by rotation, so the plume is filled by three-dimensional turbulence. These turbulent motions entrain dense ambient fluid into the plume, reducing its buoyancy and vertical velocity while expanding laterally to form a cone shape (stage-1 in figure 1 a).
During this stage,
 $F_0$
is the only external dimension parameter that determines the plume. As shown in MTT, the radius of the plume
 $R$
, the upwelling velocity
 $W$
, and buoyancy anomaly
 $B$
at the plume centre follow
 \begin{align} R(z)&=\frac {6}{5}\alpha z\approx 0.11z, \end{align}
 \begin{align} W(z)&=\frac {5}{6\alpha }\left [\frac {9\alpha }{5}\left (\frac {2F_0}{\unicode{x03C0} }\right )\right ]^{\frac{1}{3}}z^{- \frac{1}{3}}\approx 4.25 (F_0z^{-1})^{\frac{1}{3}}\!, \end{align}
 \begin{align} B(z)&=\frac {5}{6\alpha }\left [\frac {9\alpha }{5}\left (\frac {2F_0}{\unicode{x03C0} }\right )\right ]^{- \frac{1}{3}}\left (\frac {2F_0}{\unicode{x03C0} }\right )z^{-\frac {5}{3}}\approx 12 (F_0^2z^{-5})^{\frac{1}{3}} \!, \end{align}
where
 $\alpha$
is the entrainment coefficient (
 $=0.093$
for buoyant plume; Morton et al. Reference Morton, Taylor and Turner1956). Also, we can obtain a volume flux
 $\mu$
and a momentum flux
 $m$
from MTT:
 \begin{align} \mu (z)&=\frac {6\alpha \unicode{x03C0} }{5}\left [\frac {9\alpha }{5}\left (\frac {2F_0}{\unicode{x03C0} }\right )\right ]^{\frac{1}{3}}z^{\frac{5}{3}}\approx 0.17 (F_0z^5)^{\frac{1}{3}}, \end{align}
 \begin{align} m(z)&=\frac {\unicode{x03C0} }{2}\left [\frac {9\alpha }{5}\left (\frac {2F_0}{\unicode{x03C0} }\right )\right ]^{ \frac {2}{3}}z^{\frac{4}{3}}\approx 0.35(F_0z^2)^{\frac{2}{3}}, \end{align}
which align with the measurements from laboratory experiments (Rouse et al. Reference Rouse, Shun Yih and Humphreys1952; List & Imberger Reference List and Imberger1973; List Reference List1982).
The evolution of the plume in the reference case Sim-refine is shown in figure 1. In the early stage after model initialisation, a free-turbulent plume is observed (figure 1
b). This plume occupies a clearly defined cone shape, which aligns with that predicted by (3.1). Figure 1(h) shows the vertical profiles of vertical velocity and buoyancy measured along the centre of the plume,
 $W(z)$
and
 $B(z)$
, both of which decrease as the plume rises and align with (3.2) and (3.3).
Note that
 $W(z)$
and
 $B(z)$
become singular at
 $z=0$
, indicating that the MTT model is invalid near the source, as the source cannot be treated as a point there. For a circular source with finite area, the point plume assumption and the MTT model have been shown to be valid only when
 $z\gt 24r_{ { s}}$
(Fernando et al. Reference Fernando, Chen and Ayotte1998). In our results, the invalid region is highlighted in grey in figure 1(h). Within this region, our simulation results indeed depart notably from the MTT prediction. Specifically,
 $W(z)$
is observed to be zero near the bottom due to boundary effects, whereas the theoretical prediction is infinite.
3.2. Stage-2: rotation-dominated cylindrical plume
As the plume evolves, rotational effects become significant, deflecting the originally radial inflow to generate a rim current around the plume. This process limits the volume of fluid that can be entrained, as fluid farther away is blocked from entering the plume, which effectively inhibits lateral material/buoyancy exchange between the plume and the ambient fluid. Therefore, the radius of the plume remains almost constant, as can be seen in stage-2 in figure 1(a). The rim current speed is such that it is in thermal wind balance with the buoyancy contrast inside and outside the plume (Legg, Jones & Visbeck Reference Legg, Jones and Visbeck1996; Fernando et al. Reference Fernando, Chen and Ayotte1998; Goodman et al. Reference Goodman, Collins, Marshall and Pierrehumbert2004).
In this stage, the external parameters that determine the plume are
 $F_0$
and
 $f$
, which can be combined into
 $L_{ \!\textit{ rot}}^p$
(see (2.1)). When the plume is
 $O(L_{ \!\textit{ rot}}^p)$
away from the source, the Rossby number
 $Ro\equiv {W}/{fR}$
drops below unity, demarcating the transition from the non-rotating to the rotating regime (Ma et al. Reference Ma, Flynn and Sutherland2020). Following Fernando et al. (Reference Fernando, Chen and Ayotte1998) and Goodman et al. (Reference Goodman, Collins, Marshall and Pierrehumbert2004), the transitional height
 $h_{ { c}}$
and the radius of the cylinder
 $r_{ { c}}$
follow
 \begin{align} h_{ { c}}&\approx 6.0L_{ \!\textit{ rot}}^p, \end{align}
 \begin{align} r_{ { c}}&\approx 0.7L_{ \!\textit{ rot}}^p. \end{align}
Within the plume, the vertical velocity and buoyancy are nearly homogeneous and remain constant as the plume rises. They can be estimated from the MTT solution at
 $z=h_{ { c}}$
:
 \begin{align} w_{ { c}}&\approx \frac {\mu (h_{ { c}})}{\unicode{x03C0} r_{ { c}}^2}\approx 2.2L_{ \!\textit{ rot}}^pf, \end{align}
 \begin{align} b_{ { c}}&\approx \frac {F_0}{\mu (h_{ { c}})}\approx 0.3L_{ \!\textit{ rot}}^pf^2. \end{align}
These scaling laws are found to align with previous lab experiments (Fernando et al. Reference Fernando, Chen and Ayotte1998; Goodman et al. Reference Goodman, Collins, Marshall and Pierrehumbert2004) and numerical simulations (Goodman & Lenferink Reference Goodman and Lenferink2012).
Figure 1(c) shows a snapshot at
 $t=9f^{-1}$
(where
 $t=4\unicode{x03C0} f^{-1}$
corresponds to one rotation period) in the reference simulation. Below the level of
 $z=6L_{ \!\textit{ rot}}^p$
, the plume retains a conical shape. However, above this level, the plume is strongly influenced by rotation, taking on a cylindrical shape with radius approximately
 $1.2L_{ \!\textit{ rot}}^p$
. This shape aligns with the predictions of (3.6) and (3.7), as indicated by the black dashed lines. The slight discrepancy in plume radius may result from the modification of the entrainment coefficient by rotation. In the cylindrical region, vertical velocity and buoyancy become well mixed both horizontally and vertically, broadly matching the theoretical values given by (3.8) and (3.9), as shown in figure 1(i).
However, this stage is short-lived for two reasons. First, the plume near the source exhibits more complex dynamics. It may re-enter a laminar state due to the suppression of turbulence by rotation (Sutherland et al. Reference Sutherland2021), or it may be quickly deflected from the vertical, beginning to precess and oscillate due to the adverse pressure gradient encountered in the rotating environment (Frank et al. Reference Frank, Landel, Dalziel and Linden2017; Ma et al. Reference Ma, Flynn and Sutherland2020; Sutherland et al. Reference Sutherland2021; see also supplementary figure S3). This leads to meandering and expansion of the cylindrical plume above. Second, BCI develops, with baroclinic eddies mixing the plume with the surrounding fluid, further driving lateral expansion, as discussed in the next subsection.
3.3. Stage-3: destabilised plume
The rotation-governed cylindrical plume becomes unstable due to barotropic or baroclinic instabilities (of the rim current), in line with Kang et al. (Reference Kang, Marshall, Mittal and Bire2022a
) and Bire et al. (Reference Bire, Mittal, Kang, Ramadhan, Tuckman, German, Thurnherr and Marshall2023). After that, the plume will expand horizontally, as eddies scatter the plume fluid into the surrounding environment (stage-3 in figure 1
a). In our simulations, the destabilisation of the cylindrical plume is observed, as the plume spreads horizontally throughout the domain, with its horizontal extent far exceeding
 $r_{ { c}}$
(figure 1
d,g), and its vertical velocity and buoyancy substantially decreasing (figure 1
j).
Evolution of (a) the plume height
 $h_{ { p}}$
and (b) the width
 $d_{ { p}}$
in the series of simulations labelled Sim-free in table 1. The time
 $t$
is scaled by
 $f^{-1}$
, and
 $h_{ { p}}$
and
 $d_{ { p}}$
are scaled by
 $L_{ \!\textit{ rot}}^p$
. In (a), the black dashed line and the grey region represent (3.10). In (b), the black dashed line represents the scaling
 $(\kern1.5pt \textit{ft})^{1/2}$
.

In the simulations listed in table 1, the destabilised plumes eventually stop growing in height, despite the absence of stratification. Figure 2(a) shows the evolution of plume height for cases in Sim-free, and it is clear that all plumes plateau at a final height
 $h_{ \!{ f}}$
:
 \begin{equation} h_{ \!{ f}}\approx (55\pm 5)L_{ \!\textit{ rot}}^p, \end{equation}
which scales with
 $L_{ \!\textit{ rot}}^p$
. This plateau occurs around
 $t=100f^{-1}$
, and from then on, the plumes only expand laterally, following
 $d_{ { p}}\sim L_{ \!\textit{ rot}}^p(\kern1.5pt \textit{ft})^{1/2}$
as shown in figure 2(b). This phenomenon has also been observed in a fast-rotating (
 $Ro^{*p}=1/59$
) tank experiment conducted by Goodman et al. (Reference Goodman, Collins, Marshall and Pierrehumbert2004), and in numerical simulations for very deep subsurface oceans in icy worlds performed by Kang et al. (Reference Kang, Marshall, Mittal and Bire2022a
) and Bire et al. (Reference Bire, Mittal, Kang, Ramadhan, Tuckman, German, Thurnherr and Marshall2023). The breakdown of concentrated plumes is particularly important for icy worlds, as it dictates whether heat and materials from the vent can be transported to the ice shell without significant dilution.
Here, we propose a physical explanation for the destabilisation. Inspired by Brickman (Reference Brickman1995), Legg et al. (Reference Legg, Jones and Visbeck1996) and Visbeck, Marshall & Jones (Reference Visbeck, Marshall and Jones1996), we hypothesise that the plume will stop growing when the lateral buoyancy scattering by eddies balances out the buoyancy injection from the source:
 \begin{equation} \int _0^{h_{ \!{ f}}}\overline {u'b'}\times2\unicode{x03C0} r\mathrm{d}z=F_0. \end{equation}
Here,
 $r$
is the radius of the expanded plume,
 $u'$
is the radial eddy velocity,
 $b'$
is the buoyancy perturbation, and
 $\overline {({\cdot })}$
denotes azimuthal averaging. By definition,
 $\overline {u'}=0$
and
 $\overline {b'}=0$
, but
 $\overline {u'b'}$
is non-zero because
 $u'$
and
 $b'$
are correlated. Following Legg et al. (Reference Legg, Jones and Visbeck1996), we estimate this lateral eddy buoyancy flux as
 $u^* \Delta b$
, where
 $u^*$
is the root mean square of
 $u'$
, and
 $\varDelta b$
is the buoyancy contrast between the plume and environment (equal to the buoyancy within the plume
 $b_{ { p}}$
). Therefore, to estimate this eddy flux, we need scales for
 $u^*$
and
 $b_{ { p}}$
. According to the linear instability approach pioneered by Eady (Reference Eady1949) and Stone (Reference Stone1972), and later applied by Legg et al. (Reference Legg, Jones and Visbeck1996) to plumes, we estimate that
 $u^*$
scales with the rim current speed
 $U_{ \textit{rim}}$
as
 \begin{equation} u^*=\gamma U_{ \textit{rim}}, \end{equation}
where
 $\gamma$
is a constant coefficient. The rim current speed
 $U_{ \textit{rim}}$
can be related to
 $b_{ { p}}$
through the thermal wind balance (see supplementary figure S4):
 \begin{equation} \frac {\partial U_{ \textit{rim}}}{\partial z}=-\frac {1}{f}\frac {\partial b}{\partial r}\ \Rightarrow \ U_{ \textit{rim}}=\frac {zb_{ { p}}}{\textit{fr}}. \end{equation}
For
 $b_{ { p}}$
, we assume that it is well mixed within the plume, and is diluted from
 $b_{ { c}}$
due to the plume expansion (e.g. figure 1
d,g,j). Thus it can be scaled as
 \begin{equation} b_{ { p}}=CL_{ \!\textit{ rot}}^pf^2, \end{equation}
where
 $C=0.3r_{ { c}}^2/r^2$
. Here, we have used (3.9). Substituting all equations into the buoyancy budget (3.11), we obtain
 \begin{equation} h_{ \!{ f}}=\frac {1}{\sqrt {\unicode{x03C0} \gamma }\,C}L_{ \!\textit{ rot}}^p. \end{equation}
From numerical simulations, Legg et al. (Reference Legg, Jones and Visbeck1996) estimated
 $\gamma \approx 0.25$
for plumes in an unstratified environment. Also, in our simulations, the plume radius is approximately
 $1.2L_{ \!\textit{ rot}}^p$
during the early cylindrical stage, and expands to approximately
 $5L_{ \!\textit{ rot}}^p$
when it begins to stop ascending (figure 2
b), giving
 $C\approx 0.02$
. Substituting these values into (3.15) yields
 \begin{equation} h_{ \!{ f}}\approx 60L_{ \!\textit{ rot}}^p, \end{equation}
which quantitatively agrees with the measurements in our simulations.
In addition, since
 $\overline {u'}=0$
, there is no net lateral eddy volume flux, so the volume of the plume
 $V_{ { p}}$
can be estimated as
 \begin{equation} V_{ { p}}=\mu (\kern1.5pt \textit{ft})t=\widehat {\mu }(\kern1.5pt \textit{ft}) \big(L_{ \!\textit{ rot}}^p \big)^3ft, \end{equation}
where
 $\mu (\kern1.5pt \textit{ft})$
(with dimensionless form
 $\widehat {\mu }$
) represents the volume flux entrained during the MTT stage (stage-1), which remains a constant after the plume enters stage-2. This rate scales with
 $(L_{ \!\textit{ rot}}^p)^3 f$
as this is the only way to construct a physical variable with unit m
 $^3$
s
 $^{-1}$
. Noticing that after plume height plateaus, the plume volume can be expressed as
 $d_{ { p}}^2h_{ \!{ f}}$
, a scaling for
 $d_p$
can be obtained:
 \begin{equation} d_{ { p}}^2L_{ \!\textit{ rot}}^p\sim (L_{ \!\textit{ rot}}^p)^3 \textit{ft}\quad \Rightarrow \quad\frac {d_{ { p}}}{L_{ \!\textit{ rot}}^p}\sim (\kern1.5pt \textit{ft})^{\frac{1}{2}}, \end{equation}
which is consistent with the evolution of
 $d_{ { p}}$
shown in figure 2(b).
3.4. Sensitivity test
In our simulations, due to computational limitations, turbulent energy dissipates at the grid scale, which is significantly larger than the Kolmogorov scale. This may influence the growth of turbulent plumes. To assess whether and to what extent the model resolution affects our conclusions, we perform a mesh sensitivity study in this subsection. We vary
 $\widehat {\varDelta }_h$
and
 $\widehat {\varDelta }_z$
in a series of simulations labelled Sim-res in table 1. This variation effectively modifies the diffusivity and viscosity while maintaining a fixed resolution.
Middle row: final penetration height
 $h_{ \!{ f}}$
on meshes with different dimensionless (vertical) resolutions in simulations labelled Sim-refine and Sim-res in table 1. As a comparison, the resolution ranges in Sim-free (blue), Sim-wall (green) and Sim-surf (red) are marked on the
 $x$
-axis. Data points represent the average over the time interval from
 $ft=100$
to
 $ft=200$
, with error bars indicating the maximum and minimum values within this interval. The black dashed line and grey shading represent
 $(55\pm 5)L_{ \!\textit{ rot}}^p$
. Upper and lower rows: side views of the plume shape during its evolution in simulations Sim-res-4 and Sim-refine, respectively. In the lower row, grey shading covers the region out of the domain. Several insets are included. Theoretical geometry predictions (if they exist) are represented by dashed curves.

Lower resolution delays the onset of KHI and overestimates the height at which the plume transitions to a turbulent state, as illustrated in figure 3. Initially, the plume remains laminar due to the low Reynolds number
 $\textit{Re}$
, then it transits to the turbulent state as
 $\textit{Re}$
increases. This transition, induced by KHI, has been observed in previous laboratory experiments (e.g. Kitamura & Sumita Reference Kitamura and Sumita2011), simulations by general circulation models (e.g. Goodman & Lenferink Reference Goodman and Lenferink2012), and direct numerical simulations (e.g. Ward Reference Ward2022). The critical height and time for this transition are found to scale with
 \begin{equation} L_{\kappa }\equiv \left (\frac {\kappa ^3}{F_0}\right )^{\frac{1}{2}}\!,\quad t_{\kappa }\equiv \frac {\kappa ^2}{F_0}, \end{equation}
where
 $\kappa$
is the diffusivity (Ward Reference Ward2022). In low-resolution simulations, turbulent energy dissipates at larger scales, leading to larger effective
 $\kappa$
. This delays the onset of KHI and allows the laminar plume to penetrate to higher heights, potentially exceeding
 $h_{ { c}}$
(top left panel in figure 3). Consequently, the MTT stage does not emerge, and the plume transits directly into a rotationally dominant cylinder (top right panel in figure 3). As resolution increases, smaller-scale turbulence is better resolved, leading to an earlier onset of KHI and the transition to the turbulent plume. This allows the MTT stage to develop and be captured accurately (lower row in figure 3).
Furthermore, lower resolution overestimates the final penetration height
 $h_{ \!{ f}}$
, as shown in the middle row of figure 3. This is because the laminar plume in the earlier stage penetrates too high (top left panel in figure 3). Additionally, a lower-resolution mesh has a reduced ability to resolve small-scale baroclinic eddies, leading to an underestimate of lateral eddy buoyancy flux, which also contributes to a higher penetration height. As the resolution increases,
 $h_{ \!{ f}}$
converges to approximately
 $55L_{ \!\textit{ rot}}^p$
, demonstrating that the mesh adopted before with
 $\widehat {\varDelta }_h=\widehat {\varDelta }_z=0.1$
is sufficient to capture the destabilised plume induced by BCI, while minimising the influence of variations in the onset time of KHI. Consequently, the measured
 $h_{ \!{ f}}$
in (3.10) is robust.
We also adopt different domain extents
 $\widehat {L}$
and
 $\widehat {H}$
in Sim-refine, Sim-free-8, Sim-free-9 and Sim-res-1. The similar plume evolution and
 $h_{ \!{ f}}$
shown in figure 2 demonstrate that these domain sizes are sufficient to ensure that the plume is not influenced by boundaries.
4. Development of a constrained point plume by boundaries
In this section, we investigate the development of point plumes constrained by domain boundaries, with a particular focus on plume patterns upon encountering the upper boundary. The upper boundary represents either a free surface or an ice shell that covers lakes or oceans. With the horizontally periodic domain, we represent an array of infinity point plumes that may interact with each other during their development. The domain width thus corresponds to the distance between two point sources.
Parameter diagram for constrained plumes by boundaries (central panel) and simulated plume structures represented by isosurfaces of buoyancy (surrounding panels). The
 $x$
- and
 $y$
-axes are natural Rossby number for point plumes
 $Ro^{*p}$
, and domain aspect ratio
 $\varGamma$
, respectively. Data from this paper (tables 1 and 2), Fernando et al. (Reference Fernando, Chen and Ayotte1998), labelled FCA98, Goodman et al. (Reference Goodman, Collins, Marshall and Pierrehumbert2004), labelled GD+04, Goodman & Lenferink (Reference Goodman and Lenferink2012), labelled G&L12, Frank et al. (Reference Frank, Landel, Dalziel and Linden2017), labelled Fk+17, Ma et al. (Reference Ma, Flynn and Sutherland2020), labelled Ma+20, and Bire et al. (Reference Bire, Mittal, Kang, Ramadhan, Tuckman, German, Thurnherr and Marshall2023), labelled Bire+23, are plotted. Data points are colour-coded according to the four identified regimes, with each regime represented by a distinct colour: red indicates regime I (lateral-constrained regime); yellow indicates regime II (top-constrained, non-rotating regime); green indicates regime III (top-constrained, rotating regime); blue indicates regime IV (unstable regime). Boundaries for the four regimes are obtained from (3.1), (3.6), (3.7) and (3.10). Parameter regimes for Earth, Europa and the south pole of Enceladus are indicated by black arrows along the upper
 $x$
-axis.

Here, the parameters that determine the dynamics of the plume are
 $L,H,L_{ \!\textit{ rot}}^p$
, which are combined into
 $\varGamma$
and
 $Ro^{*p}$
(see (2.3)). In the parameter space spanned by these two non-dimensional numbers, we identify the following four regimes (figure 4).
-
(i) lateral-constrained regime. The domain is too narrow to fit either the non-rotating conical plume, i.e.
 $\varGamma \lt 0.22$
(see (3.1)), or the rotation-dominated cylindrical plume, i.e.
$\varGamma \lt 1.4Ro^{*p}$
(see (3.7)). In this regime, the plume will encounter the lateral boundary and become well mixed, so that it cannot remain concentrated when reaching the top boundary.
-
(ii) top-constrained, non-rotating regime. The domain is shallow, so the plume will encounter the top boundary as a cone without being influenced by rotation, i.e.
$Ro^{*p}\gt 1/6$
(see (3.6)). However, it is wide enough to fit this conical plume, i.e.
$\varGamma \gt 0.22$
(see (3.1)). In this regime, the plume remains concentrated upon impacting the upper boundary. -
(iii) top-constrained, rotating regime. The rotation is sufficiently fast to constrain the plume into a cylinder before it reaches the top boundary, i.e.
$Ro^{*p}\lt 1/6$
(see (3.6)). In addition, the domain is wide enough to fit this cylindrical plume, i.e.
$\varGamma \gt 1.4Ro^{*p}$
(see (3.7)). In this regime, the plume remains cylindrical and concentrated upon impacting the upper boundary. -
(iv) unstable regime. Strongly rotating plumes whose final penetration depth
$h_{ \!{ f}}$
is smaller than domain depth, i.e.
$Ro^{*p}\lt 1/55$
(see (3.10)), in a wide enough domain to fit the cylindrical plume, i.e.
$\varGamma \gt 1.4Ro^{*p}$
(see (3.7)), will become unstable before encountering the upper surface. In this regime, the pattern of the buoyancy source is not maintained.


We plot the numerical results from this study (tables 1 and 2) as well as laboratory and numerical results from previous studies with similar configurations (see the supplementary material; Fernando et al. Reference Fernando, Chen and Ayotte1998; Goodman et al. Reference Goodman, Collins, Marshall and Pierrehumbert2004; Goodman & Lenferink Reference Goodman and Lenferink2012; Frank et al. Reference Frank, Landel, Dalziel and Linden2017; Ma et al. Reference Ma, Flynn and Sutherland2020; Bire et al. Reference Bire, Mittal, Kang, Ramadhan, Tuckman, German, Thurnherr and Marshall2023). To classify the regimes that the plumes in our simulations belong to, we track the evolution of both plume height
 $h_{ { p}}$
and width
 $d_{ { p}}$
(same as figure 2), and determine whether the plume first encounters the top or lateral boundary. In the former case, we inspect the plume morphology at the time of impact to determine whether it forms a cone (belongs to regime II) or a cylinder (belongs to regime III). In the latter case, we measure the growth rate of
 $h_{ { p}}$
(i.e. the slope in figure 2
a) at the time of lateral impact, to judge whether the plume has already stopped rising (belongs to regime IV) or not (belongs to regime I). For previous studies, regime classification is based solely on qualitative analysis of plume morphology from published figures or textual descriptions. Each data point is colour-coded according to its plume regime, and the same colour scheme is used to distinguish the four regimes, allowing easy comparison between scaling prediction and numerical simulations.
Overall, the plume behaviours match with scaling prediction, as can be seen in figure 4. The mismatch near the boundary between regimes I and III or IV (Sim-surf-13 and Sim-surf-14) arises because the cylindrical plume is deflected due to precession, causing it to reach the lateral boundaries sooner than expected. Note that although we have made every effort to conduct extensive numerical simulations and gather data from existing literature, our exploration of the two-dimensional parameter space remains incomplete. Therefore, we do not rule out the possibility that unexpected behaviour may emerge in unexplored regions of the parameter space.
4.1. Lateral-constrained regime
To investigate the plume pattern that will first encounter lateral boundaries (equivalent to interactions with other plumes), we carried out six simulations that satisfy the criterion for the lateral-constrained regime, labelled Sim-wall in table 2. The plumes in these simulations exhibit similar behaviour (bottom right panels in figure 4).
Snapshots of
 $b/b_{s}$
at different time steps in Sim-wall-5 are illustrated in figure 5. The plume is found to encounter the lateral boundaries at
 $z\approx 4L_{ \!\textit{ rot}}^p$
, consistent with the prediction of MTT. Thereafter, the plume merges with adjacent plumes and becomes horizontally well mixed. This indicates that fluid above this level only ‘sees’ a uniformly distributed buoyancy flux, regardless of the buoyancy flux pattern at the bottom. Over time, these plumes first fill the lower part of the domain with high-buoyancy fluid. This occurs because the plume’s upwelling must be balanced by surrounding downwelling. After plumes fill the horizontal extent of the domain, the compensating downward motions occur near the domain side walls, pushing high-buoyancy fluid. This behaviour resembles the ‘filling-box’ effect described by Baines & Turner (Reference Baines and Turner1969) and Turner (Reference Turner1969). Only after the lower domain becomes well mixed does the high-buoyancy fluid begin to fill the upper domain.
4.2. Top-constrained regimes
To investigate the plume pattern that will first encounter the top boundary, we conduct a series of simulations labelled Sim-surf in table 2, which include both weakly rotating cases (Sim-surf-1 to Sim-surf-6) and strongly rotating cases (Sim-surf-7 to Sim-surf-12).


If
 $Ro^{*p}\gt 1/6$
, then rotation has no effect on the rising plume, so the plume maintains the cone shape predicted by the MTT model (3.1) until it meets the upper boundary, as shown in figures 6(a) and 6(d). After that, the buoyant fluid spreads horizontally in appearance of radial gravity currents along the top boundary, forming an anvil layer (figure 6
b,e). This behaviour is similarly reported in tank experiments by Fernando et al. (Reference Fernando, Chen and Ayotte1998). Eventually, if the domain is relatively narrow, the plume will fill the plane and be pushed downwards under the influence of the ‘filling-box’ effect discussed in § 4.1 (figure 6
c,f). In contrast, when sufficient horizontal space is available, the radial gravity currents will eventually be influenced by rotation, deflecting and forming anticyclonic flows around a confined plume, consistent with the phenomena reported by Ma et al. (Reference Ma, Flynn and Sutherland2020) and Bire et al. (Reference Bire, Mittal, Kang, Ramadhan, Tuckman, German, Thurnherr and Marshall2023).
Instantaneous views of dimensionless buoyancy
 $b/b_{s}$
(colour shading) and horizontal flows (vectors) in the simulation Sim-surf-2 in table 2: (a–c)
 $x{-}z$
cross-sections along blue dash-dotted lines in (d–f); (d–f)
 $x{-}y$
cross-sections at the top. Theoretical geometry predictions (if they exist) are represented by black dashed lines. To better illustrate the plume structure, the threshold is adjusted to
 $10^{-4}$
.

If
 $Ro^{*p}\lt 1/6$
, then rotation would have already started to modulate the plume before encountering the top boundary. As demonstrated in Goodman et al. (Reference Goodman, Collins, Marshall and Pierrehumbert2004), in this case, the plume undergoes the first two stages sketched in figure 1(a), and impacts the upper boundary as a cylindrical plume, generating anticyclonic flows (figure 7
a,b,e). Then the cylindrical plume expands outwards by virtue of mass conservation. However, in a rotational system, the range that the outward flow can reach is limited through the onset of a rim current. As a result, plume fluid accumulates near the top boundary, causing the cylindrical plume to evolve into a baroclinic cone (figure 7
a,c,f). The diameter of the cone scales with
 $L_{ { cone}}=\sqrt {b'H}/f\sim L_{ \!\textit{ rot}}^p/\sqrt {Ro^{*p}}$
(Fernando et al. Reference Fernando, Chen and Ayotte1998; Goodman et al. Reference Goodman, Collins, Marshall and Pierrehumbert2004; Goodman & Lenferink Reference Goodman and Lenferink2012), which is the Rossby deformation radius for a two-layer fluid (Pedlosky Reference Pedlosky1987). We validated this cone scaling (see supplementary figure S5). Finally, due to BCI, the primary cone breaks down into multiple secondary conical vortices (two vortices in figure 7
d,g). The numbers of these vortices can be estimated using a ‘heton’ model, as shown by Legg & Marshall (Reference Legg and Marshall1993) and Legg et al. (Reference Legg, Jones and Visbeck1996).
Development of a rotating plume after encountering the top boundary. (a) Diagram of three stages during a plume’s growth. (b–g) Same as figure 6 but for the simulation Sim-surf-9 in table 2. In (a),
 $l$
is the diameter of the conical plume in stage-2. To better illustrate the plume structure, the threshold is adjusted to
 $10^{-4}$
.

5. Effect of finite source size
When the source size exceeds the size of the plume characterised by the rotational length scale
 $L_{ \!\textit{ rot}}^p$
, i.e.
 $\widehat {r}_{ { s}}\gtrsim 1$
, the source can no longer be treated as a geometric point, but is rather a circular region with finite area. This scenario is analogous to convection driven by a wide-range buoyancy source in laboratory experiments (Maxworthy & Narimousa Reference Maxworthy and Narimousa1994; Brickman Reference Brickman1995; Narimousa Reference Narimousa1997) and open ocean convection on Earth (Jones & Marshall Reference Jones and Marshall1993; Send & Marshall Reference Send and Marshall1995; Legg et al. Reference Legg, Jones and Visbeck1996; Visbeck et al. Reference Visbeck, Marshall and Jones1996).
Evolution of the plume height
 $h_{ { p}}$
scaled by (a)
 $L_{ \!\textit{ rot}}^p$
and (b)
 $L_{ \!\textit{ rot}}^a$
, and the plume width scaled by (c)
 $L_{ \!\textit{ rot}}^p$
and (d) initial width
 $d_{ { p0}}$
, respectively. Coloured circles mark the onset time at which the increase in
 $h_{ { p}}$
slows significantly, while the increase in
 $d_{ { p}}$
quickens. Coloured squares represent
 $d_{ { p0}}$
predicted by theory. The black dashed line and grey shading in (a) represent
 $(55\pm 5)L_{ \!\textit{ rot}}^p$
. The black dashed line in (c) represents
 $\sim \! (\kern1.5pt \textit{ft})^{1/2}$
. (e–g) Side views of the plume shape during its evolution in the simulation with
 $\widehat {r}_{ { s}}=3$
(green curve in (a–d)). Blue triangles mark the initial plume boundaries.

With the domain size fixed at
 $\widehat {L}=50$
and
 $\widehat {H}=100$
, and the resolution set to
 $\widehat {\varDelta }_h=\widehat {\varDelta }_z=0.1$
, we conduct simulations with different source radii,
 $\widehat {r}_{ { s}}=2$
,
 $3$
,
 $4$
and
 $5$
. Since the source radius
 $r_{ { s}}$
is larger than the columnar plume radius
 $r_{ { c}}$
, the buoyant fluid emanating from the source has an almost Gaussian-like envelope (figure 8
e), following the buoyancy flux prescribed at the bottom. Subsequently, the plume forms a cylindrical shape with a radius covering the majority of the source (figure 8
f). This cylinder then expands laterally (figure 8
g) and eventually causes plume height to plateau at
 $h_{ \!{ f}}\sim 60L_{ \!\textit{ rot}}^p$
(figure 8
a), similar to that for point plumes.
It is also evident from figure 8(a) that although the final states of the plumes forced by heat sources of different sizes are similar to each other, the plume height evolutions during their early stages diverge (to the left of the circles in figure 8
a). As the heat source widens, the plume rises at a slower rate initially. This is because a larger
 $\widehat {r}_{ { s}}$
results in a smaller buoyancy flux per unit area, which now primarily governs plume dynamics rather than the total buoyancy flux. Consequently, when non-dimensionalised by
 $L_{ \!\textit{ rot}}^a$
(see (2.4)), the early evolution of the plume height from simulations with different
 $\widehat {r}_{ { s}}$
collapses into one line (to the left of the circles in figure 8
b). Although the initial development of the plume diverges from the
 $L_{ \!\textit{ rot}}^p$
scaling, it does not carry over to the final stage, which sets the penetration height
 $h_{ \!{ f}}$
. This is because in all of our simulations, the cylindrical plume is already wide enough to cover the entire buoyancy source before reaching
 $h_{ \!{ f}}$
(figure 8
f). Then the argument that determines the penetration height of the point plume would also apply here, leading to a similar
 $h_{ \!{ f}}$
.
We also present the evolution of plume width
 $d_{ { p}}$
scaled by
 $L_{ \!\textit{ rot}}^p$
in figure 8(c). During the early development,
 $d_{ { p}}$
is set at the point where buoyancy drops to 0.1 % of the peak value, i.e.
 $\exp({-d_{ { p0}}^2/4r_{ { s}}^2})=0.001$
. This
 $d_{ { p0}}$
is presented in figure 8(c) using filled squares. Subsequently,
 $d_{ { p}}$
slowly increase through diffusion until BCI kicks in. During this stage, the evolution of
 $d_{ { p}}/d_{ { p0}}$
with dimensionless time
 $ft$
collapses into one line (figure 8
d). After plume width grows beyond
 $d_{ { p0}}$
under the influence of BCI, the plume width
 $d_{ { p}}$
follows the power law
 $(\kern1.5pt \textit{ft})^{1/2}$
, just like stage-3 of a point plume. The turning point that demarcates the diffusion-dominated lateral growth and eddy-dominated lateral growth coincides with the turning point for
 $h_{ { p}}$
to transit from following
 $L_{ \!\textit{ rot}}^a$
to following
 $L_{ \!\textit{ rot}}^p$
(indicated by circles in figures 8
a–d).
6. Summary and discussion
In this study, we investigate rotating plumes in an unstratified environment that are generated by localised buoyant sources at the bottom. We start by considering a plume freely developing without interfering with lateral or top boundaries, then proceed to account for boundary effects, which allows us to determine under which conditions the pattern of buoyancy source can project onto the upper surface.
A rotating point plume that grows freely generally undergoes three stages. In stage-1, with negligible rotation effect, the plume rises as a cone, accompanied by diluted upward velocity and buoyancy (figure 1 a,b,e,h). During this stage, its geometry and dynamics are well described by the MTT model ((3.1)–(3.3); Morton et al. Reference Morton, Taylor and Turner1956). In stage-2, rotation becomes important, and forces the plume into a cylindrical shape, within which both momentum and buoyancy are almost uniform (figure 1 a,c,f,i). The geometry and dynamics of this cylindrical plume follow the scaling laws (3.6)–(3.9); see also Fernando et al. (Reference Fernando, Chen and Ayotte1998) and Goodman et al. (Reference Goodman, Collins, Marshall and Pierrehumbert2004). In stage-3, the plume becomes barotropically or baroclinically unstable, leading to lateral loss of buoyancy through eddy transport, which hinders its upward penetration (figure 1 a,d,g,j).
We find that freely developed plumes cease to rise at height
 $h_{ \!{ f}}$
, as the total buoyancy flux released by the source is completely leaked to the ambient by lateral eddy flux (figure 2). Based on this point, we propose a scaling law
 \begin{equation} h_{ \!{ f}}\approx 55L_{ \!\textit{ rot}}^p. \end{equation}
Here,
 $L_{ \!\textit{ rot}}^p=(F_0f^{-3})^{{1}/{4}}$
represents the characteristic scale of a rotating plume that is larger than the source size, meaning that the source can be treated as a point. When the source size exceeds the plume scale, the source should be treated as a circular area. The early evolution of the plume is then mainly determined by the buoyancy flux per unit area, which leads to the relevant rotational length scale
 $L_{ \!\textit{ rot}}^a=(F_0f^{-3}r_{ { s}}^{-2})^{{1}/{2}}$
. However, the final penetration height
 $h_{ \!{ f}}$
is close to that of point plumes, since its lateral extent is wider than the source, which means that the majority of
 $F_0$
is contained within the plume (figure 8).
Taking into account the constraints imposed by the boundaries, the evolution of plumes largely depends on their geometry upon encountering these boundaries. We identify four regimes in the non-dimensional parameter space defined by the domain aspect ratio
 $\varGamma =L/H$
and the natural Rossby number for point plumes
 $Ro^{*p}=L_{ \!\textit{ rot}}^p/H$
, summarised in figure 4. Only in two top-constrained regimes is the pattern of the bottom buoyancy flux preserved when the upper surface is impacted.
In deep convective regions of the Earth’s ocean in winter (such as the Gulf of Lions and the Greenland seas), the heat lost to the atmosphere can reach up to 800 W m
 $^{-2}$
and persist for tens of days, corresponding to buoyancy flux per unit area ranging from
 $10^{-8}$
to
 $10^{-7}$
m
 $^2$
s
 $^{-3}$
(Jones & Marshall Reference Jones and Marshall1993; Marshall & Schott Reference Marshall and Schott1999). The plumes generated in these regions have horizontal scales ranging from several hundred metres to one kilometre, corresponding to
 $h_{ \!{ f}}$
greater than 6 km (see (3.10)), which is double the mean depth of the ocean. As a result, the dense cold water can easily descend to the sea floor, forming deep water masses (Jones & Marshall Reference Jones and Marshall1993; Send & Marshall Reference Send and Marshall1995). Furthermore, localised hydrothermal vents exhibit heat fluxes ranging from 1 MW to 10 GW (Thomson et al. Reference Thomson, Delaney, McDuff, Janecky and McClain1992), corresponding to total buoyancy fluxes ranging from
 $10^{-3}$
to 10 m
 $^4$
s
 $^{-3}$
. Plumes generated by such vents typically have scales greater than 100 m and can transport to the surface if the ocean is unstratified, as corresponding range of
 $Ro^{*p}$
shown by the black arrow in figure 4 lies in top-constrained regimes.
Icy satellites, such as Europa (the second moon of Jupiter) and Enceladus (the second moon of Saturn), have been found to host deep global subsurface oceans and exhibit ongoing geological activities (Anderson et al. Reference Anderson, Schubert, Jacobson, Lau, Moore and Sjogren1998; Hansen et al. Reference Hansen, Esposito, Stewart, Colwell, Hendrix, Pryor, Shemansky and West2006; Porco et al. Reference Porco2006; Collins & Goodman Reference Collins and Goodman2007). On Europa, the ocean may be 50–100 km deep (Goodman & Lenferink Reference Goodman and Lenferink2012), and the heat flux for hydrothermal systems is of the order of 0.1–10 GW (Lowell & DuBose Reference Lowell and DuBose2005; Goodman & Lenferink Reference Goodman and Lenferink2012). Using these values along with
 $g=1.3$
m s
 $^{-2}$
, a global-mean
 $f=1.3\times 10^{-5}$
s
 $^{-1}$
, and an estimate for thermal expansivity
 $\alpha =3\times 10^{-4}$
K
 $^{-1}$
(Goodman & Lenferink Reference Goodman and Lenferink2012), we estimate that
 $Ro^{*p}\leqslant 0.092$
(black arrow in figure 4), which suggests that the strongest possible plumes on Europa are able to encounter the ice shell. This aligns with the conclusions from the numerical simulations conducted for Europa by Goodman & Lenferink (Reference Goodman and Lenferink2012), two of which are repeated (Sim-surf-11 and Sim-surf-12) and are shown in the top left of figure 4. On Enceladus, the ocean may be 40 km deep (Thomas et al. Reference Thomas, Tajeddine, Tiscareno, Burns, Joseph, Loredo, Helfenstein and Porco2016), and the hydrothermal heat flux may range from
 $\lt$
0.1 GW following Vance & Goodman (Reference Vance and Goodman2009) to 5 GW following Choblet et al. (Reference Choblet, Tobie, Sotin, Běhounková, Čadek, Postberg and Souček2017). Using these values along with
 $g=0.1$
m s
 $^{-2}$
,
 $f=10^{-4}$
s
 $^{-1}$
in the polar region, and
 $\alpha =10^{-5}$
K
 $^{-1}$
(Bire et al. 2023), we estimate that
 $Ro^{*p}\leqslant 0.0047$
(black arrow in figure 4), suggesting that detecting the pattern of hydrothermal vents from the surface may be challenging. Nutrients and biosignatures emanated from the hydrothermal vents are likely well mixed when delivered to the water–ice interface, in line with Kang et al. (Reference Kang, Marshall, Mittal and Bire2022a
) and Bire et al. (Reference Bire, Mittal, Kang, Ramadhan, Tuckman, German, Thurnherr and Marshall2023). One of these cases, labelled Sim-repeat, is shown in the bottom left of figure 4.
While our theoretical framework provides a useful estimate for plume morphology, applying it to real-world settings requires accounting for additional physical processes. These include: heat loss at the top boundary, which may limit horizontal spreading; the finite array of point sources, which results in a merge process different from that in an infinite array (Yamamoto, Cenedese & Caulfield Reference Yamamoto, Cenedese and Caulfield2011; Li & Flynn Reference Li and Flynn2020); background currents that can bend and dilute plumes (Weil Reference Weil1988; Contini et al. Reference Contini, Donateo, Cesari and Robins2011); stratification that leads to terminal rise and lateral intrusion (Speer & Marshall Reference Speer and Marshall1995; Fabregat Tomàs et al. Reference Fabregat Tomàs, Poje, Özgökmen and Dewar2016); and planetary rotation effects, such as Taylor columns on icy moons, which can reorient plumes along the rotation axis (Ashkenazy & Tziperman Reference Ashkenazy and Tziperman2021; Zeng & Jansen Reference Zeng and Jansen2021; Bire et al. Reference Bire, Kang, Ramadhan, Campin and Marshall2022). Each of these factors may significantly alter plume behaviour from the idealised cases considered here.
Supplementary material
Supplementary material is available at https://doi.org/10.1017/jfm.2025.10533.
Acknowledgements
This project uses Oceananigans, an open-source ocean general circulation model. The authors thank A. Ramadhan, S. Silvestri, G.L. Wagner and X.K. Lee for technical support for Oceananigans, the MIT Satori Group for support with computing resources, and K. Gianchandni, P. Higgins and Y. Ma for helpful discussion.
Funding
W.K. acknowledges support from start-up funding. J.M. acknowledges support from NASA Astrobiology Grant 80NSSC19K1427 ‘Exploring Ocean World’.
Declaration of interests
The authors report no conflict of interest.
Data availability statement
Data supporting this work are available at https://doi.org/10.5281/zenodo.15571010.