

1. INTRODUCTION
In order to achieve a better understanding of the response of materials to extreme conditions, such as those existing in the interior of large planetary bodies or in hypervelocity impact among planetary materials, as well as in the case of inertial confinement fusion, it is essential to have knowledge of the equation of state (EOS) of the involved materials at the appropriate thermodynamic conditions (Bakshi et al., Reference Bakshi, Eliezer, Henis, Nissim, Perelmutter, Moreno, Sudai and Mond2009; Eliezer et al., Reference Eliezer, Ghatak and Hora2002). To be able to describe such physical events at a verity of different conditions, the entire pressure-temperature-volume range between the cold isotherm and principal Hugoniot must be considered. In the past, static and dynamic conditions of materials were extensively studied using diamond anvil cells (DACs) (Hemley, Reference Hemley2010) and shock wave techniques (Fortov & Lomonosov, Reference Fortov and Lomonosov2010), respectively. DAC's static high pressure experiments usually follows an isotherm at room temperature and are limited to pressures of up to about 5 Mbar (Popov, Reference Popov2010), when combined with laser heating techniques, the temperature can reach up to about 4000 K (Errandonea, Reference Errandonea2006). Dynamic shock measurements using gas gun facilities are limited to pressures of up to about 10 Mbar, while laser driven shocks can reach up to about 1000 Mbar (Fortov & Lomonosov, Reference Fortov and Lomonosov2010), both techniques are constrained to the principal Hugoniot curve. In shock wave experiments, it is not possible to control the temperature independently from the shock pressure; also, the compression is limited since above a certain value most of the shock energy is converted to heating the sample instead of compressing it.
One way of probing the thermodynamic region between the cold isotherm and the principal Hugoniot is by shocking a precompressed sample. Starting from an already compressed sample, higher final compression is reached than obtained by dynamic experiment with an uncompressed sample. Furthermore, by varying the experimental initial parameters the sample's final thermodynamic parameters can be controlled. In the last decade, a technique was developed in which the sample is precompressed inside a DAC and a high power laser is used in order to generate a shock in the sample (Henry et al., Reference Henry, Brygoo, Loubeyre, Koenig, Benuzzi-Mounaix, Ravasio and Vinci2006; Jeanloz et al., Reference Jeanloz, Celliers, Collins, Eggert, Lee, McWilliams, Brygoo and Loubeyre2007; Kimura et al., Lee et al., Reference Lee, Benedetti, Mackinnon, Hicks, Moon, Loubeyre, Occelli, Dewaele, Collins and Jeanloz2002; Loubeyre et al., Reference Loubeyre, Celliers, Hicks, Henry, Dewaele, Pasley, Eggert, Koenig, Occelli, Lee, Jeanloz, Neely, Benuzzi-Mounaix, Bradley, Bastea, Moon and Collins2004). Compressing the sample statically in a DAC prior to a dynamic laser driven shock experiment can increase the initial density of the sample sufficiently to bring the sample to final thermodynamic conditions unreachable by either static or single shock compression.
In a DAC, the sample is contained inside a hole drilled in a metal gasket that may also be filled with a pressure-transmitting fluid, the sample and gasket are then compressed with two opposing diamonds. The size of the sample in a DAC is typically 100–500 µm in diameter and 5–50 µm in thickness, such small dimensions are needed since the small area of the diamond anvil (culet) is what allows high pressure to be achieved. In a typical laser driven shock in a DAC experiment, the high power laser is focused at the outer surface of one of the diamond anvils (usually a thin layer of an ablator is applied to that surface), and the absorbed light vaporizes the outer surface of the diamond. A high pressure shock wave is then lunched into the diamond caused by both the rapid thermal pressure and the momentum balance of the ejected diamond vapor (rocket effect); this shock front propagates toward the sample. As the shock propagates toward the sample it is eroded constantly by the side rarefaction and ultimately also by back rarefaction that is launched at the end of the laser pulse. The thickness of the laser ablated diamond anvil is limited by both the side and back rarefaction waves. The catch-up distance between the back rarefaction and shock wave can be shown to be (Jeanloz et al., Reference Jeanloz, Celliers, Collins, Eggert, Lee, McWilliams, Brygoo and Loubeyre2007):
 $$\Delta X \approx {U_S^2 {\rm \tau} \over U_P} \sim \left(10^2 {\rm \mu} m/ns \right){\rm \tau}\comma \;$$
where U S is the velocity of the shock front, U P is the particle velocity, and τ is the laser pulse duration. The current state of the art high power lasers produces about PW/cm2 for a pulse duration of 1–2 ns and focused to a spot of about 500 µm. Therefore, at the current stage of the available laser facilities, the thickness of the ablated diamond is limited to a few hundred microns (Jeanloz et al., Reference Jeanloz, Celliers, Collins, Eggert, Lee, McWilliams, Brygoo and Loubeyre2007; Loubeyre et al., Reference Loubeyre, Celliers, Hicks, Henry, Dewaele, Pasley, Eggert, Koenig, Occelli, Lee, Jeanloz, Neely, Benuzzi-Mounaix, Bradley, Bastea, Moon and Collins2004). Past experiments using such thin diamond films as anvils were limited to static pressures of up to about 5 GPa (Eggert et al., Reference Eggert, Brygoo, Loubeyre, McWilliams, Celliers, Hicks, Boehly, Jeanloz and Collins2008; Henry et al., Reference Henry, Brygoo, Loubeyre, Koenig, Benuzzi-Mounaix, Ravasio and Vinci2006; Jeanloz et al., Reference Jeanloz, Celliers, Collins, Eggert, Lee, McWilliams, Brygoo and Loubeyre2007; Kimura et al., Reference Kimura, Ozaki, Okuchi, Terai, Sano, Shimizu, Sano, Koenig, Hirose, Kakeshita, Sakawa and Kodama2010; Lee et al., Reference Lee, Benedetti, Mackinnon, Hicks, Moon, Loubeyre, Occelli, Dewaele, Collins and Jeanloz2002; Loubeyre et al., Reference Loubeyre, Celliers, Hicks, Henry, Dewaele, Pasley, Eggert, Koenig, Occelli, Lee, Jeanloz, Neely, Benuzzi-Mounaix, Bradley, Bastea, Moon and Collins2004). In a shock experiment with a precompressed sample, the deviation of the final thermodynamic parameters from the principal Hugoniot is related to the extent of the relative initial compression, therefore, at such limited pressure range the experiment is restricted to either fluids that exhibit large compression at this pressure range or to solids which may exhibit large compression at this range through a phase transition. To the best of our knowledge until now only fluids were investigated using this technique (Henry et al., Reference Henry, Brygoo, Loubeyre, Koenig, Benuzzi-Mounaix, Ravasio and Vinci2006; Jeanloz et al., Reference Jeanloz, Celliers, Collins, Eggert, Lee, McWilliams, Brygoo and Loubeyre2007; Kimura et al., Reference Kimura, Ozaki, Okuchi, Terai, Sano, Shimizu, Sano, Koenig, Hirose, Kakeshita, Sakawa and Kodama2010; Lee et al., Reference Lee, Benedetti, Mackinnon, Hicks, Moon, Loubeyre, Occelli, Dewaele, Collins and Jeanloz2002; Loubeyre et al., Reference Loubeyre, Celliers, Hicks, Henry, Dewaele, Pasley, Eggert, Koenig, Occelli, Lee, Jeanloz, Neely, Benuzzi-Mounaix, Bradley, Bastea, Moon and Collins2004). Higher precompression pressure, in the range of Mbar for instance, will allow the investigation of solids and fluids that transformed to their high pressure metallic state prior to the shocked state (Hemley & Ashcroft, Reference Hemley and Ashcroft1998). Furthermore, such increase in the precompression pressure will allow exploring deeper into the interior of giant planets, for example, an increase from 1 to 100 GPa in the precompression pressure will allow to increase the probing range for the characteristics of Jupiter's envelope form about 5.9 to 63% by mass (Militzer & Hubbard, Reference Militzer and Hubbard2007). In order to achieve higher precompression pressure using a thicker anvil without diminishing the shock's energy, a much powerfull laser is needed. Such high power laser will have to produce PW/cm2 for a much longer pulse duration (to avoide back rarefaction degradation of the shock) and at a much wider spot (to avoide side rarefaction degradation of the shock).
In this paper, we propose an experimental setup that will allow EOS measurements of a shocked opaque solid material precompressed to pressures in the range of 50 GPa with the use of a partially perforated diamond anvil. The precompressed Hugoniot curves and the relative thermal pressure for different precompression pressures are calculated for Al.
2. THE PARTIALLY PERFORATED DIAMOND ANVIL
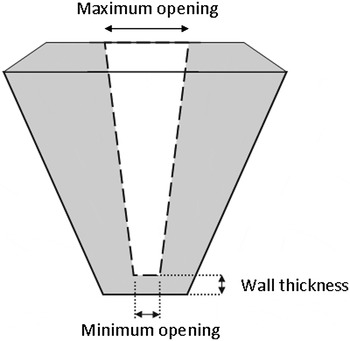
Partially perforated diamond anvils for high pressure research were first introduced by Bassett et al. (Reference Bassett, Anderson, Mayanovic and Chou2000) and Dadashev et al. (Reference Dadashev, Pasternak, Rozenberg and Taylor2001), mainly for reducing radiation absorption by the diamonds in X-ray diffraction and Mössbauer spectroscopy measurements. Usually, a conical hole is drilled through the diamond by a laser leaving a residual wall behind the culet, as can be seen in Figure. 1. The hole's maximum and minimum openings and the residual wall's thickness can be controlled by the laser beam properties. After the laser drilling the surface roughness of the minimum opening is typically 20 µm, making it opaque to visible light. Until now no successful attempt to polish this surface was reported. Working with partially perforated anvils with a residual wall of 500 µm, it was argued by Dadashev et al. (Reference Dadashev, Pasternak, Rozenberg and Taylor2001) that the partially perforated anvils exhibit mechanical behavior that is superior to regular anvils. Furthermore, it was shown by Soignard et al. (Reference Soignard, Benmore and Yarger2010) that partially perforated diamond anvils with a residual wall of 50–200 µm can hold pressures above 50 GPa. Such pressures are about an order of magnitude above the precompression pressures reported in the literature so far with the use of thin diamond films. In the light of these findings, we propose a scheme in which the drive laser that creates the shock is focused on the minimum opening of a partially perforated anvil. It is argued here that the superior mechanical properties of the perforated anvil relative to the conventional thin diamond plates will extend the reachable pressures and densities in two possible scenarios: (1) much higher precompression will be achieved for the same experimental parametersas reported in the literature. (2) For the same precompression pressures reported in the literature a much thinner diamond anvil will be needed, therefore, the laser's pulse duration can be shorter (limited by the back rerfaction) and the spot size can be smaller (limited by the side rerfaction), concluding in a net increase of the laser's energy flux and the shock pressure.
A scheme of a partially perforated diamond anvil.

3. A PROPOSED SETUP FOR OPAQUE SOLID SAMPLES
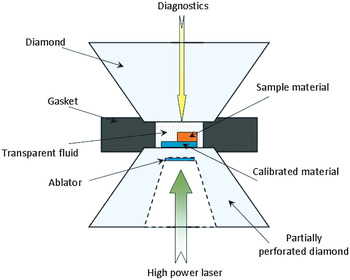
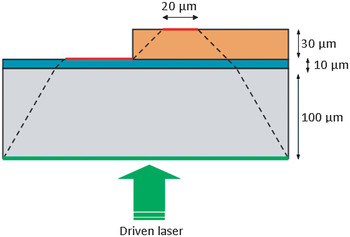
In Figure 2, the laser-driven shock experimental setup is presented. The high power laser is focused on an ablator located at the outer part of the residual wall in the partially perforated anvil, while the diagnostics are conducted from the other side of the sample volume through the regular diamond anvil. The setup presented in Figure 2 is designed for measuring the properties of an opaque sample material who's EOS is known up to the precompression pressure. The sample material is located on top of a “shock standard” material who's EOS is known in a wide thermodynamic range (Al for example (Evans et al., Reference Evans, Freeman, Graham, Horsfield, Rothman, Thomas and Tyrrell1996; Lomonosov, Reference Lomonosov2007; Pickard & Needs, Reference Pickard and Needs2010)) and the shock velocity through it was measured and calibrated to the driven laser parameters in a preliminary experiment. The rest of the sample volume is filled with a transparent fluid acting as a pressure medium for the precompression stage and as a window for the shock stage of the experiment. This configuration was chosen so that the analysis of the experimental results does not require the EOS of the transparent fluid, as will be explained later. In Figure 3, the shock propagation in the setup is presented. The measurement of the shock velocity through the sample is conducted by measuring the time delay between the shock's break through the “shock standard — transparent fluid” interface and the shock's break through the “sample — transparent fluid” interface. The height of the sample was chosen to be 30 µm and it allows an error of less than 1.5% in the shock velocity measurement for a typical 20 km/s shock using a 20 ps resolotion streak camera as diagnostics. The height of the shock standard was chosen arbitrarily to be 10 µm, although, a thinner shock standard allows for a thicker sample (for the same sample volume dimensions) and a more precise measurement of the shock velocity. The dashed lines in Figure 3 represents the side degradation of the shock from side rarefactions, the angle of the degradation was taken to be 30° in the diamond (Loubeyre et al., Reference Loubeyre, Celliers, Hicks, Henry, Dewaele, Pasley, Eggert, Koenig, Occelli, Lee, Jeanloz, Neely, Benuzzi-Mounaix, Bradley, Bastea, Moon and Collins2004) and 45° degrees in the rest of the materials. The driven laser spot size required in order to accept a 20 µm wide shock front at the back surface of the target material (to allow a reasonable spatial resolution for the diagnostics) was calculated for 100 µm and 50 µm diamond (residual wall) heights and was found to be 290 µm and 240 µm, respectively.
A proposed scheme for the measurement of an opaque solid sample.

A scheme of the shock transfer trough the diamond anvil and sample. The lower gray level is the diamond anvil, the middle blue level is the shock standard and the orange upper level is the sample. The lower horizontal line represents the diameter of the initial shock front and the dashed lines represents its degradation due do side rarefactions.

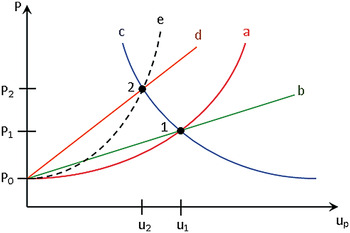
In Figure 4 the impedance matching schema is presented. The red line (curve a) represents the known Hugoniot curve of the shock standard, and the green line (curve b) represents the Rankine-Hugoniot relation of linear momentum conservation between the pressure and particle velocity (U P) for the shock standard (Eliezer, Reference Eliezer2001; Mitchell & Nellis, Reference Mitchell and Nellis1981; Zel'dovich et al., Reference Zel'dovich and Raizer2002):
 $$P_H - P_0 = {\rm \rho}_0 U_S U_P\comma \;$$
where P and ρ represents the pressure and density and the subscript H and 0 represents the Hugoniot shock-compressed state and the initial state, respectively. Since it is assumed that the shock velocity through the shock standard is known from a preliminary experiment and its initial density is known from its EOS, point 1 can be determined. As the shock crosses from the standard to the sample, the pressure in the standard either increases or decreases depending on whether it is less or more compressible than the sample, respectively. The case considered here is the former. Since the pressure and particle velocity are continuous at the interface, point 2 is determined from the intersection of the reflected shock Hugoniot curve of the standard (blue line, curve c) and the linear Hugoniot relation (2) for the sample (orange line, curve d), where the slope of curve d is determined from the measured shock velocity through the sample. Point 2 is a point on the Hugoniot curve of the sample represented by the black dashed curve (curve e). Once the pressure (P 2) and particle velocity (u 2) on the Hugoniot curve of the sample are known, the density of the sample can be calculated using the Rankine-Hugoniot relation of mass conservation (Eliezer, Reference Eliezer2001; Mitchell & Nellis, Reference Mitchell and Nellis1981; Zel'dovich et al., Reference Zel'dovich and Raizer2002):
 $${\rm \rho}_0 U_S = {\rm \rho}_H \lpar U_S - U_P\rpar.$$
A scheme of the impedance mismatch method. (a) The Hugoniot of the shock standard. (b) The linear line defined by the calibrated shock velocity in the shock standard and Eq. (2). (c) The reflection of the shock standard Hugoniot about the intersection of curves a and b. (d) The linear curve defined by the shock velocity measured in the sample and Eq. (2). (e) The Hugoniot curve of the sample.

4. A CONSISTENT DESCRIPTION OF THE HUGONIOT OF PRECOMPRESSED MATTER
The following description illustrates a consistent way to extract the precompressed Hugoniot of a material from its principal Hogoniot, its precompresseion initial conditions and its Grüneisen parameter. For simplicity reasons, the notations P H0 = P H0 (V), P H1 = P H1 (V), E H0 = E H0 (V), E H1 = E H1 (V), and γ = γ (V) are used, where V is the specific volume, H0 and H1 denotes the principal and the precompressed Hugoniot, respectively, and P, E represents the pressure and energy created by the shock wave, respectively. γ is the Grüneisen parameter.
From the conservation laws, the energy and pressure created by the shock wave can be related by (Eliezer, Reference Eliezer2001; Mitchell & Nellis, Reference Mitchell and Nellis1981; Zel'dovich et al., Reference Zel'dovich and Raizer2002):
 $$E_{H0} = {1 \over 2} P_{H0} \lpar V_0 - V\rpar + E_0\comma \;$$
 $$E_{H1}={1 \over 2} \lpar P_{H1} + P_1\rpar \lpar V_1 - V\rpar + E_1\comma \;$$
where E 0, V 0 are the energy and volume at the initial point on the principal Hugoniot curve while the initial pressure is taken to be zero. E 1, V 1, and P 1 are the energy, volume and pressure at the initial point on the precompressed Hugoniot curve.
The principal and precompressed Hugoniot curves can be related via the Mie-Grüneisen EOS (Eliezer et al., Reference Eliezer, Ghatak and Hora2002):
 $$P_{H1} = P_{H0} - {{\rm \gamma} \over V} \lpar E_{H0} - E_{H1}\rpar.$$
Applying Eqs. (4) and (5) to Eq. (6) and rearranging, the pressure on the precompressed Hugoniot is:
 $$P_{H1} = {P_{H0} \left(1 + {{\rm \gamma} \over 2} \left(1 - {V_0 \over V} \right)\right)- {{\rm \gamma} P_1 \over 2} \left(1 - {V_1 \over V} \right)+ {{\rm \gamma} \over V} \left(E_1 - E_0 \right)\over 1 + {{\rm \gamma} \over 2} \left(1 - {V_1 \over V} \right)}\comma$$
where the volume dependence of γ is usually taken to be (Jeanloz et al., Reference Jeanloz, Celliers, Collins, Eggert, Lee, McWilliams, Brygoo and Loubeyre2007):
 $${\rm \gamma} = {\rm \gamma}_0 {V \over V_0}.$$
For consistency, we demand that P H1 (V 1) = P 1 in Eq. (7), therefore:
 $$E_1 = {V_1 \over \bar{{\rm \gamma}}} \lpar P_1 - \bar{P}_{H0}\rpar + {\bar{P}_{H0} \over 2} \lpar V_0 - V_1 \rpar + E_0\comma \;$$
where  $\bar{{\rm \gamma}} = {\rm \gamma} \lpar V_1\rpar$ and
 $\bar{P}_{H0} = P_{H0} \lpar V_1\rpar$. Applying Eq. (9) to Eq. (7) we get:
 $$P_{H1} = {\matrix{P_{H0} \left(1 + {{\rm \gamma} \over 2} \left(1 - {V_0 \over V} \right)\right)- {{\rm \gamma} P_1 \over 2} \left(1 - {V_1 \over V} \right)\cr + {{\rm \gamma} \over V} \left({V_1 \over \bar{{\rm \gamma}}} \lpar P_1 - \bar{P}_{H0}\rpar + {\bar{P}_{H0} \over 2} \lpar V_0 - V_1 \rpar \right)} \over 1 + {{\rm \gamma} \over 2} \left(1 - {V_1 \over V} \right)}.$$
Thus, knowing the principal Hugoniot curve (P H0 (V)), the constant γ0 and the initial pressure and specific volume of the precompresed matter (P1, V1), we can evaluate the precompressed Hugoniot curve using Eq. (10).
Later on in this paper the specific volume will be replaced by the density through  ${\rm \rho} = {1 \over V}$.
5. THE HUGONIOT CURVE OF PRECOMPRESSED ALUMINUM
The principal Hugoniot curve of aluminum has been experimentally and theoretically investigated over a wide range of pressures. The curve used in this work is taken from Nagao et al. (Nagao et al., 2006), and was produced by a simple linear fit to the U S − U P experimental data reported by Mitchell et al. (Mitchell et al., Reference Mitchell, Nellis, Moriarty, Heinle, Holmes, Tipton and Repp1991) form shock wave experiments in the shock velocity range of 10 to 28 km/s. The U S − U P relation reported by Nagao et al. (Reference Nagao, Nakamura, Kondo, Ozaki, Takamatsu, Ono, Shiota, Ichinose, Tanaka, Wakabayashi, Okada, Yoshida, Nakai, Nagai, Shigemori, Sakaiya and Otani2006) is:
 $$U_S^{Al} = 5.685 + 1.275U_P^{Al}.$$
Assuming the linear relation (Neff & Presura, Reference Neff and Presura2010):
 $$U_S = c_0 + sU_P\comma \;$$
the principal Hugoniot P H (ρ) curve was produced from combining Eqs. (2) and (3):
 $$P_H = {\rm \rho} c_0^2 {\left({{\rm \rho} \over {\rm \rho}_0} - 1 \right)\over \left(s - 1 \right)^2 \left({s \over s - 1} - {{\rm \rho} \over {\rm \rho}_0} \right)^2}.$$
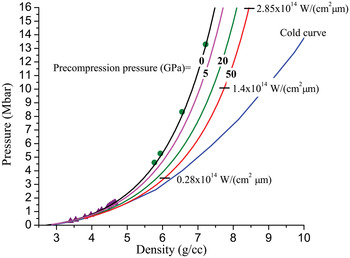
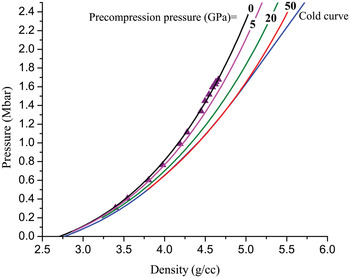
The values from Eq. (11) for c 0 and s were used in Eq. (13) with ρ0 = 2.71 g/cc (Nagao et al., Reference Nagao, Nakamura, Kondo, Ozaki, Takamatsu, Ono, Shiota, Ichinose, Tanaka, Wakabayashi, Okada, Yoshida, Nakai, Nagai, Shigemori, Sakaiya and Otani2006) to produce the principal Hugoniot curve of Al. As can be seen from Figures 5 and 6 the principal Hugoiniot curve (denoted by: “precompression pressure = 0”) reasonably agree with the data of Mitchell et al. (Reference Mitchell, Nellis, Moriarty, Heinle, Holmes, Tipton and Repp1991) for high pressures as well as with the data of Mitchell and Nellis (Reference Mitchell and Nellis1981) for low pressures.
Predicted pressure-density EOS for Al. The zero precompression pressure (black) is the principal Hugoniot taken from Nagao et al. (Reference Nagao, Nakamura, Kondo, Ozaki, Takamatsu, Ono, Shiota, Ichinose, Tanaka, Wakabayashi, Okada, Yoshida, Nakai, Nagai, Shigemori, Sakaiya and Otani2006). The curves indicated by precompression pressure of 5 (pink), 20 (green), and 50 (red) are the calculated precompressed Hugoniot curves. The “cold curve” (blue) is taken from Shock-Wave-Data. The solid circles (green) are the high pressure experimental data from Mitchell et al., (Reference Mitchell, Nellis, Moriarty, Heinle, Holmes, Tipton and Repp1991) and the solid rectangles are the low pressure experimental data form Mitchell et al., (1981). The short horizontal lines represents the pressure-density accepted from impedance mismatch calculation for Al precompressed to 50 GPa in a DAC for different normalized laser intensities (I/λ).

Predicted pressure-density EOS for Al at low pressures. The notations are the same as in Figure 5.

The principal Hugoniot curve, the value γ0 = 2.15 (Nellis et al., Reference Nellis, Mitchell and Young2003) and the values of the initial precompression conditions (P 1 and ρ1, were taken from the 300 K isotherm reported by Dewaele et al. Reference Dewaele, Loubeyre and Mezouar2004) were applied to Eq. (10) to produce the precompressed Hugonit of Al at different initial pressures (5, 20, and 50 GPa) as can be seen in Figures 5 and 6. Also presented in Figures 5 and 6 is the calculated “cold curve” (zero temperature isotherm/isentrope) taken from the Shock Wave Database. In Figure 5 pressures and densities are indicated that are expected to be accepted from a laser driven shock wave experiment for Al sample precompressed in a DAC to 50 GPa for different normalized laser intensities. The accepted values were obtained from an impedance mismatch scheme for an Al-Diamond-Al target. In this scheme, the first Al layer was considered as the ablator and the shock pressure produced by the laser was calculated from the following calibration (Drake, Reference Drake2010):
 $$P = 8 \left({I \over {\rm \lambda}} \right)^{2/3}\comma \;$$
where I is the laser intensity in 1014 W/cm2, λ is the laser wavelength in μm and P is in Mbar. In the impedance mismatch calculation, the Shock pressure in the Al ablator was considered on the principal Hugoniot while the shock pressure in the Al sample was considered along the precompressed Hugoniot. The values of U S and U P for the precompressed Hugoniot were calculated from Eqs. (2) and (3) and the known P H1 (ρ). For Al precompressed to 50 GPa the relation
 $$U_S = 7.43 + 1.33U_P\comma \;$$
was accepted. The principal Hugoniot of the diamond was taken to be (Nagao et al. Reference Nagao, Nakamura, Kondo, Ozaki, Takamatsu, Ono, Shiota, Ichinose, Tanaka, Wakabayashi, Okada, Yoshida, Nakai, Nagai, Shigemori, Sakaiya and Otani2006):
 $$U_S^D = 11.2 + 1.2U_P^D. \;$$
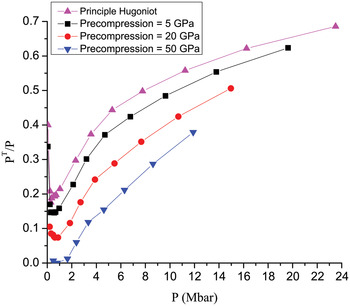
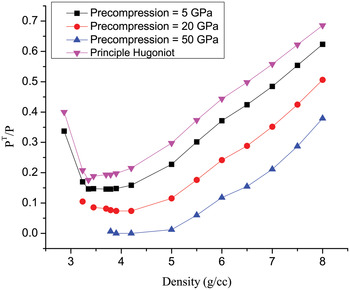
In Figures 7 and 8, the relative thermal pressure as a function of the density is presented for the different Hugoniot curves of Al. The thermal pressure is defined by:
 $$P^T = P - P^C\comma \;$$
where P is the total pressure and P C is the cold pressure or the pressure on the “cold curve.” Evidently from Figures 7 and 8 the Hugoniot of Al precompressed to 50 GPa follows the “cold curve” to density of about 5.2 g/cc and pressure of about 2 Mbar.
The relative thermal pressure as a function of the pressure on the Hugoniot curve for different precompression pressures.

The relative thermal pressure on the Hugoniot curve as a function of the density for different precompression pressures.

6. CONCLUSION
This paper presents an experimental setup, based on a partially perforated diamond anvil, which will allow achieving precompression pressures higher by about an order of magnitude compared to ones currently reported in laser-driven shock experiments in a DAC. Such higher precompression pressures will allow investigating the EOS of materials deeper in to the interior of large planetary bodies, and will provide a way to research the off-Hugoniot conditions of opaque solid materials from the principal Hugoniot to the “cold curve.”
One unresolved issue with the partially perforated diamond anvil is the surface roughness of the minimum opening after the laser drilling. It is yet unclear how this property will affect the spatial uniformity of the laser-driven shock front. We propose three routes to overcome this difficulty: (1) by polishing the surface, (2) by using a spatially unsmoothed laser pulse to average the ablation rate over the surface, (3) by focusing the laser pulse further into the diamond anvil.
A consistent method for calculating the precompressed Hugoniot from the principal Hugoniot and the Mie-Grüneisen EOS was presented. The Hugoniot curves of Al precompressed to 5, 20, and 50 GPa were calculated along with their relative thermal pressure. With respect to this calculation it should be noted that the precompressed Hugoniot is composed of a different linear relation between U S and U P than the linear relation of the principal Hugoniot. For instance, it was found that the linear relation between U S and U P which best describes the Hugoniot of Al precompressed to 50 GPa is U S = 7.43 + 1.33U P, significantly modified from the principal Hugoniot as given by Eq. (11). Therefore, trying to calculate the precompressed Hugoniot from Eqs. (2) and (3) using the initial conditions of the precompressed sample but using the linear relation between U S and U P from the principal Hugoniot may provide unphysical results, such as crossing the “cold curve”.
The results for the relative thermal pressure have shown that at about 10 Mbar the relative thermal pressure of Al precompressed to 50 GPa is about 33% compared to about 54% on the principal Hugoniot. For such a large span of the thermal pressure, it is argued that the experiment presented here will give a profound insight to the mechanisms governing this thermodynamic propery.
We also believe that the calculations for the precompressed Hugoniot of Al presented here may be used in future experiments were Al is used as a shock standard material.
ACKNOWLEDGMENT
The authors thank Prof. M. P. Pasternak for many fruitful discussions.