Introduction
The Arctic sea-ice cover requices maintenance of a low-salinity surface layer. Surface runoff provides the largest single-ocean fresh-water source of about 35 cm a−1 (Reference Aagaard and CarmackAagaard and Carmack, 1999; Reference Ivanov and YankinaIvanov and Yankina, 1991). Following fresh-Water import through the Bering Strait, precipitation less evaporation (P−E) over the Arctic Ocean itself provides the next largest contribution of 16–17 cm a−1 (Reference Serreze, Barry and WalshSerreze and others, 1995). Changes in precipitation over watersheds draining into the Arctic Ocean and over the Arctic Ocean itself may impact on sea-ice thickness and ice area, influencing ocean-to-atmosphere heat and moisture fluxes and, potentially, cloud cover and cyclone activity. The flux of sea ice through Fram Strait and the Canadian Arctic Archipelago influences the oceanic convective regime, impacting on the global thermohalinc circulation (Reference Zaucker, Stocker and BroeckerZaueker and others, 1994). Arctic marine life is organized into complex food webs, conditioned by sea ice, nutrient availability and water density. Changes in these factors may impact on marine ecosystems and the biochemical cycling of essential nutrients. Changes in the terrestrial hydrologic cycle may also alter soil moisture, influencing planl communities and their grazers. Arctic soils and peatlands serve as sources and sinks of atmospheric trace gases, and appear to respond sensitively to changes in soil moisture and temperature (Reference McCauley and MeierMcCauley and Meier, 1991).
Addressing these issues requices improved databases of precipitation for model input and validation, as well as for diagnostic climate studies. Precipitation data from Arctic land stations (Reference VoseVose and others, 1992) suffer from severe under catchment in areas of blowing snow (Reference Woo, Heron, Marsh and SteerWoo and others. 1983). Even in summer, estimates may be low clue to neglect of occult precipitation (fog, dew) over tundra areas (Reference Dingman, Weller, Benson, LeDrew, Goodwin, Brown, Miller, Tiezen and BunnerDingman and others, 1980), trace values and wetting losses. As most Arctic stations are at low altitudes, the tendency for precipitation to increase with elevation also implies an underestimate of regional averages when station data are used. It is possible to adjust station data for exposure, winds and gauge type, but the network is still relatively sparse. Databases for the Arctic Ocean are primarily for long-term mean annual and monthly values (e.g. Reference BryazginBryazgin, 1976; Reference GorshkovGorshkov, 1983; Reference Legates and WillmottLegates and Wilmott, 1990). Aerological analyses using the reasonably dense network of Arctic rawin-sonde stations can provide estimates of P – E, but only large areal averages can be obtained.
Modeled Precipitation Fields
Recognition of the need for gridded fields of Arctic precipitation has led to interest in the evaluation of output from numerical weather prediction (NWP) models (WCRP, 1994). Although data assimilation/forecast systems vary between different NWP centers, the general procedure is to start with a previous forecast as a first “guess” of present atmospheric conditions. Observed data e.g. from rawin-sondes. dropsondes and satellites) are assimilated to adjust the forecast fields, providing analyses representing the best estimate of the current true state of the atmosphere, used to produce the next forecast. Assimilation data are primarily free-atmosphere Variables. Archived fields represent a blend of analyses based on the first guess and assimilation (e.g. pressure heights), and modeled surface variables, including precipitation.
Modeled surface fields for the Arctic have suffered from a number of problems. These include the scarcity of sounding data over the central Arctic Basin, difficulties in quality control and in determining the appropriate weights for-observations vs first-guess fields over such data-sparse areas, uncertainties in satellite-derived soundings, simplistic represetation of sea ice (generally taken as a slab with fixed thickness and 100% concentration), inadequate physical parameterizations (particularly with respect to clouds), radiation and boundary-layer processes, and problems with filtering fields at the northernmost rows of gridpoint models. A further problem is a lack of temporal consistency in archived fields due to changes introduced in models and data assimilation systems (WCRP,1994).
Limited cases studies of operational NWP output for recent years are nevertheless encouraging. Precipitation fields for April 1993 from a regtonal model of the Canadian Atmospheric Environment Service showed very good agreement with observations (Environment Canada, 1993). In a recent WCRP Arctic Climate System (ACSYS) workshop (held September 1995), it was demonstrated that precipitation fields from United Kingdom Meteorological Office (UKMO) and European Center for Medium-Range Weather Forecasts (ECMWF) models provide realistic spatio-temporal patterns in qualitative agreement with existing climatologies (H. Cattle, personal communication, 1995).
“Reanalysis” projects underway at several agencies are providing internally consistent gridded fields. Although still prone to many of the problems outlined above, including simplistic treatments of sea ice, they should provide improved arehived fields through: 1) the elimination of temporal discontinuities through the use of “frozen” state-of-the-art data assimilation/forecast systems: and 2) the assurance that all available historical data are used in the assimilations, and are subjected to strict quality control. The most comprehensive of these projects represents a cooperative effort between the National Center for Evironmental Prediction (NCEP formerly the National Meteorological Center) and the National Center for Atmospheric Researeh (NCAR). The NCEP/NCAR project aimed to complete the reanalysis for a 40 year time pertod (1957–96) by the end of 1996. Details of the reanalysis system are provided by Reference KalnayKalnay and others (1996).
The quality of reanalysis precipitation fields remains largely untested for the Aretic. A case study using NCEP/ NCAR output over the Mackenzie watershed for 1985 and 1986 (J. Walsh, personal communication, 1995 shows the seasonal cycles and spatial patterns of precipitation to be realistic, but with the model totals greater than from uncorrected station data. As station values are considered to be underestimates, this difference is in the “correct” dicection. However, the largest discrepancies occur during spring and summer, when most precipitation would be in the liquid form. Precipitation pattern over Greenland and Antaretica, examined using 6 years of ECMW Freanalysis data, appear realistic (Reference Genthon and BraunGenthon and Braun, 1995).
Here, we provide an initial evaluation of Aretic precipitation as depicted in the NCEP/NCAR reanalysis over the 8 year pertod 1986–93 for the regton north of 60° N . We use the 6 hourly instantaneous precipitation rates (in kg m−2 s−1), which are provided over a 192 × 94 gaussian grid. The instantaneous rates were converted into monthly precipitation totals by month and year. Comparisons are made with several gauge-corrected climatologies, including the map of annual totals provided by Reference BryazginBryazgin (1976), based on data from fixed stations, aircraft landings and the Russian North Pole series of manned drifting camps (1916–74). We also use monthly means north of 70° N based on the Reference GorshkovGorshkov (1983) atlas, which according to Reference BurovaBurova (1983), rely on Reference BryazginBryazgin’s (1976) results, as well as a recently acquiced set of gaugecorrected monthly maps by Reference BryazginBryazgin (1976), updated using data through 1990.
Results
Annual field
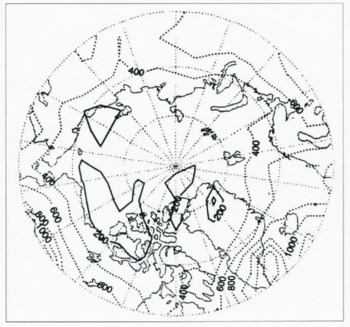
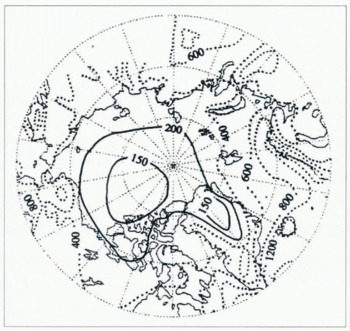
Figure 1 shows the spatial distribution of modeled annual precipitation averaged over the 8 years while Figure 2 provides the annual gauge-corrected map of Reference BryazginBryazgin (1976). The reanalysis fields were interpolated to the NMC octagonal grid using Crcssman weights with a 500 km sphere of influence. This smoothing eliminates local “bull’s-eyes” in precipitation that appear to result from spectral truncation errors. The model depicts the highest totals over the Atlantic side of the Aretic. Maximum values are found off the southeast coast of Greenland (1400 mm), with amounts decreasing to the northeast. This pattern is physically consistent with the elfects of the frequent cyclone activity associated with the mean Icelandic Low, and the poleward decay of the North Atlantic cyclone track (Reference SerrezeSerreze, 1995). High totals (up to 1200 mm) are also depicted near the edge of the map over southern Alaska, which reflects the influence of the Aleuiian Low and orography. The lowest values (150–200 mm) are found over the Beaufort Sea, parts of the Canadian Aretic Arehipelago, the East Siberian Sea and northern Greenland. These are regtons of infrequent cyclone activity for most of the year, and where anticyclonic conditions are common during winter and spring (Reference Serreze, Box, Barry and WalshSerreze and others, 1993).
Mean annual precipitation (1986–93) from the NCEP/NCAR reanalysis (in mm).
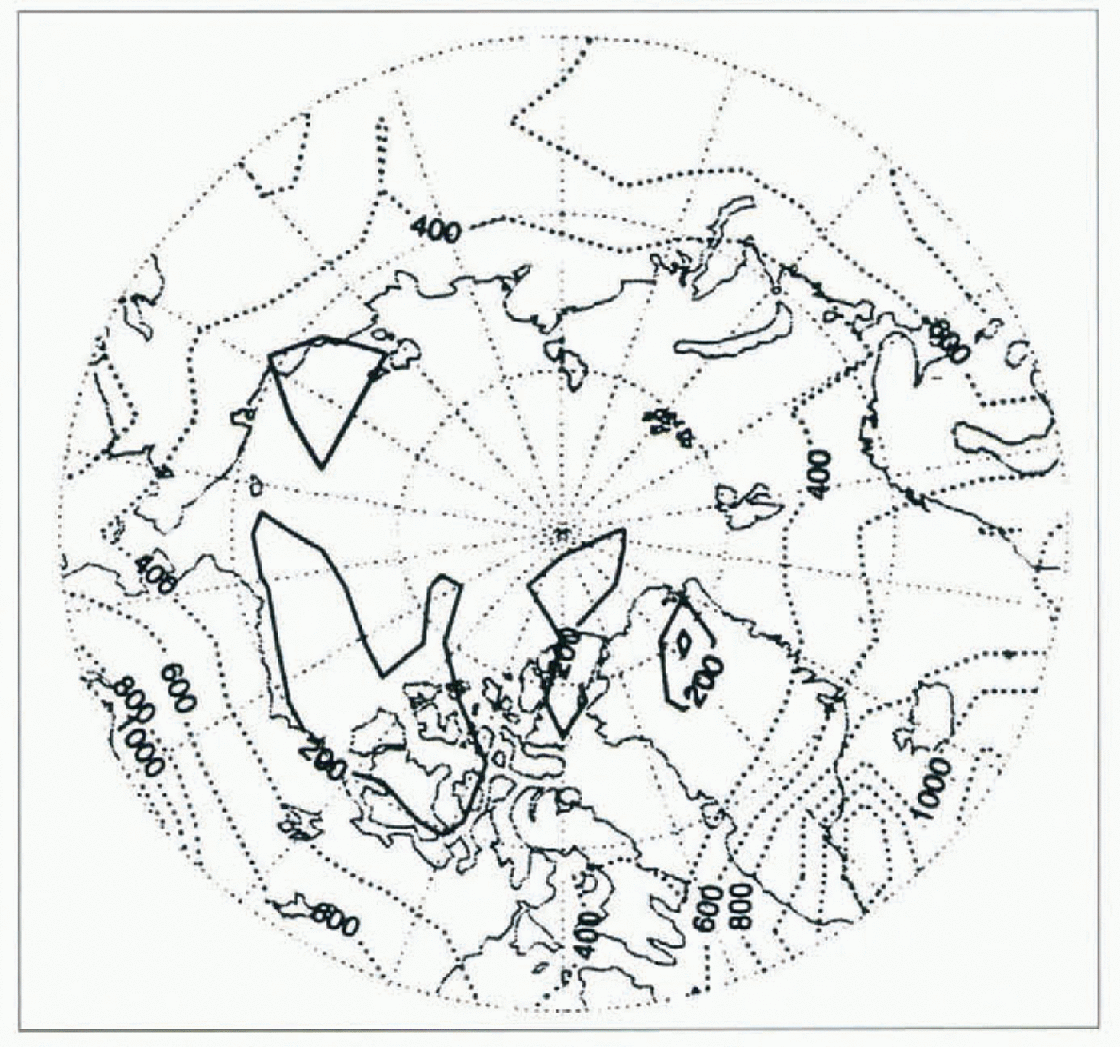
Mean annual gauge-corrected precipitation (1916–74) redrawn after Reference BryazginBryazgin (1976) (in mm).
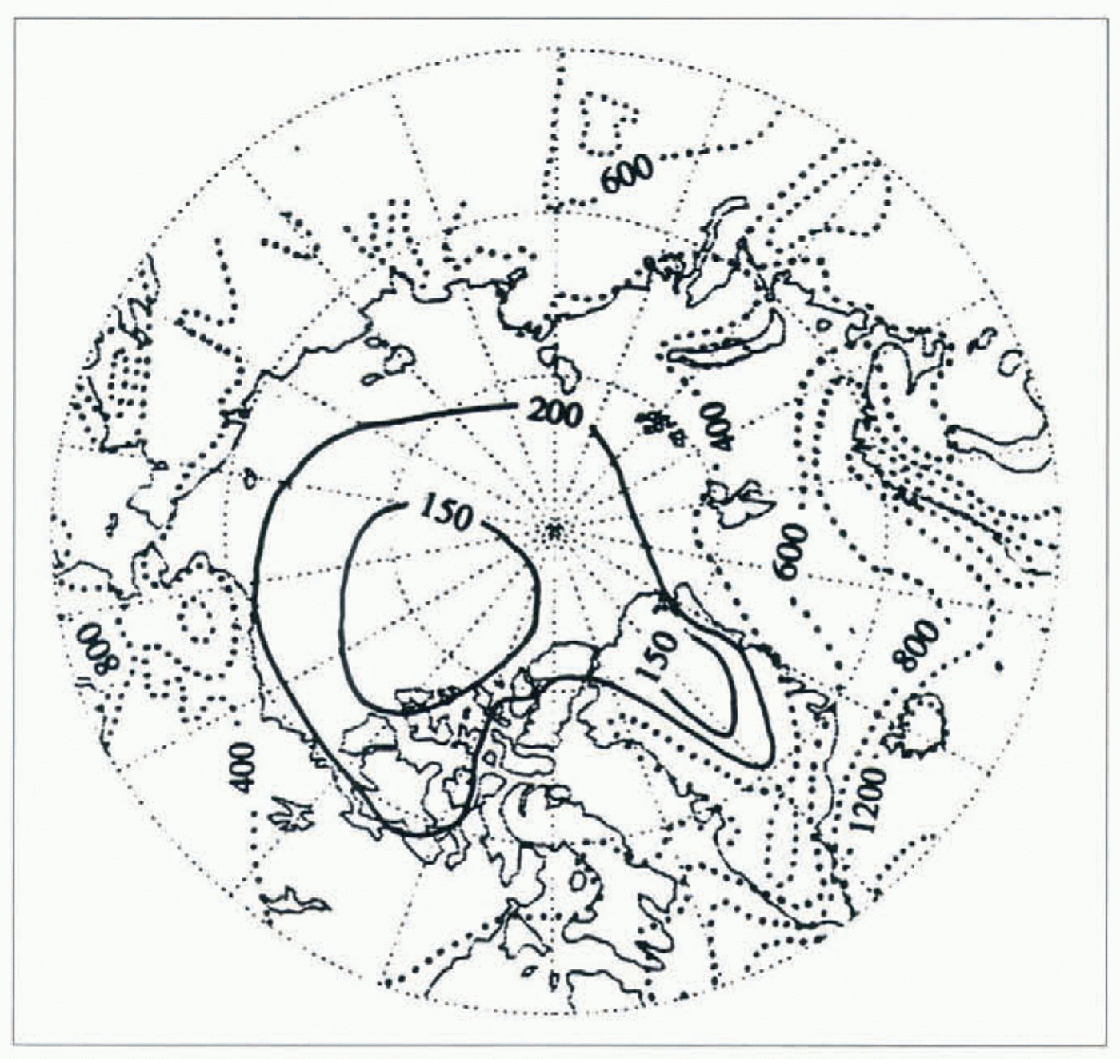
Although the Reference BryazginBryazgin (1976) climatology is based on data from a different pertod and the gauge corrections employed are not well documented, comparisons indicate that the model is capturing the major spatial patterns of precipitation reasonably well. In particular, the model correctly depicts precipitation maxima over the Atlantic side of the Aretic and southern Alaska, and low central Aretic values. Nevertheless, there are some notable differences. In particular, Reference BryazginBryazgin (1976) shows high precipitation values (>400 mm) along the Atlantic side of the Aretic penetrating as far as Novaya Zemlya. The model also fails to capture precipitation maxima related to local orography, such as along the Scandinavian coast, as well as over Iceland, Svalbard and Novaya Zemlya. This is likely to be related to the relatively low (T62) model resolution, as well as to the smoothing employed here. Nevertheless, these initial results must be considered encouraging.
Seasonality and inter-annual variability
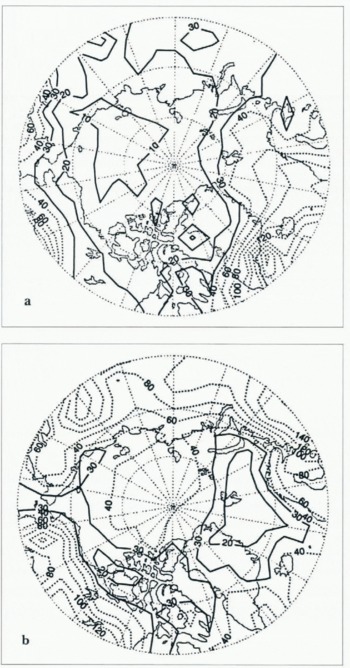
Figure 3 shows the modeled average precipitation fields for January and July. The January pattern (Fig. 3a) is similar to that for the annual field, with the highest totals over the Atlantic side (up to 200 mm near the position of the Icelandic Low) and southern Alaska. By contrast, July (Fig. 3b) shows a reduction in Atlantic-side precipitation, coupled with increases over the central Aretic Ocean, Eurasia, central Alaska and Canada. These results are consistent with seasonal changes in atmospheric circulation (Reference Whittaker and HornWhittaker and Horn, 1984; Reference Serreze, Box, Barry and WalshSerreze and others, 1993; Reference SerrezeSerreze, 1995).
Mean precipitation (1986–93) from the NCEP/NCAR reanalysis (in mm) for (a) January and (b) July.

During January, the primary North Atlantic cyclone track and the Icelandic and Aleutian Lows are strong, with the affected areas receiving relatively abundant precipitation. During summer, the North Atlantic track and subpolar lows weaken, but with cyclone activity becoming common over northern Eurasia, Canada and Alaska. Eurasian systems in particular tend to migrate into the central Aretic Ocean, where they subsequently occlude. While lows may enter the Aretic Ocean from anywhere along the Eurasian coast, a Laptev Sea track is preferred.
Reference BryazginBryazgin’s (1976) updated monthly analyses agree with the model in showing a January precipitation of 10–20 mm over the central Aretic Ocean increasing towards the Atlantic side, but again display higher values along the Scandinavian coast. Reference BryazginBryazgin’s (1976) data also show a reduction in July precipitation over the Atlantic side, with increases over the central Aretic Ocean, but with lower amounts (30 mm) than in the reanalysis (30–40 mm). Bryazgin–s maps also display sharp increases over land, especially the local maxima over Alaska and eastern Eurasia, which are regtons of frequent summertime cyclogcncsis (Reference SerrezeSerreze, 1995).
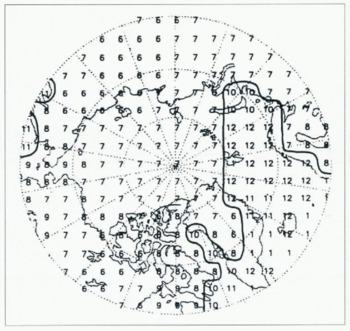
The spatial pattern of the month of the precipitation maximum (Fig. 4), calculated for each NMC gridpoint from the long-term monthly means, shows two major features: 1) an October January maximum over the Atlantic side of the Aretic and lhe Baffin Bay/Davis Strait region; and 2) a June-September maximum over the remainder of the Aretic, with a spatially homogeneous July peak for the central Aretic Ocean. A recent analysis (Reference Clark, Serreze and BarryClark and others, 1996) of precipitation frequencies over the Aretic Ocean and its peripheral seas, evaluated from present weather reports contained in the Comprehensive Ocean Atmosphere Data-set (COADS) (Reference Woodruff, Slutz, Jenne and SteurerWoodruff and others, 1987), shows this Atlantic-side winter maximum clearly. The liming of this maximum also agrees with the updated monthly maps of Reference BryazginBryazgin (1976). However, it appears that the model’s July peak precipitation over the central Aretic Ocean is in error by at least a month.
Month of the precipitation maximum from the NCEP/NCAR reanalysis, based on long-term (1986–93) monthly means. The solid line separates regions with October-January and June September maxima.

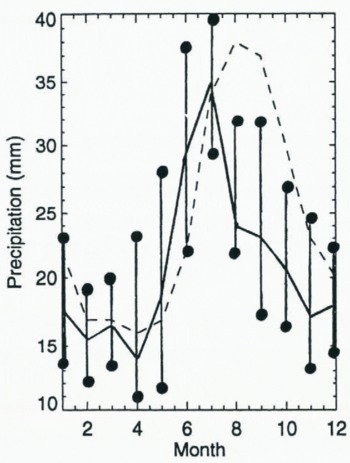
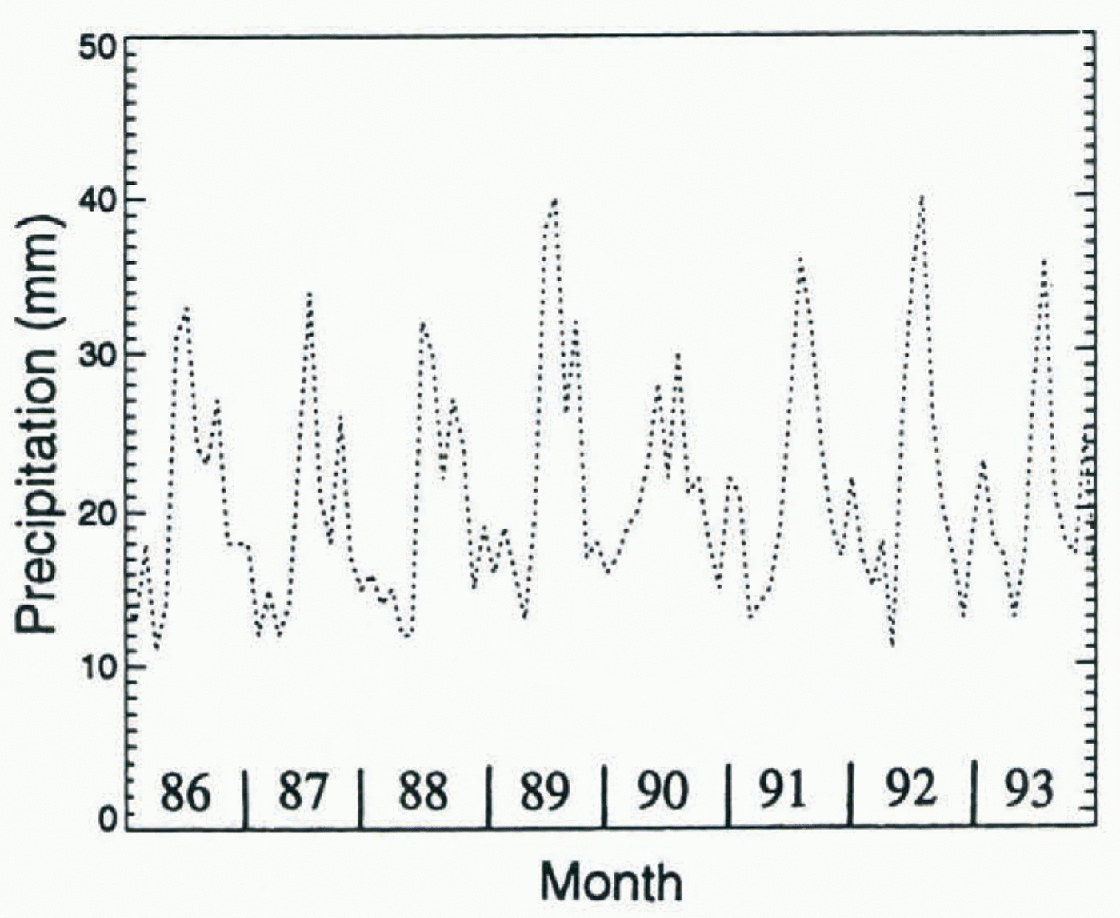
This is illustrated in Figure 5, which shows the long-term (1986–93) monthly reanalysis precipitation averaged for the central Aretic, taken as the regton north of 70°N, the maximum and minimum values based on individual years, and the climatological monthly means from Reference GorshkovGorshkov (1983). From January through April, the reanalysis means are low, but high from May through July. Despite these differences, the January-July reanalysis totals can be considered quite reasonable. However, the model shows a very sharp precipitation peak in July, a month earlier than shown the data presented by Reference GorshkovGorshkov (1983), remaining far below his values through December. Even the positive extremes of the reanalysis precipitation are lower than the Gorshkov means from August through October. As shown in the monthly time series of modeled precipitation (Fig. 6.), this July peak is persistent from year to year. Due largely to the underestimates from August through December, the models annual-precipitation total for the central Aretic regton is 250 mm, as compared to 293 mm from the Gorshkov atlas. Interestingly, nearly all models reviewed as part of the Atmospheric Model Intercomparison Project (AMIP) display an August precipitation maximum for the central Aretic (Reference Kattsov, Pavlova and GovorkovaKattsov and others, in press). Note also that the August peak depicted by these models occurs a month earlier than the September peak in the water vapor flux convergence and P–E for the regton north of 70°N as analyzed from rawinsonde data (Reference Serreze, Barry and WalshSerreze and others, 1995).
Mean monthly precipitation for the region north of 70° Nas depicted by Reference GorshkovGorshkov (1983) (dashed line) and in the NCEP/NCAR reanalysis (solid line). The range in the reanalysis values over the 1986–93 is shown by the vertical lines ended by dots (all values in mm).
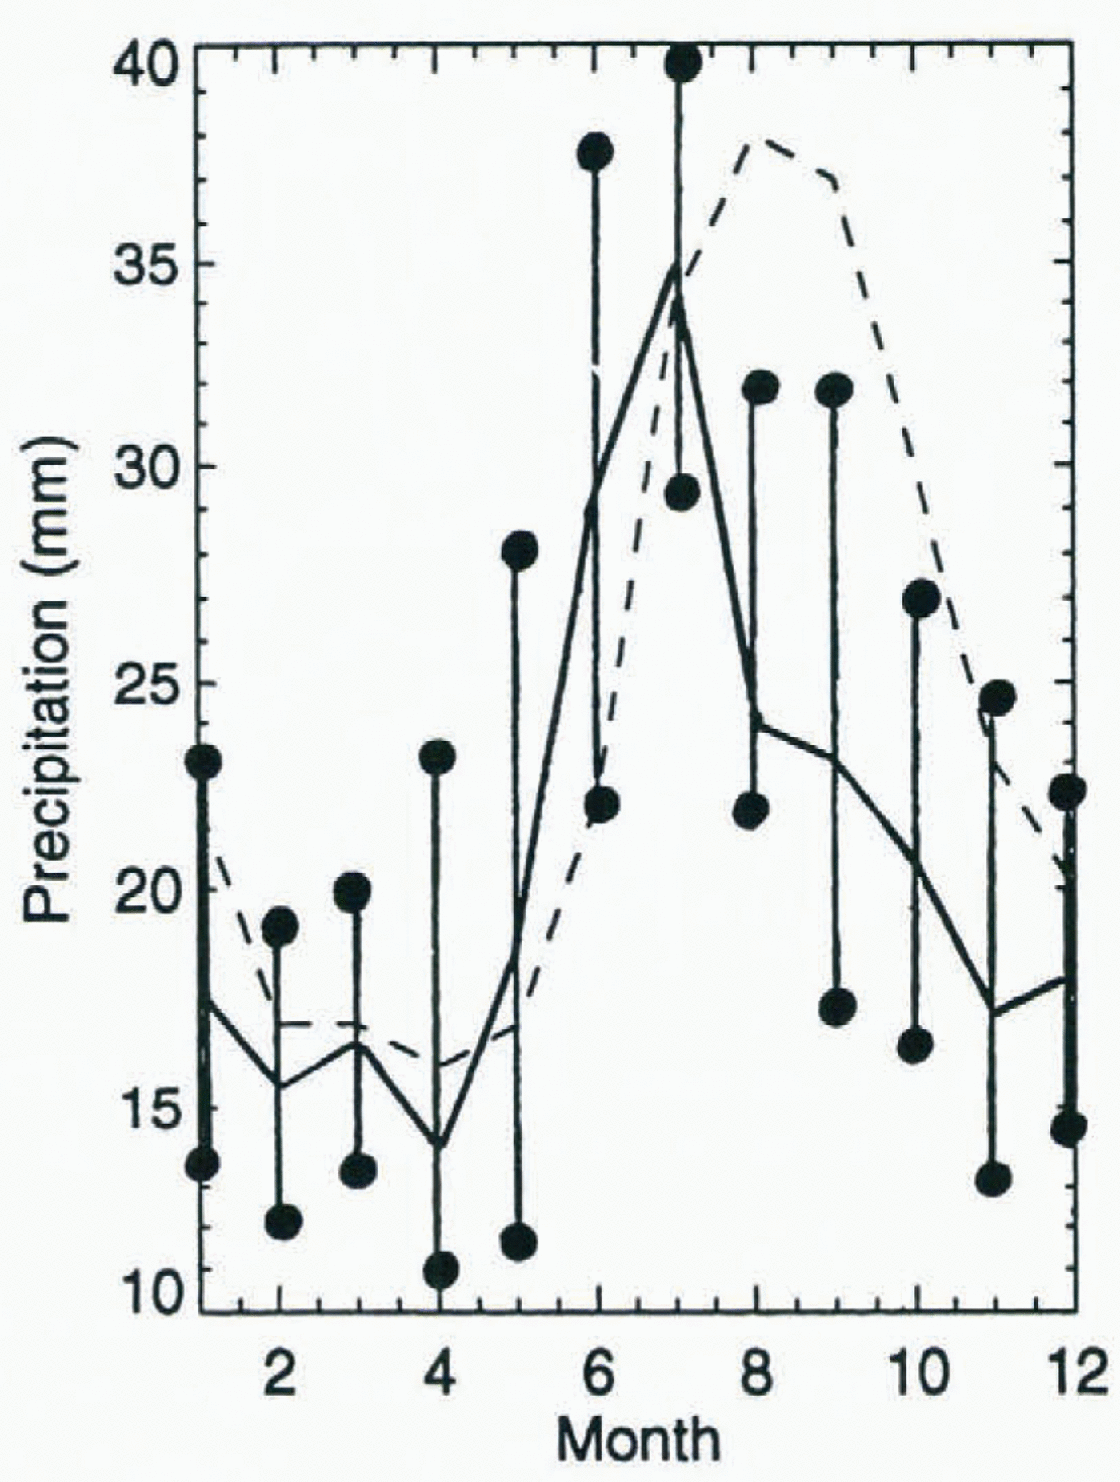
Time series of mothly prepitation for the period 1986–93 from the NCEP/NCAR reanalyis for the rigion north of 70°N (in mm).
Discussion
Based on our initial study, the performance of the NCEP/NCAR reanalysis to depict Aretic precipitation could perhaps best be described as uneven. The spatial patterns of long-term annual and monthly precipitation agree reasonably well with available climatologies, although there are some notable differences. In particular, the annual peak in precipitation over the central Aretic Ocean occurs too early in July with large underestimates from August through December. We recognize the possibility that the 8 years (1986–93) examined here might not be sufficiently long enough lor effective comparisons with observed climatologies or the AMIP outputs, which span the pertod 1979–88 (Reference Kattsov, Pavlova and GovorkovaKattsov and others, in press).
The past decade has been anomalous in terms of Aretic circulation (Reference Maslanik, Serreze and BarryMaslanik and others. 1996; Reference Walsh, Chapman and ShyWalsh and others, 1996). However, this pertod has been characterized by sharp increases in cyclone activity and accompanying reductions in sea-level pressure over the central Aretic Ocean, which, a priori, suggest that precipitation over the central Aretic has recently been above normal. Resolving this issue will requice further investigations using additional reanalysis data, as well as efforts to assess the model’s treatment of high-latitude hydrologic processes.
Despite the shortcoming in the modeled fields, we echo the recommendations of the WCRP (WCRR, 1994) to examine methods of blending the reanalysis precipitation fields with observed data. Effort are underway by C. Willmott at the University of Delaware to compute monthly gauge-corrected precipitation fields for Arctic land areas, building on techniques outlined by Reference Legates and WillmottLegates and Wilmott (1990). Using such fields, along with the updated climatological monthly means from Bryazgin for the Arctic Ocean, and gauge-corrected station data, techniques such as optimal interpolation could be applied to obtain gridded fields for use in climate studies and sea-ice models.
Acknowledgements
This study was supported by NSF grants ATM-9315851. OPP-9504201 and OPP-9614297.