





It is important to understand how the mental health of populations or subpopulations changes over time. For example, alarm has been raised that the use of smartphones and social media has adversely affected the psychological well-being of youths starting around 2010 (Haidt, Reference Haidt2024; Keyes et al., Reference Keyes, Gary, O’Malley, Hamilton and Schulenberg2019), and that growing ‘despair’ has increased the death rates of prime-age adults since the beginning of the 21st century (Case & Deaton, Reference Case and Deaton2017, Reference Case and Deaton2022).
One way to identify these trends involves directly examining possible consequences of worsening mental health such as changes in rates of suicides or attempts, the use of mental health services, or prescriptions for psychiatric medications. While useful, this approach has at least two limitations. First, these outcomes may be affected by confounding factors that are difficult to account for. Second, most of these measures permit controls for only a relatively limited set of personal or geographic characteristics. For instance, suicide data come from death certificates that include a somewhat sparse set of demographic variables and may yield samples for subgroups that are too small for reliable analysis.
An alternative is to employ information on serious psychological distress or depression (SPD) from large household surveys providing data designed, with the use of sampling weights, to be nationally representative. (Terms like psychological distress and poor mental health are used interchangeably below for convenience.) The survey-based measures are valuable in principle and are widely utilized but have several complications that may limit their usefulness or require care in their application. These include varying response rates, instrument redesigns, and sample sizes that may be too small to produce precise estimates.
These issues are investigated below by examining trends in Kessler 6 (K6) and Patient Health Questionnaire 2 and 9 (PHQ2 and PHQ9) outcomes from major US household surveys. The K6 was explicitly developed to measure the prevalence of SPD in large surveys (Kessler et al., Reference Kessler, Andrews, Colpe, Hiripi, Mroczek, Normand, Walters and Zaslavsky2002, Reference Kessler, Barker, Colpe, Epstein, Gfroerer, Hiripi, Howes, Normand, Manderscheid, Walters and Zaslavsky2003). The PHQ2 and PHQ9 were originally designed to screen for depression in medical settings (Kroenke, Spitzer, & Williams, Reference Kroenke, Spitzer and Williams2001, Reference Kroenke, Spitzer and Williams2003; Spitzer, Kroenke, & Williams, Reference Spitzer, Kroenke and Williams1999), but have also been included in major household surveys. The two sets of measures have been widely used in prior research but with disparate results.
The analysis focused on 18- to 64-year-olds from 2004 to 2019 or subperiods with usable data. The age range was chosen to be comparable across surveys, some of which only provided information for adults. Persons 65 years and older were excluded since the determinants of their mental health may have differed from younger adults, mortality selection was more problematic for them, and they were less often surveyed because of physical health problems or because of residing in nursing homes, which were excluded from most household surveys. The starting year was determined by data availability for several of the surveys, and 2019 was the endpoint since mental health and its measurement were likely to have been uniquely affected by the COVID-19 pandemic. The estimated trends were then compared to those for potential consequences of poor mental health (CMH) to shed light on the plausibility and sources of inconsistent findings obtained for some of the survey measures.
Methods
Mental distress measures
SPD was evaluated using the K6, PHQ2, and PHQ9. The K6 was based on responses to six questions asking whether, in the last 30 days, the respondent felt: ‘so sad nothing could cheer you up’, ‘nervous’, ‘restless or fidgety’, ‘hopeless’, ‘that everything was an effort’, and ‘worthless’. Each response was scored on 0–4 scale corresponding to: ‘none of the time’, ‘a little of the time’, ‘some of the time’, ‘most of the time’, or ‘all of the time’. Scores for the six responses were then summed to provide a total ranging from 0 to 24. This analysis used the conventional threshold defining SPD as scores of ≥13 (Daly, Reference Daly2022; Jackson et al., Reference Jackson, Brown, Shahab, McNeill, Munafò and Brose2023; Kessler et al., Reference Kessler, Barker, Colpe, Epstein, Gfroerer, Hiripi, Howes, Normand, Manderscheid, Walters and Zaslavsky2003; Mojtabai & Jorm, Reference Mojtabai and Jorm2015; Olfson et al., Reference Olfson, Wang, Wall, Marcus and Blanco2019; Tomitaka et al., Reference Tomitaka, Kawasaki, Ide, Akutagawa, Ono and Furukawa2019).
The PHQ2 scale was constructed from responses to two questions asking how often in the last 2 weeks the individual was bothered by: ‘having little interest or pleasure in doing things’, and ‘feeling down, depressed, or hopeless’. The PHQ9 used these questions plus seven others, also referring to the last 2 weeks, on: ‘trouble falling or staying asleep, or sleeping too much’, ‘feeling tired or having little energy’, ‘poor appetite or overeating’, ‘feeling bad about yourself – or that you are a failure or have let yourself or your family down’, ‘trouble concentrating on things, such as reading the newspaper or watching television’, ‘moving or speaking so slowly that other people could have noticed – or the opposite, being so fidgety or restless that you have been moving around a lot more than usual’, or ‘thoughts that you would be better off dead, or thoughts of hurting yourself in some way’. Answers were scored from 0 to 3 for ‘not at all’, ‘several days’, ‘more than half the days’, or ‘nearly every day’. Aggregating the scores gave a range from 0 to 6 for the PHQ2 and 0 to 27 for the PHQ9. This analysis followed prior research in delineating SPD as PHQ2 scores
$ \ge 3 $
 and PHQ9 scores
$ \ge 10 $
 (Brody, Pratt, & Hughes, Reference Brody, Pratt and Hughes2018; Egede, Walker, Bishu, & Dismuke, Reference Egede, Walker, Bishu and Dismuke2016; Kroenke, Spitzer, & Williams, Reference Kroenke, Spitzer and Williams2003; Levis et al., Reference Levis, Sun, He, Wu, Krishnan, Bhandari, Neupane, Imran, Brehaut, Negeri, Fischer, Benedetti, Thombs, Che, Levis, Riehm, Saadat, Azar and Zhang2020; Mitchell, Yadegarfar, Gill, & Stubbs, Reference Mitchell, Yadegarfar, Gill and Stubbs2016; Tápias et al., Reference Tápias, Otani, Vasques, Otani and Uchida2021).
K6 data were obtained from the 2004–2018 National Health Interview Surveys (NHIS), the National Survey of Drug Use and Health (NSDUH) for 2008–2019, and from self-administered questionnaire (SAQ) responses in the Medical Expenditure Panel Survey (MEPS) from 2004 to 2019. PHQ2 data were from the 2004–2019 MEPS and, biennially, from the National Health and Nutrition Examination Survey (NHANES) from 2005 to 2006 through 2015–2016 and from 2017 to 2020 (pre-pandemic). The PHQ9 came from NHANES over the same period. Information on these surveys is available elsewhere (Blewett et al., Reference Blewett, Drew, Backman, Chen, Cooper, Schouweiler and Richards2024, Reference Blewett, Rivera Drew, Fenelon, King, Williams, Backman, Breton, Cooper and Richards2025; National Center for Health Statistics (NCHS), 2022; Substance Abuse and Mental Health Services Administration, 2020).
The variables and analysis periods were chosen to maximize consistency of the measures over time. For example, analysis of the NHIS K6 stopped in 2018 because the survey had a major redesign in 2019 introducing noncomparability (IPUMS NHIS, 2020), and the NSDUH K6 started in 2008 because earlier waves measured the variable for the worst month of the last year, rather than the last month (Hedden et al., Reference Hedden, Gfroerer, Barker, Smith, Pemberton, Saavedra, Forman-Hoffman, Ringeisen and Novak2012).
Nevertheless, the results should be interpreted in light of several potential issues. The NHIS sample is redesigned at ~10-year intervals and, within the analysis period, the 2016 redesign introduced a number of changes including modifications to the primary sampling unit (PSU) selection criteria and the sources from which the addresses surveyed were obtained (IPUMS Center for Data Integration, n.d.). The NSDUH sampling frame was changed in 2014, and the survey received a partial redesign in 2015 to improve the information provided on substance abuse (Center for Behavioral Health Statistics and Quality, 2015), although the latter should not, in principle, affect the reported mental health variables. Finally, one well-known issue is that survey response rates have declined over time for most US household surveys (Czajka & Beyler, Reference Czajka and Beyler2016; Meyer, Mok, & Sullivan, Reference Meyer, Mok and Sullivan2015; Williams & Brick, Reference Williams and Brick2018), including the four analyzed here, as documented in Supplementary Appendix Figure A1.
Potential consequences of poor mental health
The SPD measures would ideally be benchmarked against other indicators of mental distress. Four potential CMH during the last year for 18- to 64-year-olds, were used for this purpose: suicides per 100,000 (SUICIDE); emergency department visits with a diagnosis of suicidal ideation or attempts per 100,000 (SUICIDE ED); having visited or talked to a mental health professional (MH VISITS); and use of prescribed psychotropic medications (MH DRUGS).
An issue is that trends in these measures were not necessarily exclusively determined by changes in mental health. Suicide rates were probably most closely associated with psychological distress but still were not perfect since they may also have depended on the means for self-harm, such as the availability of guns (Currie, Reference Currie2025; Martínez-Alés, Jiang, Keyes, & Gradus, Reference Martínez-Alés, Jiang, Keyes and Gradus2022; Yip et al., Reference Yip, Caine, Yousuf, Chang, Wu and Chen2012). These concerns were greater for the other CMH variables: the coding of ED visits was modified in 2016, with the switch from the ICD-9-CM to ICD-10-CM systems (Corredor-Waldron & Currie, Reference Corredor-Waldron and Currie2024; Hedegaard et al., Reference Hedegaard, Schoenbaum, Claassen, Crosby, Holland and Proescholdbell2018; Sebastião et al., Reference Sebastião, Metzger, Chisolm, Xiang and Cooper2021), and visits to mental health professionals or the use of prescribed medications may have been affected by financial and regulatory considerations, such as improved health insurance coverage under the Affordable Care Act (Breslau, Han, Lai, & Yu, Reference Breslau, Han, Lai and Yu2020; Hockenberry, Joski, Yarbrough, & Druss, Reference Hockenberry, Joski, Yarbrough and Druss2019; Ortega, Reference Ortega2023). Also, information on MH VISITS and MH DRUGS came from surveys and so may have suffered from some of the measurement problems highlighted in this study. For these reasons, the four variables are described as potential, rather than actual, CMH. Nevertheless, as shown below, they exhibited common trends, despite being influenced by different confounding factors, and this convergence suggests that they reasonably approximated true changes in mental health.
Suicide rates were obtained from the CDC Wonder Multiple Cause of Death data (National Center for Health Statistics, 2021), SUICIDE ED from the Health Care Utilization Project Nationwide Emergency Department Sample (Agency for Health Care Research and Quality, 2025), MH VISITS from the NHIS, and MH DRUGS from the core MEPS.
Table 1 provides summary information on the psychological distress measures and potential CMH. Additional details on the potential consequences are supplied in Supplementary Appendix A.
Serious mental distress/depression measures and potential consequences of poor mental health

Table 1. Long description
The table is divided into two sections.
Top Section: Serious distress/depression measures.
- Kessler 6 (K 6) Score greater than or equal to 13: Sources include N H I S (2004 to 2018) at the 96.5 percentile; M E P S (2004 to 2019) at the 95.4 percentile; and N S D U H (2008 to 2019) at the 94.0 percentile.
- Patient Health Questionnaire 2 (P H Q 2) Score greater than or equal to 3: Sources include M E P S (2004 to 2019) at the 92.2 percentile and N H A N E S (2005/6 to 2017/20) at the 91.9 percentile.
- Patient Health Questionnaire 9 (P H Q 9) Score greater than or equal to 10: Source is N H A N E S (2005/6 to 2017/20) at the 91.9 percentile.
Bottom Section: Potential consequences.
- Suicide death rates (SUICIDE): Source M C O D (2004 to 2019), identified by I C D 10 Codes asterisk U 0 3, X 6 0 to X 8 4, Y 8 7 dot 0.
- Emergency department visits with suicidal ideation or attempt (SUICIDE E D): Source H C U P N E D S (2006 to 2019), identified by C C S Code 662 (2006 to 2015) and C C S R Code M B D 0 1 2 (2017 to 2019).
- Saw or talked to mental health professional in last 12 months (M H VISITS): Source N H I S (2004 to 2018).
- Prescribed psychotropic medication use in last 12 months (M H DRUGS): Source M E P S (2004 to 2019), identified by M U L T C 1 S 1 Codes 67, 71, and 249.
Note: Top panel shows the serious psychological distress/depression measures, data sources, time periods of availability, and percentiles experiencing SPD. Samples are weighted to be nationally representative for 18- to 64-year-olds. Bottom panel indicates potential consequences of poor mental health, data sources, and years available, as well as details on measurement. MULTCI1S1 codes are: 67 – Anxiolytics, Sedatives, and Hypnotics; 71 – CNS Stimulants; and 249 – Antidepressants. NHANES data are analyzed over 2-year intervals from 2005–2006 through 2015–2016, and then 2017–2020 (pre-pandemic). SUICIDE ED in 2016 is computed as the average of the 2015 and 2017 values. MH VISITS indicate whether the individual ‘received counseling or therapy in the past 12 months from a mental health professional such as a psychiatrist, psychologist, psychiatric nurse, or clinical social worker’.
Abbreviations: CCS, Clinical Classification Software; CCSR, Clinical Classification Software Refined; HCUP NEDS, Healthcare Cost and Utilization Project National Emergency Department Sample; ICD-10, International Classification of Diseases 10th Revision; MCOD, CDC Wonder Multiple Cause of Death files; MEPS, Medical Expenditure Panel Survey; MULTC1S1, Multum Lexicon Therapeutic subclass codes; NHANES, National Health and Nutrition Examination Survey; NHIS, National Health Interview Survey; NSDUH, National Survey on Drug Use and Health; SPD, serious psychological distress/depression.
Analytic approaches
For most analyses, individual data were weighted and then aggregated to obtain nationally representative average annual SPD values. When computed, standard errors and confidence intervals (CIs) accounted for complex survey design utilizing Stata’s svy estimation commands using statra and PSU identifiers available for each survey. Most of this investigation focused on ‘normalized’ variables, calculated as percentage differences versus 2012, with the base year chosen since it was roughly the midpoint of the analysis period. To simplify exposition, dates for the biennial NHANES SPD measures refer to the later year (e.g. 2006 for 2005–2006), and those for 2017 through March 2020 were denoted as 2018. Sensitivity and robustness checks were performed, including calculating results without incorporating sample weights and examining how key findings were affected by missing data.
SPD trends were also estimated by regressing individual (not aggregate) values on linear time trends and demographic characteristics, incorporating population weights, and with the associated CIs adjusted for complex survey design. The supplementary regressors included dummy variables for female, race/ethnicity (non-Hispanic Black, non-Hispanic Other Non-White, and Hispanic), age (usually 25–34, 35–49, and 50–64 years), and education (high school graduate/GED, some college, college graduate, and missing education).
The CMH variables provided an external benchmark for examining the plausibility of the trends estimated using the various SPD proxies. This was done by examining correlations in annual values of the CMF and SPD measures. Reflecting the sometimes substantial confidence bounds on the distress indicators, the following bootstrapping procedure was used. First, year-specific means and standard errors were computed for the aggregated annual measures, accounting for complex survey design. Second, 1000 draws with replacement were taken, with each SPD proxy treated as a random variable with the year-specific means and standard errors just described. Third, after each draw, the realized SPD value was correlated with the four CMH measures, and the average of the four correlations was also calculated. Finally, the empirical means and 95% CIs from the 1000 draws were computed.
Results
SPD trends
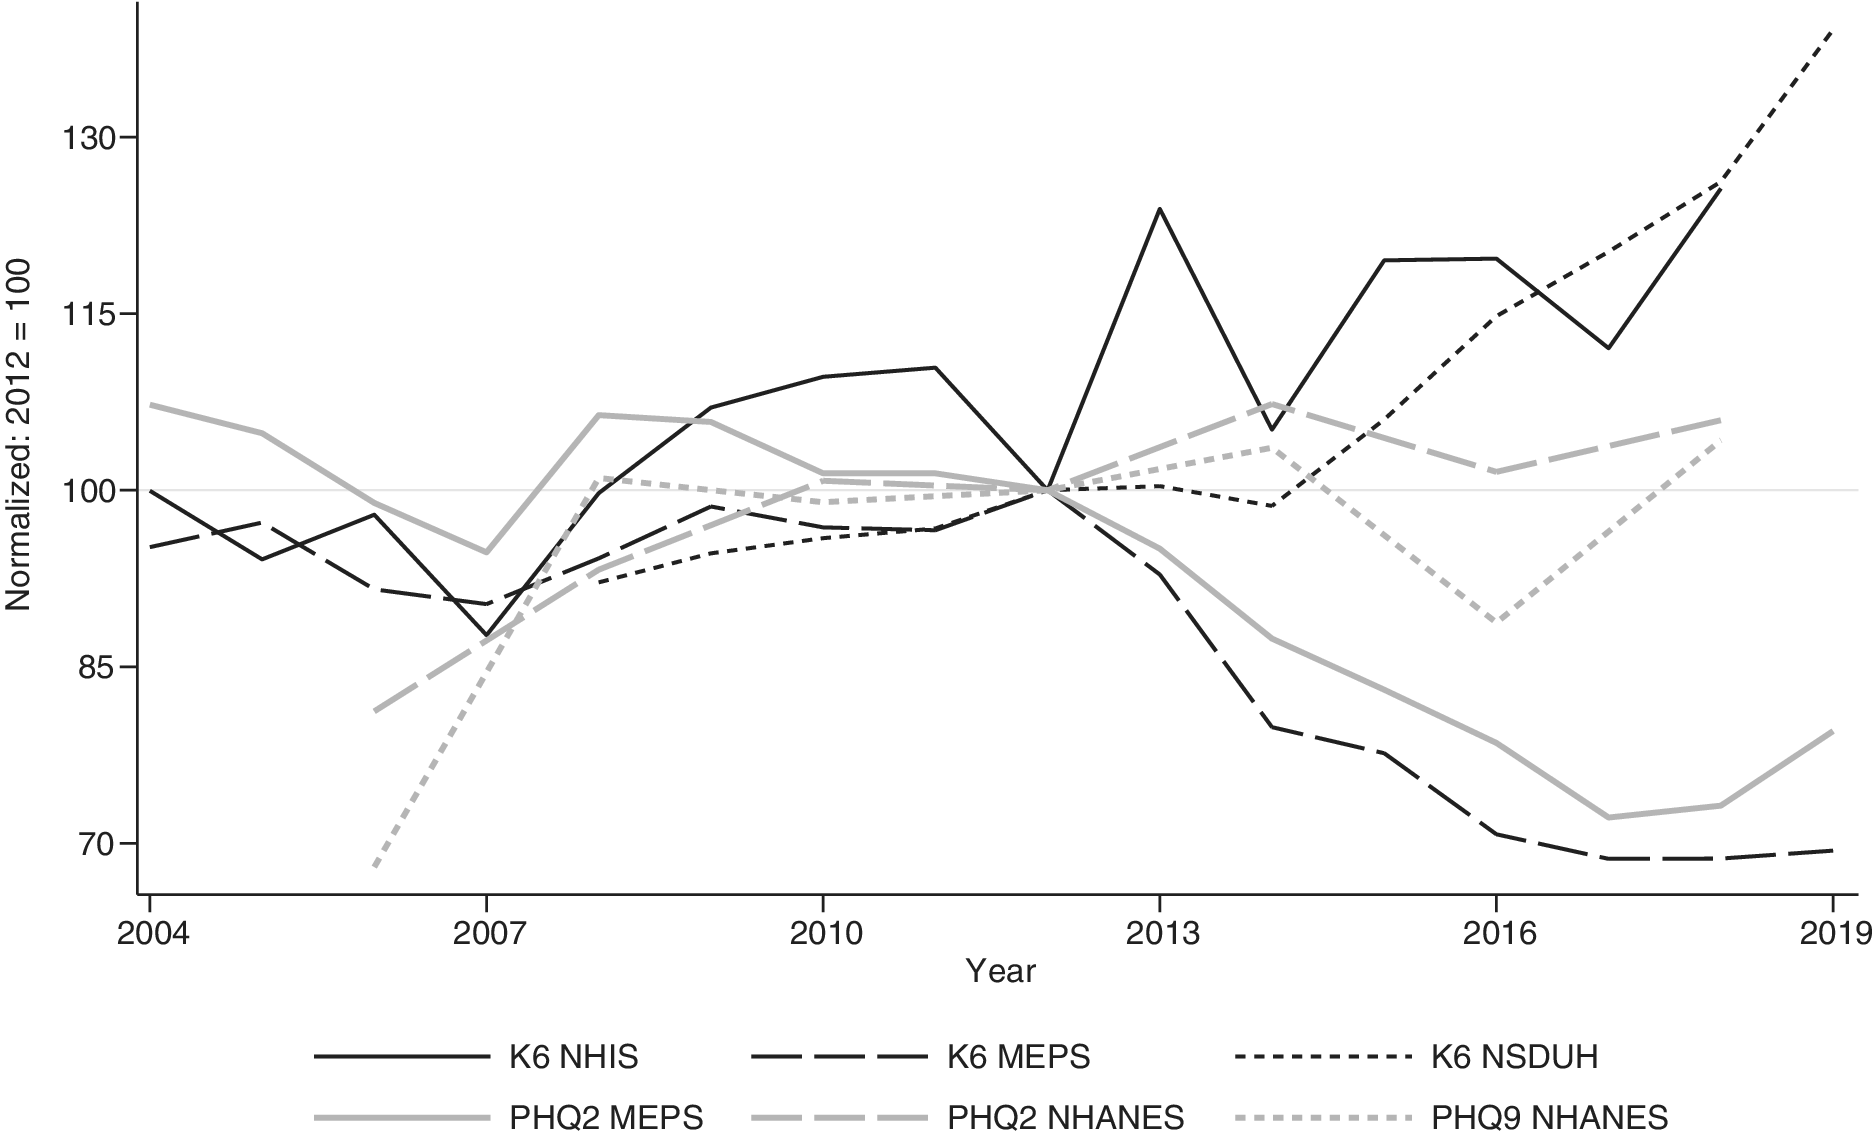
Figure 1 documents the SPD trends across measures and surveys. (Supplementary Appendix B provides specific numerical values for these and later figures.) Most indicate that mental health worsened over time. SPD measured by the K6 in the NHIS rose from 100% of the 2012 average in 2004 to 126% in 2018, and using the NSDUH, it increased from 92% in 2008 to 132% in 2019. Similarly, SPD based on the NHANES PHQ2 and PHQ9 grew from 81% and 68% of the 2012 mean in 2006 to 106% and 104% of it in 2018. In sharp contrast, SPD in the MEPS declined from 95% of the 2012 average in 2004 to 69% in 2019 using the K6, and from 107% to 80% based on the PHQ2.
Serious psychological distress/depression for 18- to 64-year-olds by year, as a percentage of 2012 values. The measures are: Kessler K6 scores
$ \ge 12 $
 obtained from the National Health Interview Survey (NHIS), Medical Expenditure Panel Survey (MEPS), and National Survey on Drug Use and Health (NSDUH); Patient Health Questionnaire-2 (PHQ2) scores
$ \ge 3 $
 from the MEPS and National Health and Nutrition Examination Survey (NHANES); and Patient Health Questionnaire-9 (PHQ9) scores
$ \ge 10 $
 from NHANES. Data are weighted so as to be nationally representative.

Figure 1. Long description
The horizontal x-axis represents Year from 2004 to 2019. The vertical y-axis is labeled Normalized 2012 equals 100, with a scale from 70 to 130. A horizontal reference line is set at 100.
Data trends for K 6 measures:
* K 6 N H I S (solid black line): Fluctuates between 88 and 110 until 2012, then spikes to 12 4 in 2013, drops, and rises sharply to nearly 1 26 by 2018.
* K 6 M E P S (long-dashed black line): Remains between 90 and 100 until 2012, then shows a steady decline to approximately 69 by 2018, remaining low through 2019.
* K 6 N S D U H (short-dotted black line): Starts at 2008 around 9 2 and shows a consistent upward trend, reaching approximately 1 39 by 2019.
Data trends for P H Q measures:
* P H Q 2 M E P S (solid grey line): Starts at 107 in 2004, fluctuates, and then shows a significant downward trend after 2012, dropping to 72 by 2017 before a slight uptick.
* P H Q 2 N H A N E S (long-dashed grey line): Starts in 2006 at 81, rises to 10 1 by 2010, and remains relatively stable near the 100-105 range through 2018.
* P H Q 9 N H A N E S (short-dotted grey line): Starts in 2006 at 68, rises to 100 by 2012, dips to around 89 in 2016, and rises back to 104 by 2018.
There was sometimes considerable variability across short time periods. For instance, SPD in the NHIS K6 rose from 88% to 124% of the 2012 mean from 2007 to 2013 but had almost the same value in 2006 as in 2012, and almost all of the upward trend in the NHANES PHQ9 occurred between 2006 and 2008.
Supplementary Appendix Figure A2 summarizes estimated annual percent changes in normalized SPD, showing the trend coefficients and CIs from regressing individual (rather than aggregate) SPD on a linear time trend plus the demographic covariates. Once again, K6 and PHQ2 from the MEPS declined over time, by ~1.4% and 1.7% of the 2012 mean per year, with fairly narrow confidence bounds. Conversely, all the other SPD indicators showed worsening mental health trends, by 2.1–3.1% of the 2012 average annually, besides the NSDUH K6, where the yearly increase exceeded 4%. These estimates were reasonably precise, except for wide CIs for the two NHANES PHQ measures, reflecting small survey sample sizes.
Robustness tests and specification checks
Potential sources of the year-to-year variations in the SPD measures and disparities in longer-term trends were examined next. One possibility was that something in the weighting procedures generated the findings. However, the results without weighting yielded largely similar time trends and, if anything, even greater short-term fluctuations (Supplementary Appendix Figure A3).
Alternatively, some anomalies may have reflected imprecision of the results. However, as previously shown in Supplementary Appendix Figure A2, confidence bounds on the estimated trend coefficients were fairly narrow, other than for the NHANES PHQ2 and PHQ9, and with statistically significant positive SPD effects estimated, except when using the MEPS K6 and PHQ2. Supplementary Appendix Figure A4 supplies further evidence, displaying annual means and associated 95% CIs for the SPD measures. These indicate that measurement error was probably not the source of most of the year-to-year variations or of the declines in SPD using the MEPS proxies. The exceptions again were for the NHANES PHQ2 and PHQ9, where the large CIs precluded ruling out either increases or decreases in SPD over many time periods. Imprecision may also have played a role in some of the substantial year-over-year fluctuations observed for the NHIS K6.
Trends in potential consequences of poor mental health
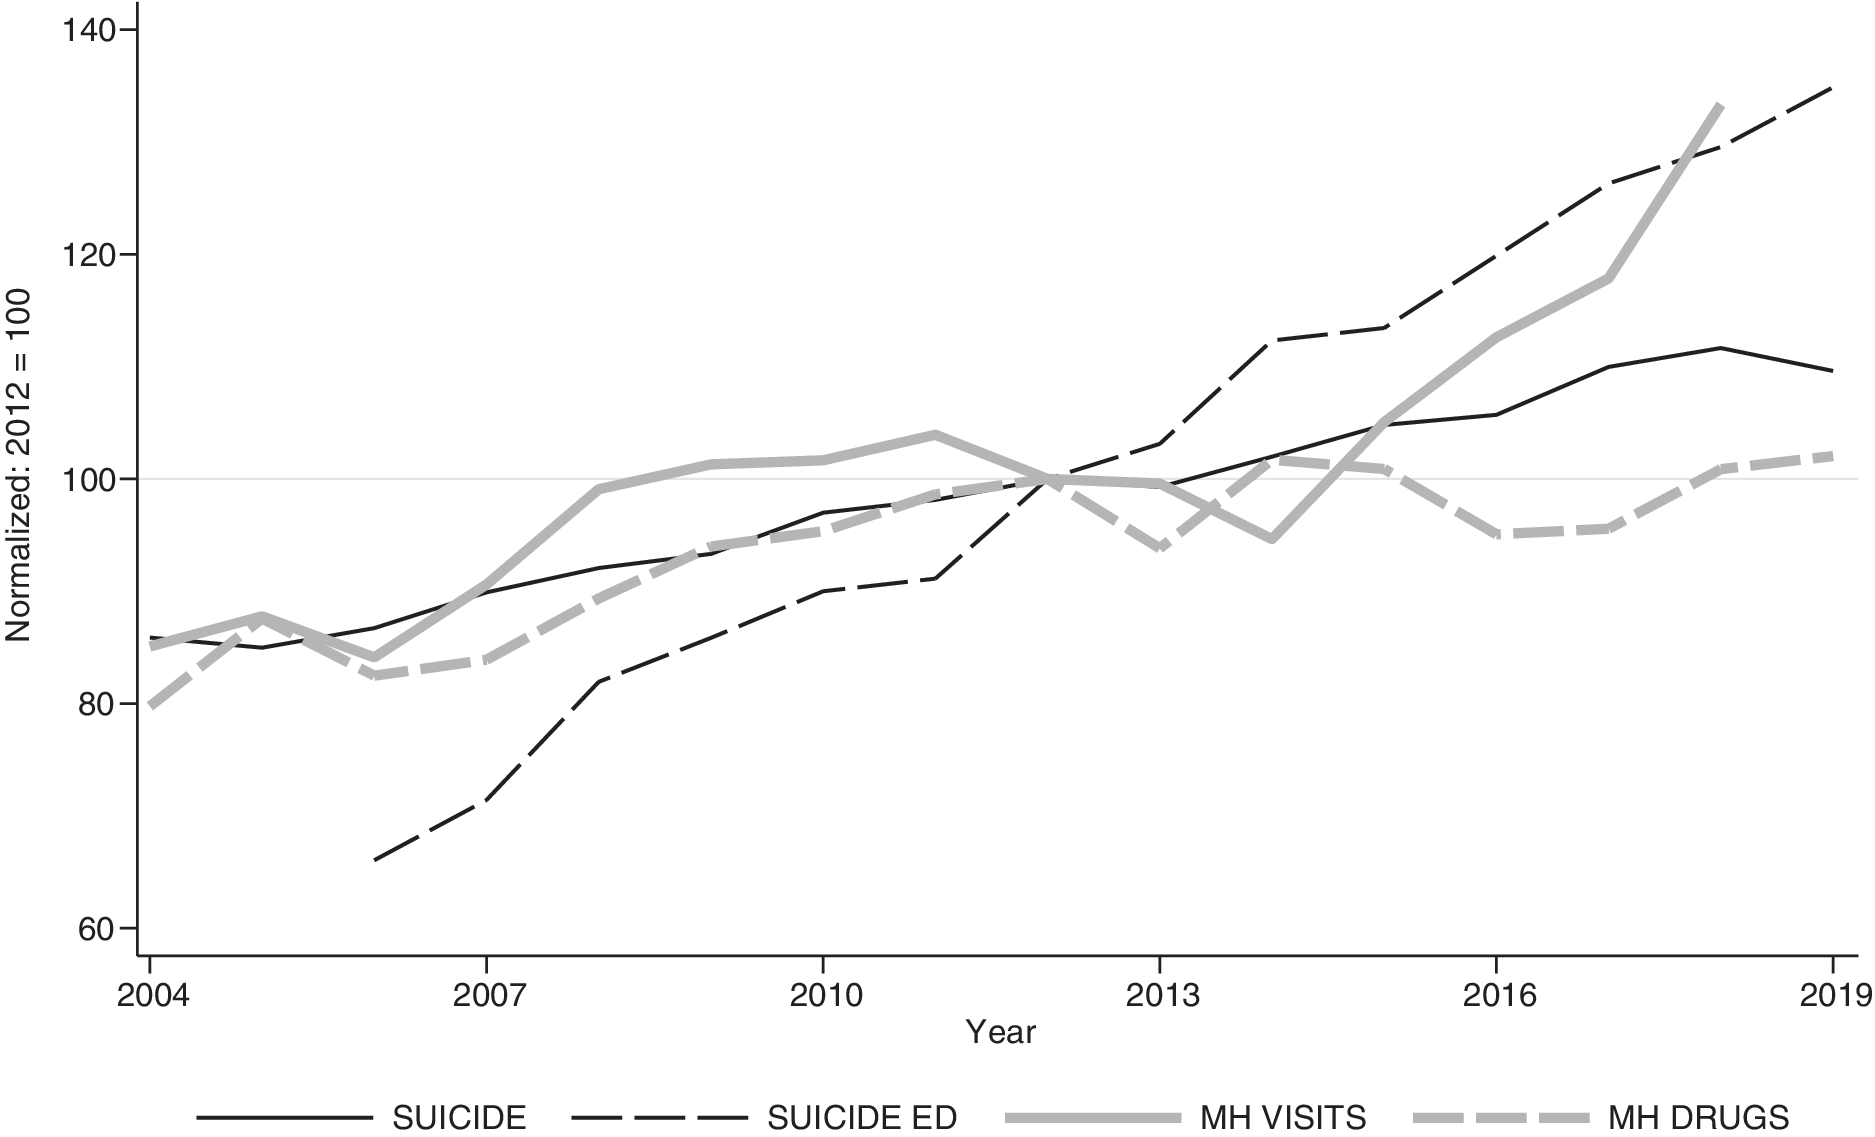
Figure 2 shows trends in the four potential CMH, again normalized as a percentage of 2012 values, and provides clear evidence of increases over time. SUICIDE and MH DRUGS were 86% and 80% of 2012 values in 2004, compared with 110% and 102% in 2019. MH VISITS rose from 85% in 2004 to 133% in 2018. Data on SUICIDE ED became available in 2006 and, from that year until 2019, grew from 66% to 135% of the 2012 average. Correlations between the potential consequences were also high, ranging from 0.67 between MH VISITS and MH DRUGS to 0.99 between SUICIDE and SUICIDE ED (Supplementary Appendix Table A1). This uniformity of results across measures provides strong evidence of worsening mental health trends and implies that the results for any particular proxy were unlikely to have been dominated by confounding factors.
Trends in potential consequences of poor mental health for 18- to 64-year-olds by year, as a percentage of 2012 values. The potential consequences are: suicide death rates (SUICIDE) obtained from the CDC Wonder Multiple Cause of Death data, emergency department visit rates with a diagnosis of suicidal ideation or attempts (SUICIDE ED) from the Healthcare Cost and Utilization Project Nationwide Emergency Department Sample, the share of persons having seen or talked to a mental health professional in the last 12 months (MH VISITS) from the National Health Interview Survey (NHIS), and the share of individuals using prescribed psychotropic medications in the last year (MH DRUGS) using data from the Medical Expenditure Panel Survey (MEPS). SUICIDE ED rates in 2016 are interpolated as the average of 2015 and 2017 rates.

Figure 2. Long description
The x-axis represents Year from 2004 to 2019. The y-axis is Normalized: 2012 = 100, ranging from 60 to 140. A horizontal reference line is at 100.
* S U I C I D E E D (long dashed line): Shows the steepest upward trend. Starting at approximately 66 in 2006, it rises steadily, crossing the 100 mark in 2012 and reaching nearly 135 by 2019.
* M H V I S I T S (thick solid gray line): Exhibits significant volatility. It rises from 85 in 2004 to 104 in 2011, drops to around 95 in 2014, then climbs sharply to approximately 133, by 2018.
* S U I C I D E (thin solid black line): Shows a steady linear increase from 85 in 2005 to approximately 112 in 2018.
* M H D R U G S (thick dashed gray line): Shows a gradual increase. It starts at 80 in 2004, fluctuates from 95 to 102 from 2010 through 2019.
All four metrics converge at the value of 100 in the year 2012.
Correlations between SPD and CMH
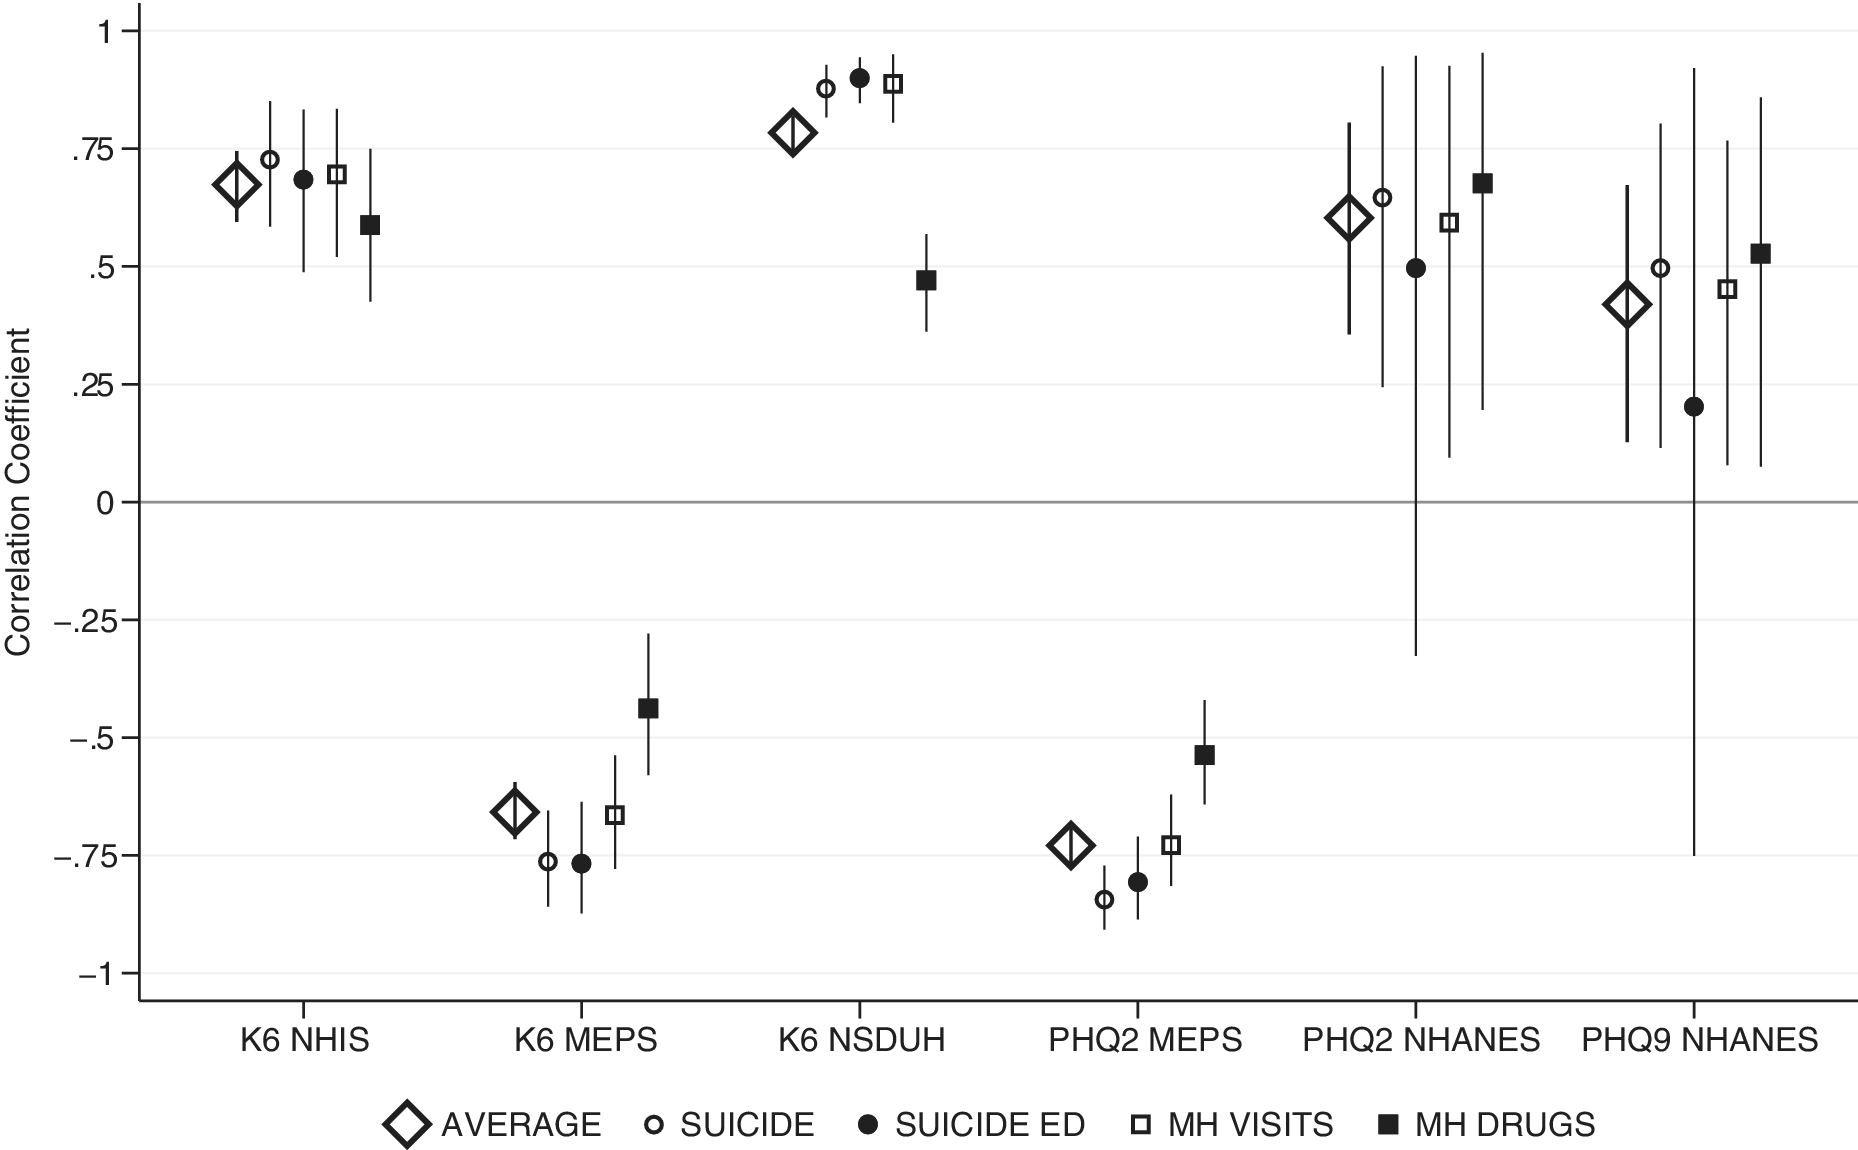
Correlations between SPD and CMH were computed, using the bootstrapping procedures described above, to indicate how well trends in the survey-based mental distress indicators aligned with those for the potential CMH. Consistent with the divergent patterns presented above, the MEPS SPD measures were always strongly inversely associated with the four potential consequences – the average correlation coefficients were −0.66 for the K6 and −0.73 for the PHQ2 – providing further evidence that these did not reliably indicate mental health trends (Figure 3).
Correlation coefficients between serious psychological distress/depression (SPD) and potential consequences of poor mental health for 18- to 64-year-olds. Measures and potential consequences are described in Table 1. AVERAGE refers to the mean of the correlation coefficients for the four potential consequences of poor mental health and the specified SPD measure. Estimates are obtained through bootstrapping with 1000 replications. Error bars show 95% confidence intervals.

Figure 3. Long description
The Y-axis represents Correlation Coefficient ranging from negative 1 to 1 with a zero baseline. The X-axis lists six survey groups: K 6 N H I S, K 6 M E P S, K 6 N S D U H, P H Q 2 M E P S, P H Q 2 N H A N E S, and P H Q 9 N H A N E S.
Each group contains five data points with vertical error bars representing 95 percent confidence intervals. The symbols are:
* A large open diamond for AVERAGE.
* A small open circle for SUICIDE.
* A small solid circle for SUICIDE E D.
* A small open square for M H VISITS.
* A small solid square for M H DRUGS.
Data trends:
* K 6 N H I S, K 6 N S D U H, P H Q 2 N H A N E S, and P H Q 9 N H A N E S show positive correlations mostly between 0.25 and 0.9. P H Q 9 N H A N E S has the widest confidence intervals, extending from negative 0.75 to nearly 0.92.
* K 6 M E P S and P H Q 2 M E P S show negative correlations, with values clustered between negative 0.4 and negative 0.85.
* In all groups, the AVERAGE diamond sits at the leftmost of the cluster, representing the mean of the four subsequent measures.
Conversely, the other SPD proxies were all positively associated with CMH. The correlation coefficients averaged 0.67 and 0.78 using the K6 from the NHIS and NSDUH, respectively, with narrow CIs. The associations were somewhat weaker for the NHANES PHQ2 and PHQ9 – averaging 0.60 and 0.42 – and with much wider confidence bounds.
The correlations were generally similar when focusing on individual CMF measures. To the extent that suicide rates were least influenced by confounding factors, it is noteworthy that the correlation coefficients between these and the SPD variables exhibited the same patterns but were of larger magnitude than the averages just described: 0.73, 0.88, 0.65, 0.50, −0.76, and −0.84 for the NHIS and NSDUH K6, NHANES PHQ2 and PHQ9, and MEPS K6 and PHQ2.
Explaining MEPS and NSDUH SPD trends
Potential sources of the erroneous declines in the MEPS SPD measures after 2012 were investigated next. Survey nonresponse increased over time for all four surveys, but there was no evidence of a discontinuity around 2012 in the MEPS, making it unlikely that this played a major role in explaining the declines in SPD observed using variables from this survey (see the Supplementary Appendix discussion and Figure A1).
Unlike the other SPD variables, data from the MEPS were obtained twice for each respondent. This raised potential concerns about panel conditioning (Warren & Halpern-Manners, Reference Warren and Halpern-Manners2012), particularly since prior studies indicate that depression erroneously declines when measured repeatedly for the same individual (Long, Haraden, Young, & Hankin, Reference Long, Haraden, Young and Hankin2020; Twenge & Nolen-Hoeksema, Reference Twenge and Nolen-Hoeksema2002). This was examined by constructing trends in these variables separately for persons in the first and second years of their participation in the MEPS. Although measured SPD rates were lower in the second year than the first for both the K6 and PHQ2, consistent with earlier research, the same downward trends in measured distress were obtained using data for either year (Supplementary Appendix Figure A5), indicating that this did not explain the anomalous results.
Data for the K6 and PHQ2 did not come from the core MEPS interviews but rather from separate SAQs completed once per year (twice per respondent) and submitted separately. For the other surveys, data could be missing due to either survey or item nonresponse. However, the MEPS had an extra possibility of missing data due to failure to return the SAQ (Kindratt, Reference Kindratt2022).
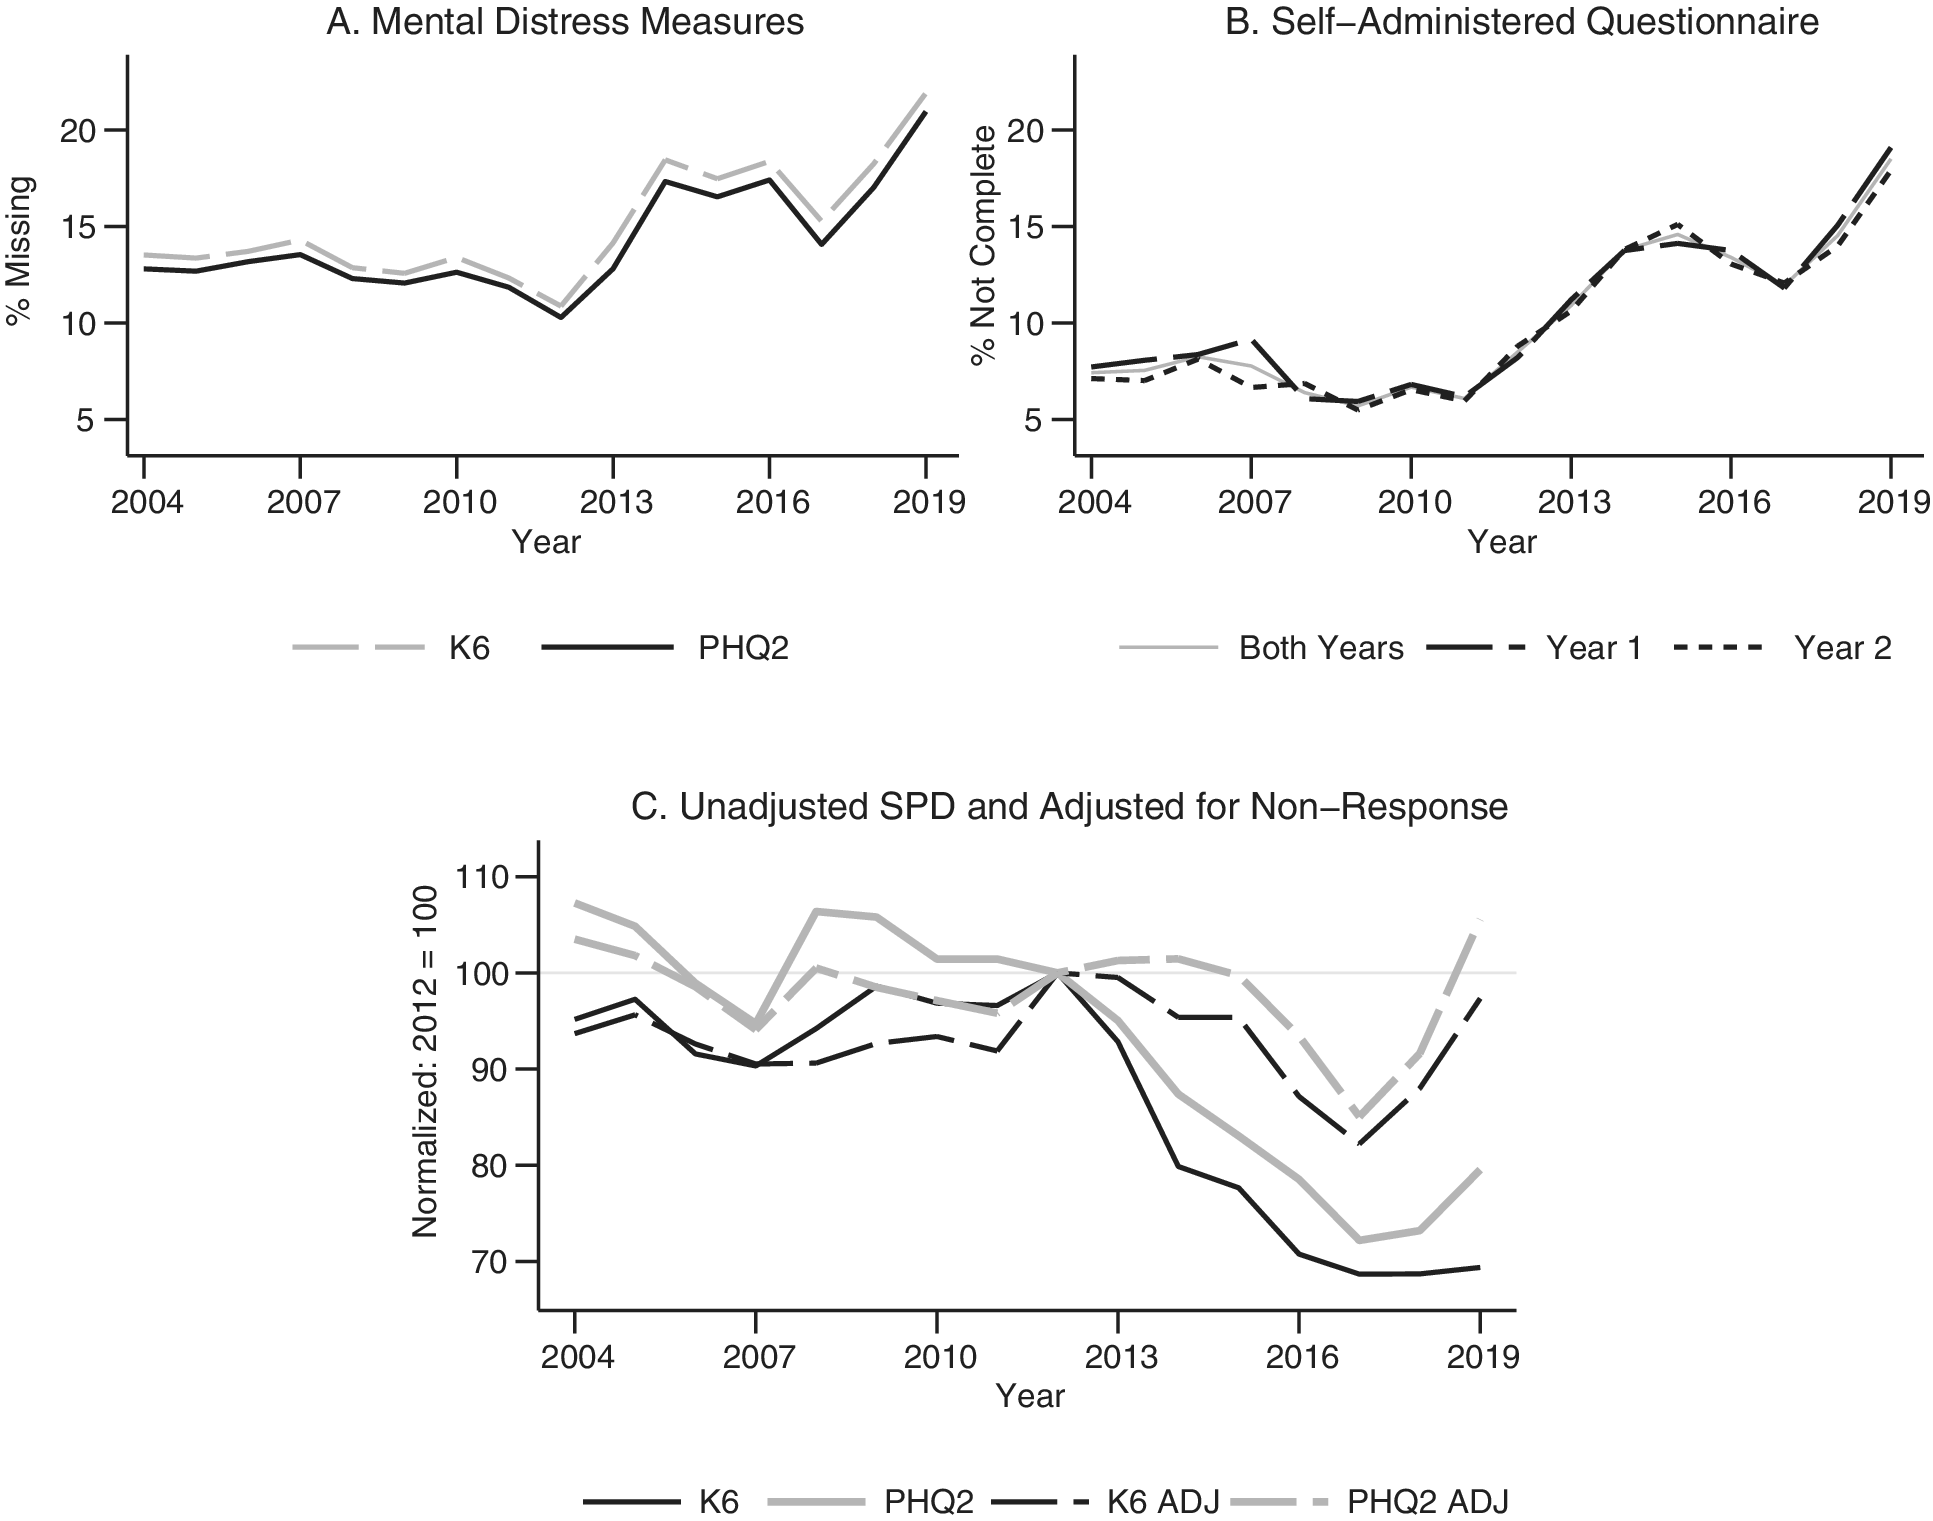
Reductions in SAQ completion rates almost certainly played the key role in causing the erroneous improvements in measured mental health using the MEPS K6 and PHQ2. Figure 4a shows that the share of missing data increased markedly starting in 2013, the same time that reported SPD began its sharp decline, and Figure 4b demonstrates this coincided with substantial reductions in SAQ completion rates. There was no corresponding rise in missing values conditional on return of the SAQ (Supplementary Appendix Figure A6). It is noteworthy that SAQ return rates were virtually identical in the first and second years individuals participated in the MEPS, belying the likelihood that survey fatigue caused these results (Figure 4b).
Percent of missing observations for MEPS serious psychological distress/depression Measures, self-administered questionnaires Not Completed, and Adjustments for Questionnaire Non-Completion. Panel (a) shows the percentage of eligible respondents with missing data for the MEPS K6 and PHQ2 measures. Panel (b) displays the percentage of eligible MEPS respondents not completing the self-administered questionnaire (SAQ). In this panel, years 1 and 2 refer to the first and second year the respondent participates in the MEPS. Panel (c) indicates values of the MEPS K6 and PHQ2 SPD measures for 18- to 64-year-olds as a percentage of the 2012 value; adjusted (ADJ) results refer to those predicted if all eligible respondents had returned the SAQ. Measures and sources are described in Table 1.

Figure 4. Long description
Panel A, Mental Distress Measures. The x-axis is Year from 2004 to 2019. The y-axis is percent Missing from 5 to 20. Two lines, K 6 (dashed grey) and P H Q 2 (solid black), show a stable trend around 12 to 14 percent until 2012, followed by a sharp increase to approximately 22 percent by 2019.
Panel B, Self-Administered Questionnaire. The x-axis is Year and the y-axis is percent Not Complete from 5 to 20. Three lines represent Both Years (solid grey), Year 1 (long dashed black), and Year 2 (short dashed black). All three lines track closely together, starting near 7 percent in 2004, dipping slightly around 2009, and then rising steadily to nearly 20 percent by 2019.
Panel C, Unadjusted S P D and Adjusted for Non-Response. The x-axis is Year and the y-axis is Normalized 2012 equals 100, ranging from 70 to 110. Four lines are shown: K 6 (solid black), P H Q 2 (solid grey), K 6 A D J (dashed black), and P H Q 2 A D J (dashed grey). All lines converge at 100 in 2012. Post-2012, the unadjusted K 6 and P H Q 2 lines show a significant downward trend reaching between 69 and 80 by 2019, while the adjusted A D J lines remain higher, in the 90 to 106 range.
A final piece of evidence on the importance of the SAQ in explaining the MEPS K6 and PHQ2 declines was that a measure of poor/fair overall mental health, obtained from the core MEPS rather than the SAQ, increased over time, indicating worsening mental distress, as was the case for all of the non-MEPS SPD measures (Supplementary Appendix Figure A7).
To provide a crude adjustment for declining SAQ completion rates, the MEPS SPD variables were regressed on the percentage of nonreturned questionnaires and reestimated assuming a 100% return rate. These ‘adjusted’ measures showed little consistent post-2012 decline, although increases in SPD were still not observed (Figure 4c). The last result is unsurprising since the correction method accounted for changes in nonresponse rates but not in the likelihood that SAQ noncompleters became increasingly comprised of individuals with poor mental health.
Another somewhat irregular finding was the much larger increase in NSDUH K6 SPD after 2014 than for the other psychological distress proxies. While this coincided with a partial survey redesign in 2015, the latter might have been expected to result in a single ‘step effect’, rather than the sustained trend increase actually observed. Instead, a more likely cause was instability due to low prevalence of SPD using the K6 measure (6% in the NSDUH and even lower in the NHIS). As evidence of this, a broader measure that included moderate as well as severe mental distress (K6
$ \ge 6 $
 , with an overall 28% prevalence rate) exhibited much smaller growth during this period, rising from 102% of the 2012 mean in 2014 to 114% in 2019, compared to an increase from 99% to 139% for the SPD variable (Supplementary Appendix Figure A8).
Discussion
A clear implication of this study is that researchers should not automatically trust the mental health trends obtained from empirical analyses, even when using highly respected household surveys and established measures of psychological distress.
This investigation highlights three general questions researchers should resolve when using survey data to examine these trends. First, are the sample sizes sufficient to provide reasonably precise results? Second, are the results robust to small changes in the analysis period? Third, are the findings consistent with the patterns of psychological distress obtained from other surveys and with external (often nonsurvey-based) indicators of mental health? This study provides partial answers for 18- to 64-year-olds in the United States from 2004 to 2019, and supplies guidance for future research examining other groups, time periods, and locations.
There is strong evidence that a variety of potential CMH – suicide rates and emergency department visits, and greater use of mental health professionals or psychotropic medications – increased for 18- to 64-year-olds from 2004 to 2019. While each could individually be influenced by confounding factors, the spurious correlates are likely to differ between them, and so the uniformity of results provides strong evidence that SPD rose over time. These findings are bolstered by previous research showing that suicide rates and related emergency room visits grew during at least portions of the analysis period (Bommersbach, Olfson, & Rhee, Reference Bommersbach, Olfson and Rhee2024; Garnett & Curtin, Reference Garnett and Curtin2024; Marcotte & Hansen, Reference Marcotte and Hansen2024; Martínez-Alés, Jiang, Keyes, & Gradus, Reference Martínez-Alés, Jiang, Keyes and Gradus2022; Owens et al., Reference Owens, Fingar, Heslin, Mutter and Booth2017; Owens, McDermott, Lipari, & Hambrick, Reference Owens, McDermott, Lipari and Hambrick2020; Ting et al., Reference Ting, Sullivan, Boudreaux, Miller and Camargo2012), as did mental health visits and treatments (Mojtabai & Jorm, Reference Mojtabai and Jorm2015; Wang, Qiu, & Zhu, Reference Wang, Qiu and Zhu2023).
Conversely, prior studies examining trends in mental health using the K6, PHQ2, or PHQ9 scales revealed ambiguous findings. Some indicated growth in SPD (Daly, Reference Daly2022; Olfson et al., Reference Olfson, McClellan, Zuvekas, Wall and Blanco2024; Ruhm, Reference Ruhm2025; Udupa, Twenge, McAllister, & Joiner, Reference Udupa, Twenge, McAllister and Joiner2023), others showed evidence of decreases (Brody, Pratt, & Hughes, Reference Brody, Pratt and Hughes2018; Olfson et al., Reference Olfson, Wang, Wall, Marcus and Blanco2019), and a third group obtained mixed results, no trend, or increases in mental distress in some periods and reductions in others (Iranpour, Sabour, Koohi, & Saadati, Reference Iranpour, Sabour, Koohi and Saadati2022; Mojtabai & Jorm, Reference Mojtabai and Jorm2015; Tomitaka et al., Reference Tomitaka, Kawasaki, Ide, Akutagawa, Ono and Furukawa2019; Yu et al., Reference Yu, Zhang, Wang, Sun, Jin and Liu2020). The current analysis helps to identify reasons for these disparate findings.
For studies based on the K6 from the NHIS, this frequently reflected the periods analyzed, given the considerable year-to-year variations in measured SPD. For instance, Mojtabai and Jorm (Reference Mojtabai and Jorm2015) found little increase in mental distress between 2001 and 2012, and Tomitaka et al. (Reference Tomitaka, Kawasaki, Ide, Akutagawa, Ono and Furukawa2019) uncovered similar stability for 2017 versus 1997. These results are consistent with the trend increases in SPD observed above, which largely occurred after 2012, and since serious distress, based on the K6, probably declined from 1997 through around 2007. Conversely, Daly (Reference Daly2022) and Udupa, Twenge, McAllister, and Joiner (Reference Udupa, Twenge, McAllister and Joiner2023) using NHIS data from 1999 to 2018 and 1997 to 2018 indicated growth in SPD similar to that observed here.
Investigations using the PHQ9 from NHANES have generally not obtained strong evidence of trends in serious depression (Brody, Pratt, & Hughes, Reference Brody, Pratt and Hughes2018; Iranpour, Sabour, Koohi, & Saadati, Reference Iranpour, Sabour, Koohi and Saadati2022; Udupa, Twenge, McAllister, & Joiner, Reference Udupa, Twenge, McAllister and Joiner2023; Yu et al., Reference Yu, Zhang, Wang, Sun, Jin and Liu2020), particularly for periods starting after 2006. This reflected large CIs on this measure due to the relatively small NHANES samples. However, the current analysis suggests that future researchers might more fruitfully focus on the PHQ2. At the individual level, the correlation between PHQ2 and PHQ9 scores in the NHANES was high (0.84 using weighted data), and the associations between SPD measured using the PHQ2 and CMH were greater than those utilizing the PHQ9 (averaging 0.60 vs. 0.42). Thus, while the PHQ2 is an initial screener in clinical settings, to be followed up with the full PHQ9 when warranted, it may be particularly useful for population-level analyses. In that regard, it is noteworthy that the PHQ2 exhibited fairly steady SPD growth over time in NHANES.
The most extreme problems arise for the K6 and PHQ2 from the MEPS. For example, Olfson et al. (Reference Olfson, Wang, Wall, Marcus and Blanco2019), using the K6, concluded that SPD declined from 4.9% of adults in 2009–2010 to 3.7% in 2014–2015. As demonstrated above, this decrease was illusory and contrasted with increases found during the same period based on the K6 from the NHIS or NSDUH. The MEPS PHQ2 suffered from the same issues, and a preliminary analysis indicated similar problems when using the Mental Component Summary (MCS) Score, a 12-item subset of the 36-item Short-Form Health (SF-36) Survey (Ware, Kosinski, & Keller, Reference Ware, Kosinski and Keller1996), also coming from the MEPS SAQ. The key issue appears to be declining SAQ completion rates in recent years.
The results of this analysis should be interpreted in light of several potential caveats. First, as noted, response rates have fallen over time for most US household surveys, including the four analyzed here. This raises the possibility that some increases in SPD were an artifact of selection effects. However, prior research indicates that changes in survey nonresponse generally do not cause significant bias as long as the overall response propensity is not strongly related to the variables of key interest (Groves, Reference Groves2006; Groves & Peytcheva, Reference Groves and Peytcheva2008). Moreover, for differential selection to explain the observed trends, the marginal nonresponders would need to have better-than-average mental health, but most available evidence suggests that selection goes in the opposite direction (Knudsen et al., Reference Knudsen, Hotopf, Skogen, Overland and Mykletun2010; Momen et al., Reference Momen, Lasgaard, Weye, Edwards, McGrath and Plana-Ripoll2022). Second, changes in survey methods or sampling procedures could affect some of the specific patterns observed above, although most variables appear to be fairly consistently measured over time. Third, the thresholds for defining SPD, while standard in the literature, may not be ideal, and at least some results (e.g. those using the NSDUH K6) may be sensitive to the specific criteria used. Fourth, since the potential consequences of mental health may be influenced by confounding factors, we cannot be completely confident that these provide reliable benchmarks for determining the accuracy of the K6 and PHQ measures. However, the consistency of results across measures, despite likely exposure to different confounding factors, substantially mitigates this concern. Finally, for some purposes, it might be useful to examine correlations for different functional forms of CMH and SPD, such as year-over-year changes rather than annual levels.
Supplementary material
The supplementary material for this article can be found at http://doi.org/10.1017/S0033291726106072.
Funding statement
This research received no specific grant from any funding agency, commercial, or not-for-profit sectors.
Competing interests
The author declares none.





 Open access

