Introduction
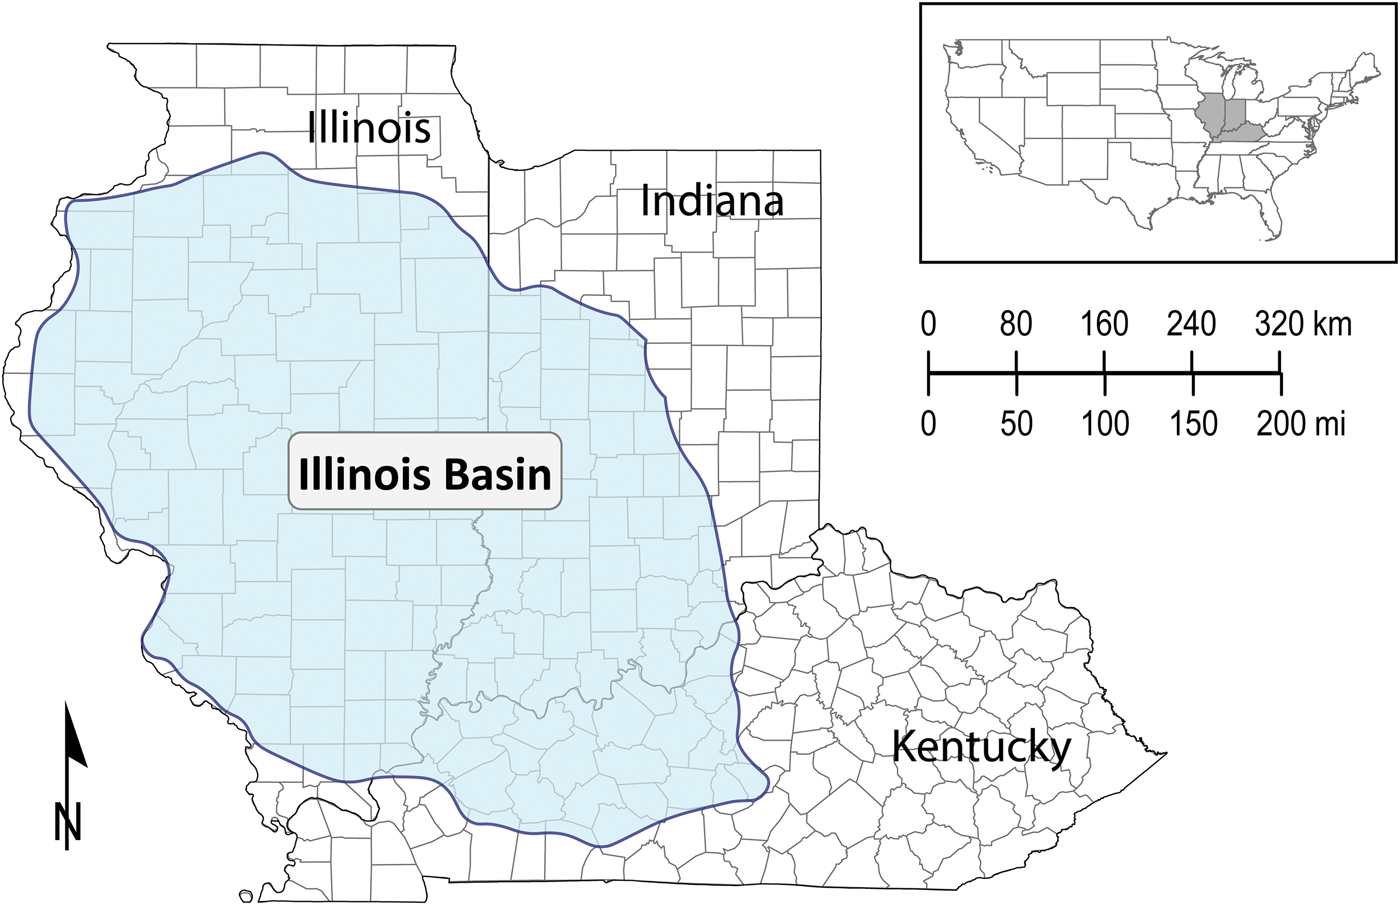
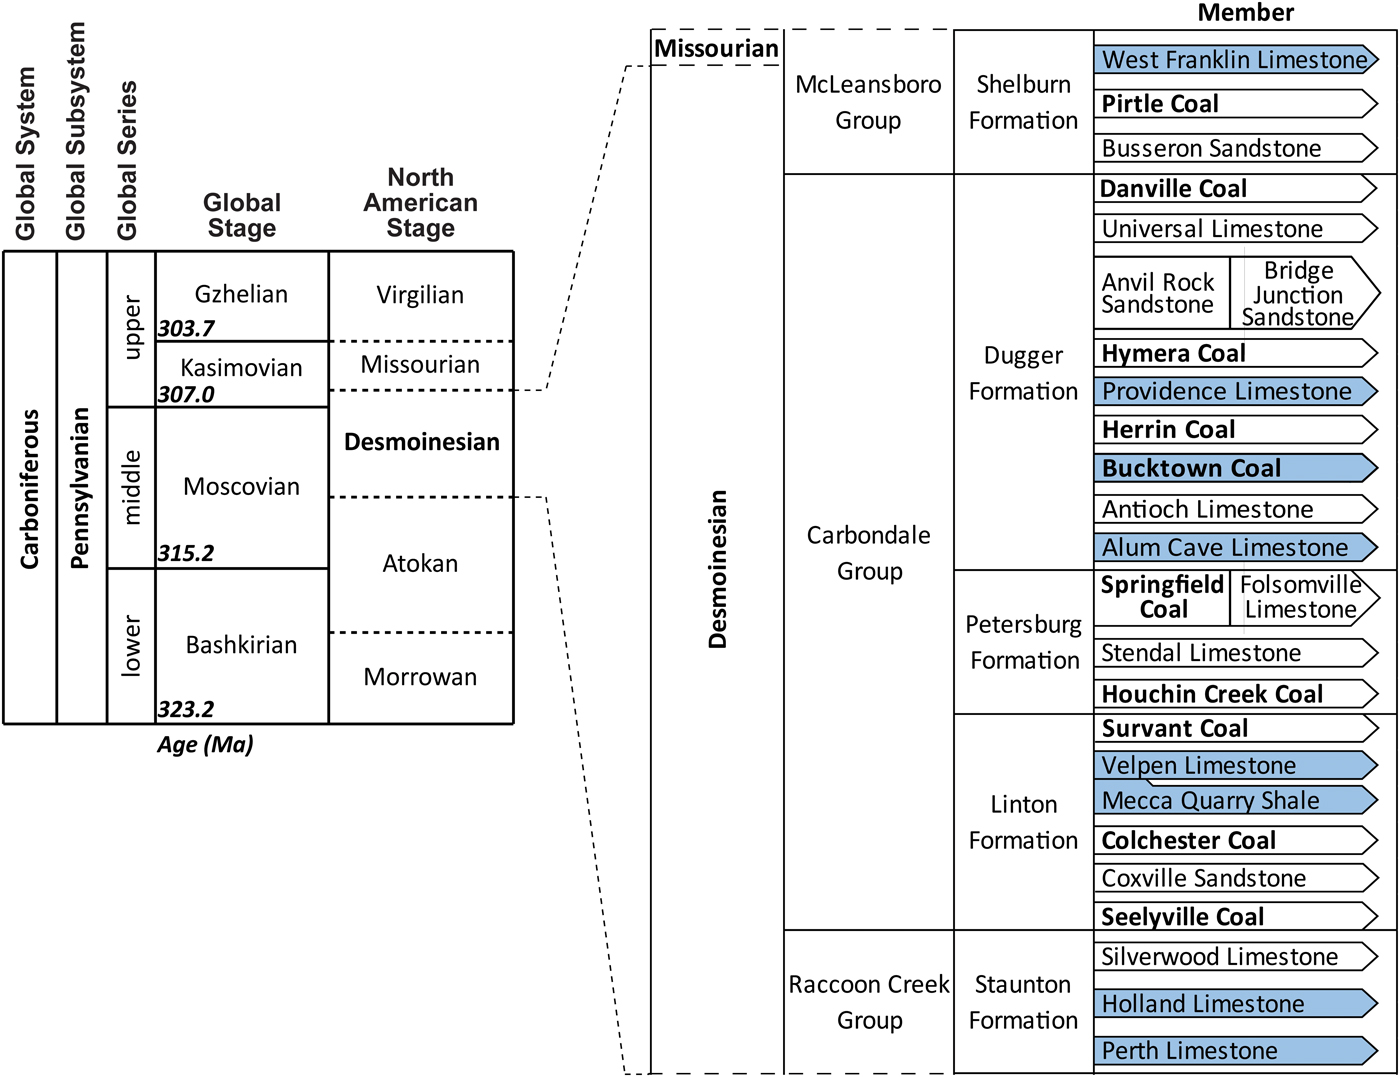
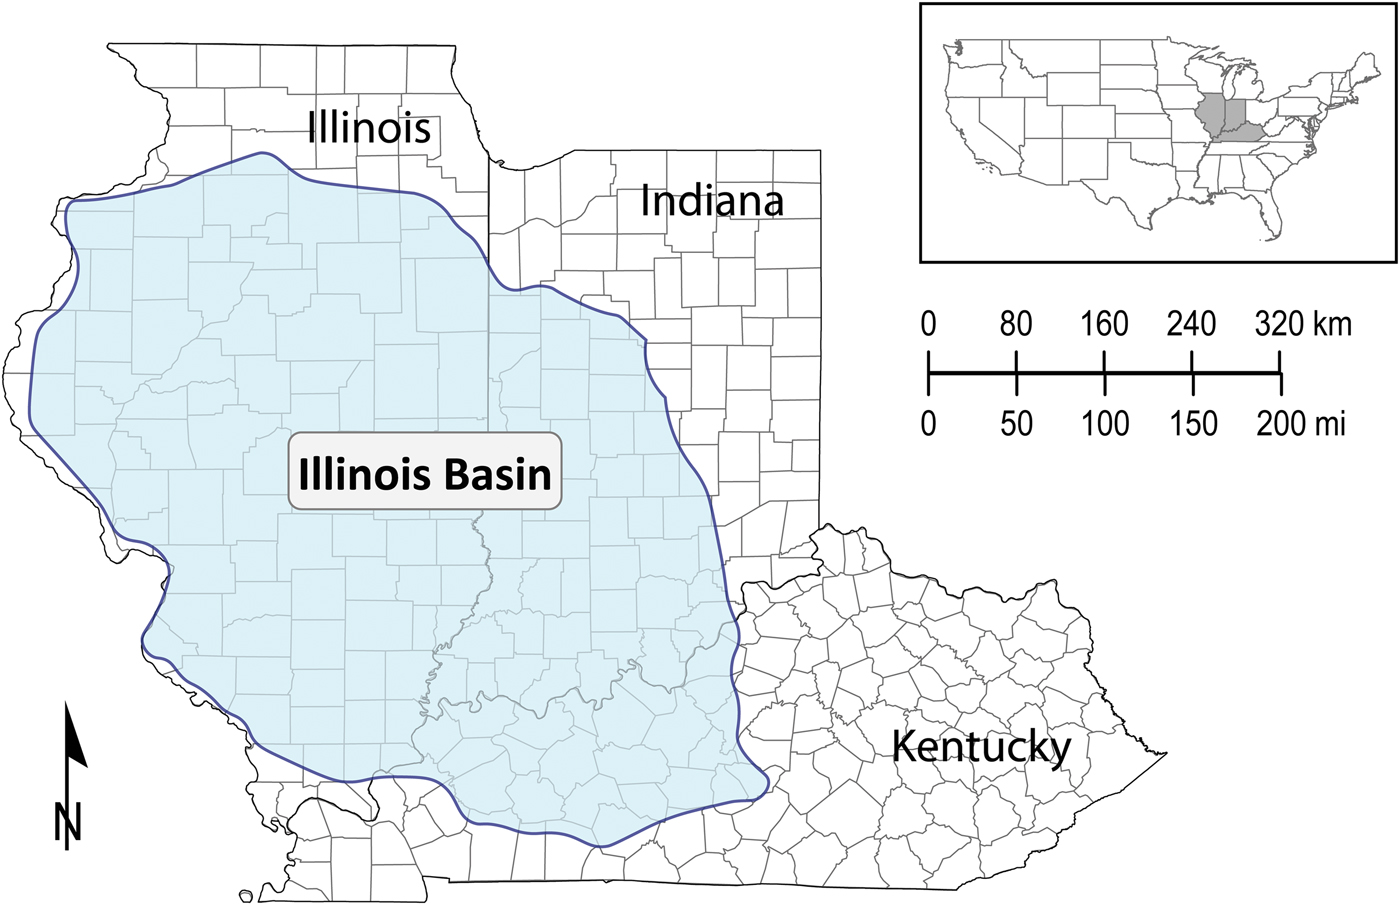
The major purposes of this study of Desmoinesian Series conodonts from the Illinois Basin in Indiana, Illinois, and Kentucky (Fig. 1) were to analyze Desmoinesian paleoenvironments and to develop a conodont zonal standard for the Illinois Basin based on a well-studied taxonomy. This work incorporates over two decades of conodont research within the Illinois Basin and provides a detailed synopsis of a method that has been utilized over that time, the Neognathodus Index (NI), to correlate Desmoinesian strata within the region. This study includes samples from the Perth and Holland Limestone members of the Staunton Formation (Rexroad et al., Reference Rexroad, Brown, Weinrick and Szaniawski1996, Reference Rexroad, Brown, Devera and Suman1998); the Mecca Quarry Shale and Velpen Limestone members of the Linton Formation (Rexroad et al., Reference Rexroad, Wade, Merrill, Brown and Pagett2001); the Springfield Coal Member of the Petersburg Formation (Rexroad, Reference Rexroad1993); the Alum Cave Limestone (Brown et al., Reference Brown, Rexroad and Zimmerman2016), Bucktown Coal (Brown et al., Reference Brown, Rexroad and Zimmerman2013a), and Providence Limestone members (Brown et al., Reference Brown, Rexroad, Eggert and Horowitz1991) of the Dugger Formation; and the West Franklin Limestone Member of the Shelburn Formation (Brown and Rexroad, Reference Brown and Rexroad2009) (Fig. 2). Some named members are known to be discontinuous and others are only presumed to be more or less continuous and more or less contemporaneous. The strike of these units approximately follows the long axis of the Illinois Basin during the Desmoinesian (Nelson, Reference Nelson, Leighton, Kolata, Oltz and Eidel1990; Algeo et al., Reference Algeo, Schwark and Hower2004), thus, this study involved collecting units over broad areas to consider the effects of the vagaries of sedimentation as influenced by shifting depositional environments on proposed zonations.
Extent of the Illinois Basin (blue shaded region) during the Desmoinesian series (after Tri-State Committee, 2001).
Stratigraphic nomenclature of the Desmoinesian series in Indiana. Stratigraphic units previously studied with the Neognathodus Index (NI) are highlighted in blue. Chart of Global and North American stages in the Pennsylvanian adapted from Cohen et al. (Reference Cohen, Finney, Gibbard and Fan2013). Stratigraphic nomenclature of the Desmoinesian (Middle-Late Pennsylvanian) in Indiana adapted from Shaver et al. (Reference Shaver, Ault, Burger, Carr, Droste, Eggert, Gray, Harper, Hasenmueller, Hasenmueller, Horowitz, Hutchison, Keith, Keller, Patton, Rexroad and Weir1986) and Tri-State Committee (2001). Correlation between the global and North America stages is from Swezey (Reference Swezey2009) and Lucas et al. (Reference Lucas, DiMichele, Barrick, Schneider and Spielmann2013). Lithologic unit thicknesses are not to scale.

Conodont zones for Desmoinesian time in North America are mostly based either on Neognathodus Dunn, Reference Dunn1970 (Merrill, Reference Merrill1972, Reference Merrill1975b; Grayson et al., Reference Grayson, Trice, Westergaard, McNulty and McPherson1985; Rexroad et al., Reference Rexroad, Wade, Merrill, Brown and Pagett2001; Brown and Rexroad, Reference Brown and Rexroad2009; Brown et al., Reference Brown, Rexroad and Zimmerman2016) or on the Idiognathodus/Streptognathodus plexus (Barrick and Boardman, Reference Barrick, Boardman, Boardman, Barrick, Cocke and Nestall1989; Heckel, Reference Heckel1991; Lambert, Reference Lambert1992; Barrick et al., Reference Barrick, Boardman and Heckel1996, Reference Barrick, Lambert, Heckel and Boardman2004, Reference Barrick, Lambert, Heckel, Rosscoe and Boardman2013). Neognathodus provides a detailed record of morphologic change through the Desmoinesian, and a numeric index to quantitatively evaluate the variations in morphology of Neognathodus would be useful for regional correlation. Thus, this study bases Desmoinesian zonations on populations of Neognathodus. Accordingly, the NI is developed as a primary biostratigraphic zonation for the Desmoinesian of the Illinois Basin in Indiana, Illinois, and Kentucky.
Geologic setting
Regional and temporal setting
The Illinois Basin is a depositional and structural basin located in sections of Indiana, Illinois, and Kentucky that subsided slowly from late Cambrian into Permian time (Buschbach and Kolata, Reference Buschbach, Kolata, Leighton, Kolata, Oltz and Eidel1990). It is believed to have formed in early to middle Cambrian as a failed rift resulting from the breakup of a supercontinent (Braile et al., Reference Braile, Hinze, Sexton, Keller and Lidiak1984) that evolved into a cratonic embayment (Buschbach and Kolata, Reference Buschbach, Kolata, Leighton, Kolata, Oltz and Eidel1990). Widespread deformation, primarily basement-block faulting, continued through Pennsylvanian time (Nelson, Reference Nelson, Leighton, Kolata, Oltz and Eidel1990). Paleozoic siliciclastics filling the basin were derived primarily from the Canadian Shield to the northeast and possibly from the northern Appalachian highlands (Trask and Palmer, Reference Trask, Palmer, Lyons and Rice1986). During the Desmoinesian, the Illinois Basin lay in tropical latitudes, was tropical to humid subtropical in climate, and was subject to wet and dry seasons (Cecil, Reference Cecil1990). Major river systems, periodically disrupted by marine invasions, transported the sediments to depositional sites in fluvial and deltaic paleoenvironments on a broad coastal plain and adjacent shallow shelf (Trask and Palmer, Reference Trask, Palmer, Lyons and Rice1986). The sampled stratigraphic units of the Illinois Basin are all within the Desmoinesian North American regional stage, which is correlatable with the mid-to-upper Moscovian and lower Kasimovian global stages (Fig. 2).
Stratigraphic information
Desmoinesian carbonate units in the Illinois Basin are thin discontinuous lenses that are deposited in deltaic and shallow marine settings. Where carbonates are absent, shallow-marine gray shale or fine- to medium-grained, gray to brown sandstone occupies their position and are in a facies relationship with them. Some gray shales and sandstones are continental in origin. Thin black shales and coals are interbedded with the named limestone members (Fig. 2), are notably discontinuous, and include channel deposits. Interbedded coals are also discontinuous. As discussed by Brown et al. (Reference Brown, Rexroad and Zimmerman2016), Desmoinesian sedimentation in the Illinois Basin is interpreted to be primarily the result of nearshore and deltaic processes that were influenced by local tectonism and climate in both the source and depositional regions and, to a lesser extent, relative sea-level change. Compaction and isostasy were secondary factors influencing sedimentation patterns. Stratigraphic units that were collected for conodonts are discussed below in ascending order.
The uppermost unit in the Raccoon Creek Group, the Staunton Formation, constitutes the lowermost Desmoinesian formation in the Illinois Basin in Indiana, and conodonts from the basal Perth Limestone and the slightly higher Holland Limestone members were examined in this study (Fig. 2). The Perth Limestone Member of the Staunton Formation is a hard, argillaceous, fossiliferous, gray limestone that ranges from 0.2 to 5.8 m in thickness and is not laterally continuous (Hutchison, Reference Hutchison, Shaver, Ault, Burger, Carr, Droste, Eggert, Gray, Harper, Hasenmueller, Hasenmueller, Horowitz, Hutchison, Keith, Keller, Patton, Rexroad and Weir1986). The Perth Limestone was likely deposited in a shallow, nearshore, quiet to moderate energy environment with some localized areas of low energy and low pH conditions (Rexroad et al., Reference Rexroad, Brown, Devera and Suman1998). The Holland Limestone Member consists of a basal, thin, light gray limestone overlain by a thin shale that contains limestone nodules and a light to dark gray chert (Hasenmueller and Hutchison, Reference Hasenmueller, Hutchison, Shaver, Ault, Burger, Carr, Droste, Eggert, Gray, Harper, Hasenmueller, Hasenmueller, Horowitz, Hutchison, Keith, Keller, Patton, Rexroad and Weir1986). The depositional setting of the Holland Limestone is interpreted as a shallow, nearshore environment of generally moderate to slightly elevated energy with some pockets of localized low energy, low pH conditions (Rexroad et al., Reference Rexroad, Brown, Weinrick and Szaniawski1996).
The Carbondale Group consists of the basal Linton Formation with five named members, the middle Petersburg Formation with four named members, and the uppermost Dugger Formation with ten named members (Fig. 2). Conodonts were examined from the Mecca Quarry Shale and directly overlying Velpen Limestone members of the Linton Formation and the Alum Cave and Providence limestone members of the Dugger Formation. The Mecca Quarry Shale Member of the Linton Formation is a highly carbonaceous, sheet-like, fissile black shale that exhibits alternations of gray shale (Ault, Reference Ault, Shaver, Ault, Burger, Carr, Droste, Eggert, Gray, Harper, Hasenmueller, Hasenmueller, Horowitz, Hutchison, Keith, Keller, Patton, Rexroad and Weir1986). The Mecca Quarry Shale is interpreted as forming during a transgression in shallow water with depths no greater than one meter (Zangerl and Richardson, Reference Zangerl and Richardson1963; Rexroad et al., Reference Rexroad, Wade, Merrill, Brown and Pagett2001). The shale was likely deposited under a nearshore flotant marsh, whereas shallow, open-marine conditions existed nearby. The flotant marsh probably broke up due to continued transgression, and the more open conditions formed the overlying gray shale (Rexroad et al., Reference Rexroad, Wade, Merrill, Brown and Pagett2001). The Velpen Limestone Member of the Linton Formation, which directly overlies the Mecca Quarry Shale in many locations, consists of variable amounts of sideritic, argillaceous, fossiliferous gray limestone and calcareous, fossiliferous shale (Burger et al., Reference Burger, Weir, Ault, Shaver, Ault, Burger, Carr, Droste, Eggert, Gray, Harper, Hasenmueller, Hasenmueller, Horowitz, Hutchison, Keith, Keller, Patton, Rexroad and Weir1986). Following the restricted and shallow depositional environment of the Mecca Quarry Shale, the Velpen Limestone represents a return to more open-marine conditions (Rexroad et al., Reference Rexroad, Wade, Merrill, Brown and Pagett2001). The Alum Cave Limestone Member of the Dugger Formation consists of a fossiliferous, argillaceous, blue-gray to dark gray limestone that, in most places, is separated by two shale beds < 0.10 m thick (Burger and Weir, Reference Burger, Weir, Shaver, Ault, Burger, Carr, Droste, Eggert, Gray, Harper, Hasenmueller, Hasenmueller, Horowitz, Hutchison, Keith, Keller, Patton, Rexroad and Weir1986b). The depositional setting is interpreted as a generally low energy, shallow, open-marine environment (Brown et al., Reference Brown, Rexroad and Zimmerman2016). The Providence Limestone Member of the Dugger Formation consists of a sequence of one to five beds of finely crystalline, fossiliferous, blue-gray to brown mudstones to packstones containing phosphatic vertebrate remains, carbonaceous matter, pyrite, limonite, and varying amounts of clay and interbedding shales (Burger and Weir, Reference Burger, Weir, Shaver, Ault, Burger, Carr, Droste, Eggert, Gray, Harper, Hasenmueller, Hasenmueller, Horowitz, Hutchison, Keith, Keller, Patton, Rexroad and Weir1986a). Deposition was likely influenced by broad deltaic swamps that were developing nearby to the northeast on a low-relief coastal plain (Merrill, Reference Merrill1975a; Trask and Palmer, Reference Trask, Palmer, Lyons and Rice1986; Brown et al., Reference Brown, Rexroad, Eggert and Horowitz1991).
The lowermost unit in the McLeansboro Group, the Shelburn Formation, constitutes the uppermost Desmoinesian formation in the Illinois Basin in Indiana, and conodonts from the basal West Franklin Limestone Member were examined in this study (Fig. 2). The West Franklin Limestone Member of the Shelburn Formation consists of one to three limestone benches, intervening shales and thin interbedded claystone, sandstone, and coal beds (Weir and Ault, Reference Weir, Ault, Shaver, Ault, Burger, Carr, Droste, Eggert, Gray, Harper, Hasenmueller, Hasenmueller, Horowitz, Hutchison, Keith, Keller, Patton, Rexroad and Weir1986). The West Franklin Limestone was likely deposited in a shallow, warm-water marine environment that was influenced by deltaic processes (Weller, Reference Weller1930; Ferm et al., Reference Ferm, Horne, Swinchatt and Whaley1971; Merrill, Reference Merrill1975a; Brown and Rexroad, Reference Brown and Rexroad2009) and localized tectonics (Buschbach and Kolata, Reference Buschbach, Kolata, Leighton, Kolata, Oltz and Eidel1990).
Materials and methods
Samples and localities
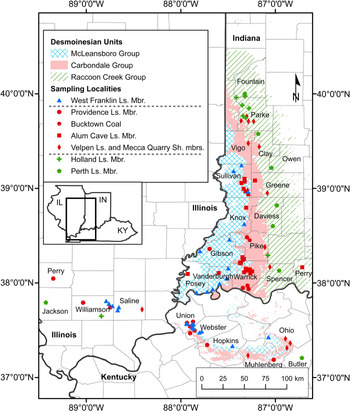
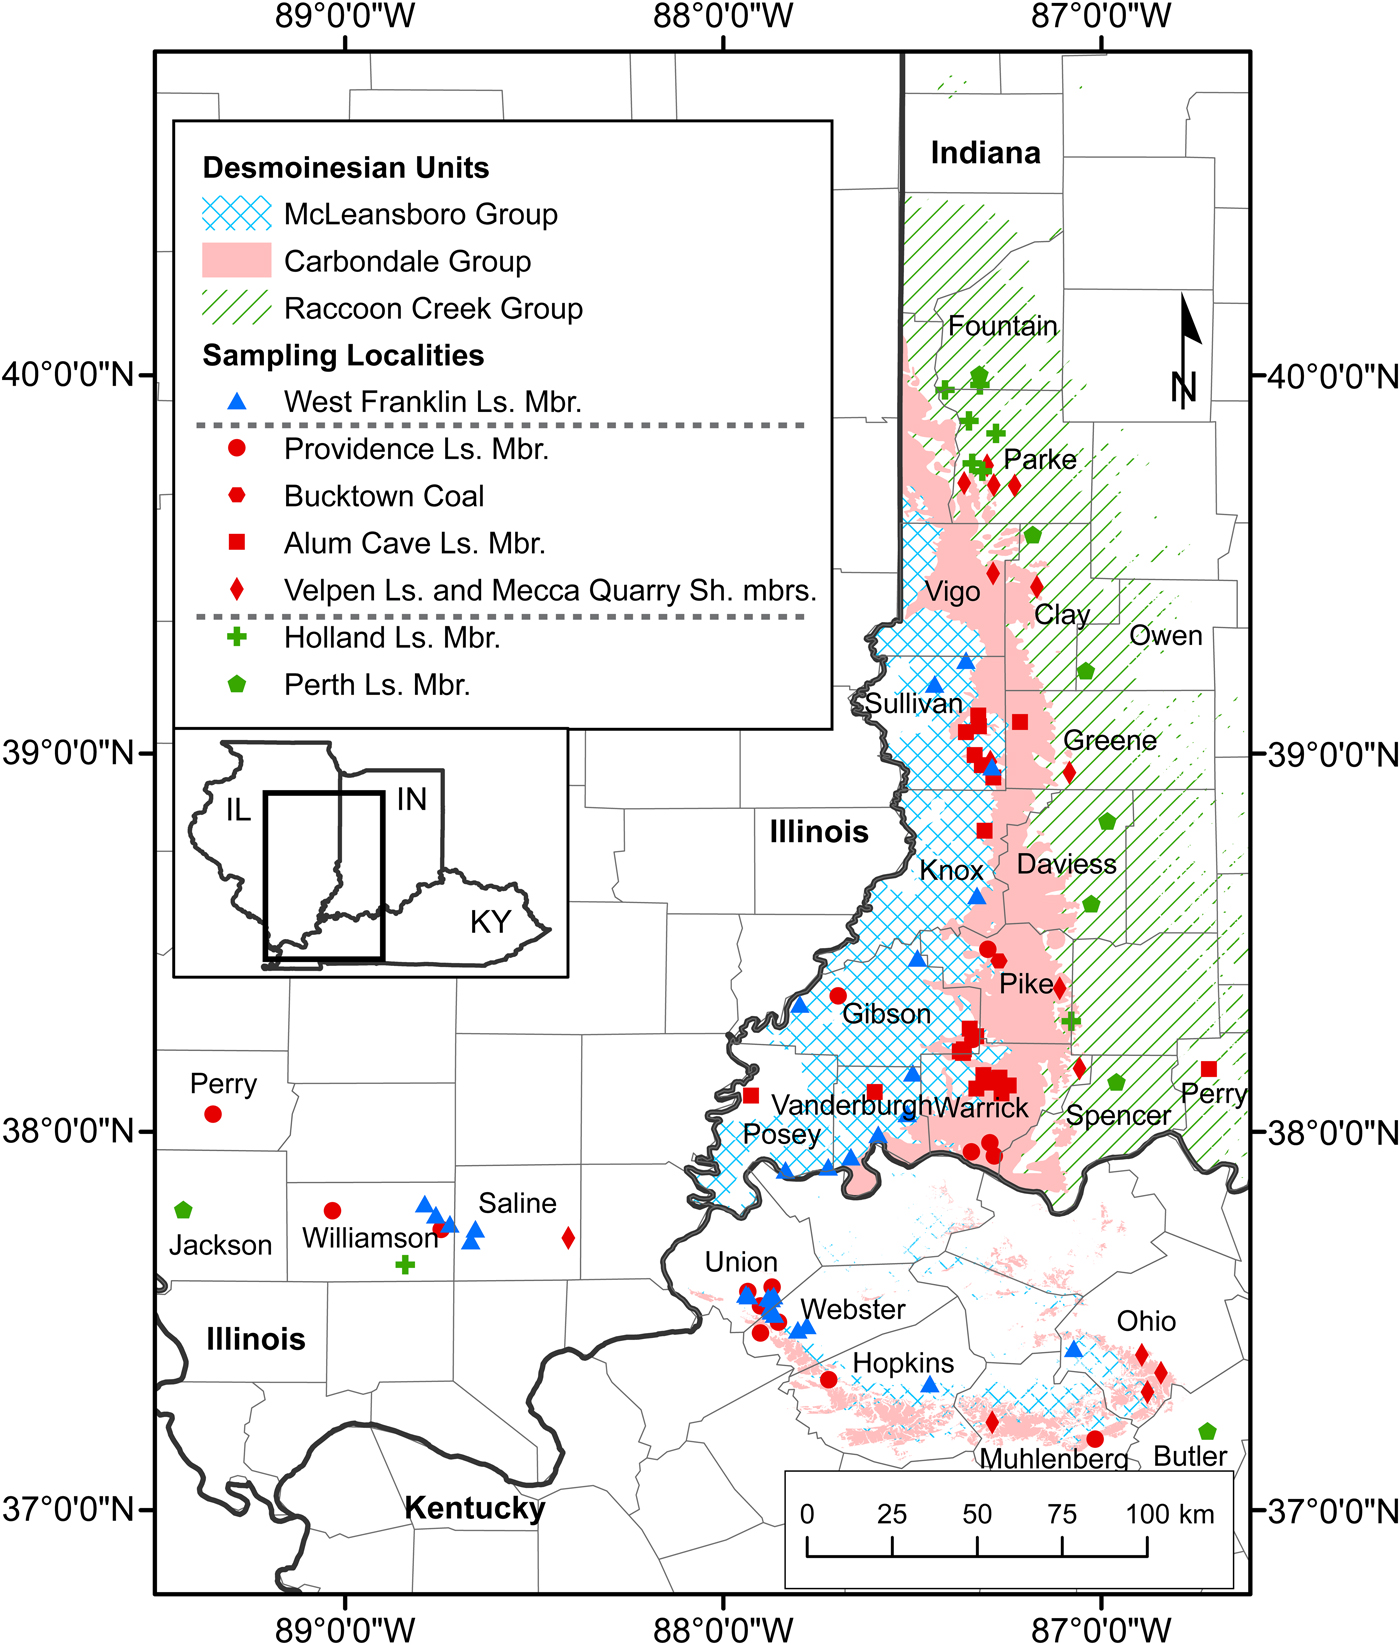
Collections include a total of 471 productive samples from 107 localities, 73 from Indiana, 22 from Kentucky, and 12 from Illinois (for exact locations, see Supplementary Data Set). Samples were collected from 30 cores and 75 surface locations (Fig. 3). Surface locality continuous samples were taken over intervals of lithologic homogeneity not exceeding 1.0 m. Cores were sampled over continuous 1.0 m intervals where possible. One kilogram of each of the limestones and shales were processed at the Indiana Geological and Water Survey using standard conodont extraction techniques (Collinson, Reference Collinson1963). After they were processed and the residues concentrated with the use of tetrabromoethane, undergraduate students from Lake Superior State University picked the conodonts out of the residues. Recoveries of Neognathodus P1 elements ranged from one indeterminate specimen from a shale lens in the Bucktown Coal Member to 2,278 specimens identifiable to morphotype from the West Franklin Limestone Member. A total of 5,500 neognathodid P1 elements identifiable to morphotype were recovered (Table 1).
Locality map showing the extent of sampling across Indiana, Illinois, and Kentucky. Each point represents a locality from a specific sampled member. Unit names are arranged in stratigraphic order and dashed gray lines separate members of different stratigraphic groups. Desmoinesian outcrop data were sourced from Gray et al. (Reference Gray, Ault, Keller and Harper2010) for Indiana and Noger et al. (Reference Noger, McDowell, Grabowski and Moore1988) for Kentucky (detailed, state-wide outcrop maps are not available for Illinois). Ls. = limestone; Mbr. = member; Sh. = shale.
Summary values for the previously studied members in Indiana. For each member, the number of localities, number of samples, number of total identified Neognathodus morphotypes, and the Neognathodus Index (NI) are given. The members are arranged in stratigraphic order from the Perth Limestone Member (oldest) to the West Franklin Limestone Member (youngest). NA = not available (no identified Neognathodus morphotypes from the given stratigraphic interval).

Neognathodus taxonomy
Merrill (Reference Merrill1972, Reference Merrill1975a, Reference Merrillb, Reference Merrill, Serpagli and Corradini1999) documented and discussed the gradual morphologic shift from one chronospecies to the next through the Desmoinesian and, in 1999, discussed the concept of Neognathodus speciation in detail. This morphologically gradualistic shift is documented in work of Desmoinesian strata in the Illinois Basin, as discussed in various studies below, and also in New Mexico (Brown et al., Reference Brown, Rexroad and Zimmerman2013b). This methodology of applying the gradualistic evolutionary model of Neognathodus populations has worked well for most of the Desmoinesian of the Illinois Basin both for speciation and for zonation (Merrill, Reference Merrill1972, Reference Merrill1975a, Reference Merrillb; Grayson et al., Reference Grayson, Trice, Westergaard, McNulty and McPherson1985; Brown et al., Reference Brown, Rexroad, Eggert and Horowitz1991, Reference Brown, Rexroad and Zimmerman2016; Rexroad et al., Reference Rexroad, Brown, Devera and Suman1998, Reference Rexroad, Wade, Merrill, Brown and Pagett2001; Brown and Rexroad, Reference Brown and Rexroad2009). Herein, the qualitative approach of Neognathodus-based biozonations initially proposed by Merrill (Reference Merrill1972) is expanded upon by developing a numeric methodology to quantitatively correlate Desmoinesian strata.
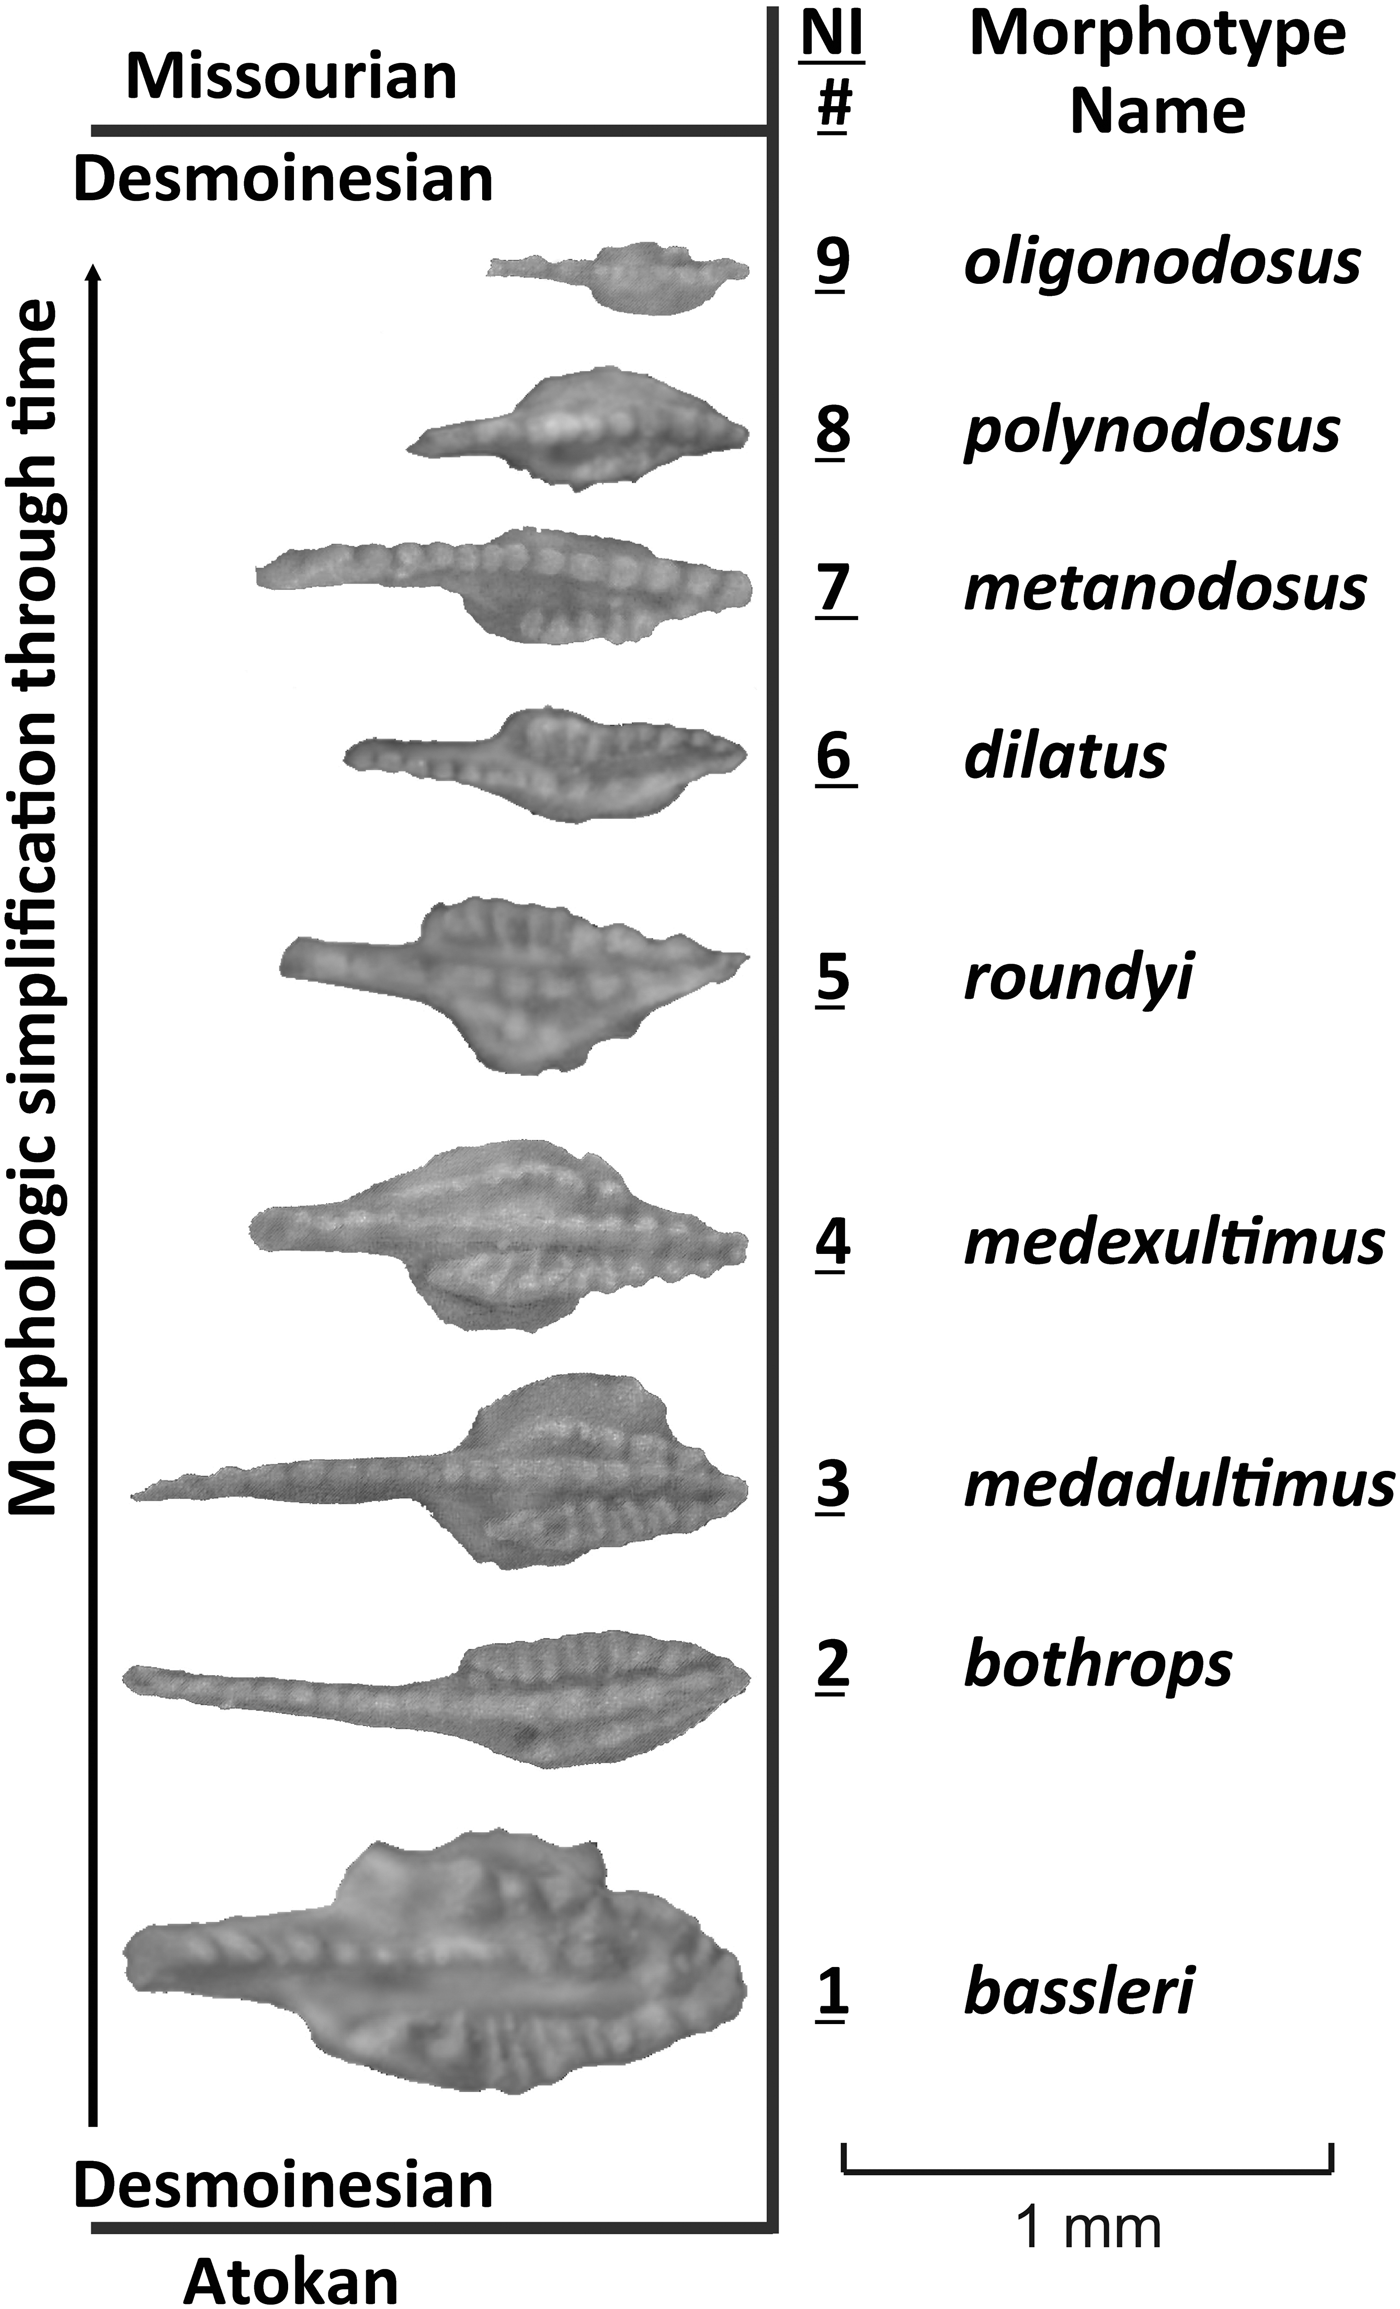
Following the work of Merrill (Reference Merrill1972, Reference Merrill1975b), a brief description of key morphologic criteria that define the gradual evolutionary shift in P1 element simplification of neognathodid populations through the Desmoinesian follows (Fig. 4). Basal Desmoinesian neognathodids are commonly characterized by P1 element morphology in which the carina does not extend to the posterior junction of the inner and outer parapets, as in Neognathodus bassleri (Harris and Hollingsworth, Reference Harris and Hollingsworth1933). Successively, through the early to middle Desmoinesian, the carina then fuses with the inner and outer parapet at the posterior tip of the platform in N. bothrops Merrill, Reference Merrill1972 and the outer posterior parapet shortens due to its progressive anterior fusion with the carina in N. medadultimus Merrill, Reference Merrill1972 and N. medexultimus Merrill, Reference Merrill1972. Shortening continued into the middle Desmoinesian until the outer parapet was reduced to only a few nodes and then only to a single node in N. roundyi (Gunnell, Reference Gunnell1931). As evolution progressed into the late Desmoinesian, the single node was eliminated, leaving the inner parapet fused to the carina at the posterior tip in N. dilatus (Stauffer and Plummer, Reference Stauffer and Plummer1932). The inner parapet then progressively shortened until it was lost at the end of Desmoinesian time in N. metanodosus Merrill, Reference Merrill1975b, N. oligonodosus Merrill, Reference Merrill1975b, and N. anodosus Merrill, Reference Merrill1975b.
Neognathodus morphotypes in the Desmoinesian and associated Neognathodus Indices (NI) for Indiana, Illinois, and Kentucky. Morphotype names are adopted from the true species names of neognathodids. Through the Desmoinesian, the P1 elements underwent a progressive loss of ornamentation and morphologic simplification, beginning with N. bassleri (Harris and Hollingsworth, Reference Harris and Hollingsworth1933) and ending with N. oligonodosus Merrill, Reference Merrill1975b. Neognathodus became extinct at the Desmoinesian-Missourian boundary. Figure adapted from Brown and Rexroad (Reference Brown and Rexroad2009) and Brown et al. (Reference Brown, Rexroad and Zimmerman2016).

Merrill (Reference Merrill, Serpagli and Corradini1999) noted the progressive decrease in size of the P1 element from the older to the younger end of the phylogeny in the Desmoinesian. The morphologic simplification was likely accompanied by P1-element size reduction and therefore the smaller specimens at the younger end of the phylogeny, e.g., the Neognathodus roundyi and N. dilatus morphotypes, are considered adults for computational purposes.
Commonly, in a single stratigraphic unit, variants or morphotypes of Neognathodus represent the same range of morphologies and variations as represented by five or six named species. Despite these multivariant morphologies, there was likely only a single species, or at times two, of Neognathodus living in any location at any one time. Therefore, Neognathodus species can be defined on the basis of populations of morphotypes and single morphotypes could be shared among several related species.
Neognathodus Index
To quantify and clarify this complex evolution and to quantify zonation, the Neognathodus Index (NI) was developed based on the evolutionary model of Neognathodus P1-element simplification (Fig. 4). Qualitative Neognathodus subzones were first erected by Merrill (Reference Merrill1972) for Pennsylvanian rocks in eastern Ohio, and further developed in subsequent studies (Merrill, Reference Merrill1975a, Reference Merrillb). The NI expands on Merrill's work and quantifies the gradual evolutionary morphotypic variations, or morphotypes, of P1 elements of named Neognathodus species. The NI was initially employed by Rexroad et al. (Reference Rexroad, Wade, Merrill, Brown and Pagett2001) and further utilized by Brown and Rexroad (Reference Brown and Rexroad2009) and Brown et al. (Reference Brown, Rexroad and Zimmerman2013b, Reference Brown, Rexroad and Zimmerman2016) (Fig. 5). Within each stratigraphic unit, the populations of each neognathodid morphotype are counted and plotted. A morphology that is transitional between two morphotypes is assigned to, and counted with, the morphotype with which it is most closely associated. The primary defining characteristic used to assign transitional morphologies is the relationship between the outer parapet and the carina or, where the outer parapet is absent, between the inner parapet and the carina.
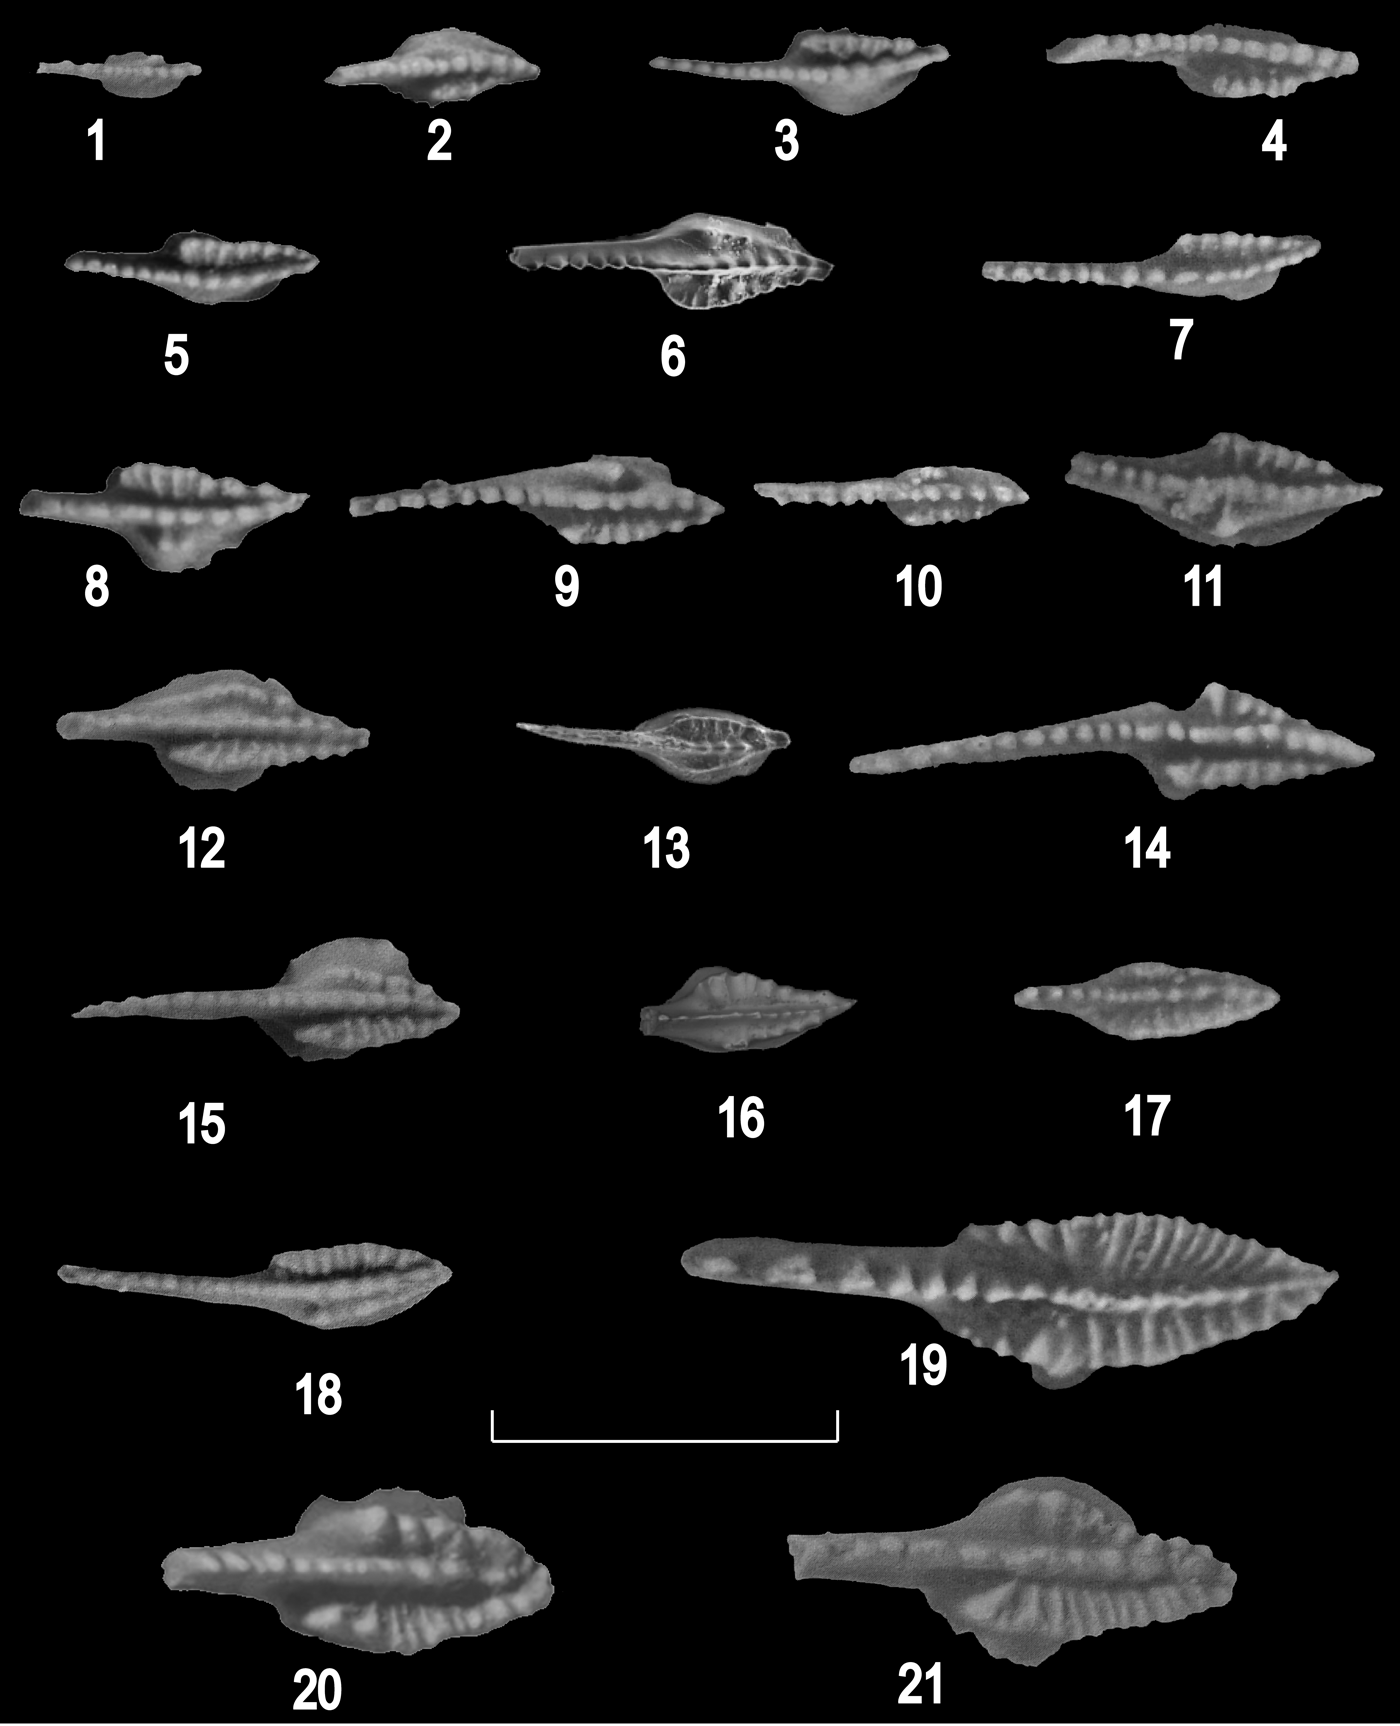
Desmoinesian Neognathodus morphotypes from previous studies of the Illinois Basin; conodont element identification below is followed by photo reference, IUPC repository number, stratigraphic member, and county and state location: (1) P1 element oral view of N. oligonodosus Merrill, Reference Merrill1975b, figured specimen from Brown and Rexroad (Reference Brown and Rexroad2009, fig. 6, no. 22), IUPC 18,148, West Franklin Limestone Member, Vanderburgh County, Indiana; (2) P1 element oral view of N. polynodosus Merrill, Reference Merrill1975b, figured specimen from Brown and Rexroad (Reference Brown and Rexroad2009, fig. 6, no. 23), IUPC 18,149, West Franklin Limestone Member, Posey County, Indiana; (3, 4) P1 elements oral view of N. metanodosus Merrill, Reference Merrill1975b: (3) figured specimen from Brown and Rexroad (Reference Brown and Rexroad2009, fig. 6, no. 25), IUPC 18,151, West Franklin Limestone Member, Webster County, Kentucky; (4) figured specimen from Rexroad et al. (2001, fig. 4, no. 16), IUPC 21,116, Velpen Limestone Member, Parke County, Indiana; (5–7) P1 elements oral view of N. dilatus (Stauffer and Plummer, Reference Stauffer and Plummer1932): (5) figured specimen from Brown and Rexroad (Reference Brown and Rexroad2009, fig. 6, no. 28), IUPC 18,154, West Franklin Limestone Member, Webster County, Kentucky; (6) figured specimen from Brown et al. (2016, pl. 1, no. 9), IUPC 100,408, Alum Cave Limestone Member, Perry County, Indiana; (7) figured specimen from Rexroad et al. (2001, fig. 4, no. 17), IUPC 21,117, Velpen Member, Parke County, Indiana; (8–11) P1 elements oral view of N. roundyi (Gunnell, Reference Gunnell1931): (8) figured specimen from Brown and Rexroad (Reference Brown and Rexroad2009, fig. 6, no. 30), IUPC 18,156, West Franklin Limestone Member, Webster County, Kentucky; (9) figured specimen from Rexroad et al. (2001, fig. 4, no. 19), IUPC 21,119, Velpen Limestone Member, Parke County, Indiana; (10) figured specimen from Rexroad et al. (2001, fig. 4, no. 20), IUPC 21,120, Mecca Quarry Shale Member, Clay County, Indiana; (11) figured specimen from Rexroad et al. (2001, fig. 4, no. 21), IUPC 21,121, Mecca Quarry Shale Member, Sullivan County, Indiana; (12–14) P1 elements oral view of N. medexultimus Merrill, Reference Merrill1972: (12) figured specimen from Brown and Rexroad (Reference Brown and Rexroad2009, fig. 6, no. 32), IUPC 18,158, West Franklin Limestone Member, Webster County, Kentucky; (13) figured specimen from Brown et al. (2016, pl. 1, no. 10), IUPC 100,409, Alum Cave Limestone Member, Gibson County, Indiana; (14) figured specimen from Rexroad et al. (2001, fig. 4, no. 26), IUPC 21,126, Velpen Limestone Member, Parke County, Indiana; (15–17) P1 elements oral view of N. medadultimus Merrill, Reference Merrill1972: (15) figured specimen from Brown and Rexroad (Reference Brown and Rexroad2009, fig. 6, no. 33), IUPC 18,159, West Franklin Limestone Member, Union County, Kentucky; (16) figured specimen from Brown et al. (2016, pl. 1, no. 11), IUPC 100,410, Alum Cave Limestone Member, Vanderburgh County, Indiana; (17) figured specimen from Rexroad et al. (2001, fig. 4, no. 24), IUPC 21,124, Mecca Quarry Shale Member, Clay County, Indiana; (18, 19) P1 elements oral view of N. bothrops Merrill, Reference Merrill1972: (18) figured specimen from Brown and Rexroad (Reference Brown and Rexroad2009, fig. 6, no. 34), IUPC 18,160, West Franklin Limestone Member, Webster County, Kentucky; (19) figured specimen from Rexroad et al. (2001, fig. 4, no. 27), IUPC 21,127, Velpen Limestone Member, Sullivan County, Indiana; (20, 21) P1 elements oral view of N. bassleri (Harris and Hollingsworth, Reference Harris and Hollingsworth1933): (20) figured specimen from Brown and Rexroad (Reference Brown and Rexroad2009, fig. 6, no. 36), IUPC 18,162, West Franklin Limestone Member, Webster County, Kentucky; (21) figured specimen from Brown and Rexroad (Reference Brown and Rexroad2009, fig. 6, no. 35), IUPC 18,161, West Franklin Limestone Member, Webster County, Kentucky. Figures reproduced with permission of the publisher. Scale bar = 1 mm.

Morphotype names are adopted from the true species names of neognathodids (Fig. 4). The morphotypes are numbered in the same evolutionary sequence as shown for the Desmoinesian by Merrill (Reference Merrill1975a, fig. 13). The sequence starts with N. bassleri, the oldest morphotype, as #1, N. bothrops as #2, and so on. The morphotypic variations define bell curves that shifted evolutionarily through time (Rexroad et al., Reference Rexroad, Wade, Merrill, Brown and Pagett2001), generally in a regular progression so that the peak of the curve shifted gradually from the distinct morphology of one named species to the next, suggesting overall genetic drift resulting in a progressive loss of ornamentation and morphologic simplification in the P1 elements of neognathodids.
The average of the morphotypes portrays the position of the composite on the continuum. The species name assigned is the one closest to the NI, or average, and an average NI for a stratigraphic unit is used for zonation and correlation (Rexroad et al., Reference Rexroad, Wade, Merrill, Brown and Pagett2001; Brown and Rexroad, Reference Brown and Rexroad2009; Brown et al., Reference Brown, Rexroad and Zimmerman2016). The NI incorporates all available Neognathodus morphotype specimens. The sample size of identified Neognathodus morphotypes in this study ranged from 136 to 2,278 specimens, and the NI is interpreted as robust for comparing units with this variable range of sample sizes.
A specific example of calculating the NI for a stratigraphic unit is presented using data from the Perth Limestone Member of the Staunton Formation. The Perth produced a total of 332 Neognathodus specimens, consisting of 110 N. bassleri, 153 N. bothrops, 49 N. medadultimus, two N. medexultimus, five N. roundyi, and 13 N. dilatus (Rexroad et al., Reference Rexroad, Brown, Devera and Suman1998). The morphotypes are numbered following their evolutionary sequence, multiplied by the respective number of each morphotype, and divided by the total number of Neognathodus specimens. Therefore, the NI of the Perth = [(1 x 110) + (2 x 153) + (3 x 49) + (4 x 2) + (5 x 5) + (6 x 13)] / 332 = 2.03.
Statistical tests
The Neognathodus species name and the NI are based on the distribution of morphotypes, and to statistically evaluate the standardized distributions of Neognathodus morphotypes between each successive lithologic unit, a two-sample Kolmogorov-Smirnov (K-S) hypothesis test was performed. The K-S test is nonparametric and sensitive to differences in shape between two distributions. Thus, it is well suited to analyze the distribution of Neognathodus morphotypes in each lithologic unit because some morphotype distributions are not normal and exhibit differences in variance. The null hypothesis of this test states that both sampled distributions of Neognathodus morphotypes are drawn from the same population distribution, whereas the alternate hypothesis states that sampled distributions are drawn from different population distributions. To minimize Type I statistical error (i.e., false positive) and account for variability in Neognathodus morphotype distributions, a significance level of 0.05 was chosen. The null hypothesis, that Neognathodus morphotype distributions are drawn from the same population, can be confidently rejected if the calculated p-value is > 0.05.
Each distribution of Neognathodus morphotypes was standardized to a sample size of N = 50 and N = 100 to account for the difference in sample sizes between stratigraphic intervals. Distributions were standardized to 100 for the first set of K-S tests to accommodate the smallest Neognathodus morphotype sample size of 136 specimens (Holland Limestone Member). Distributions were also standardized to a sample size of 50 to examine whether significance results changed due to a substantial change in standardization sizes.
Repository and institutional abbreviation
Conodonts figured in this study are stored in the Indiana University Paleontological Collections (IUPC), Bloomington, Indiana.
Results and discussion
Neognathodus Index trends
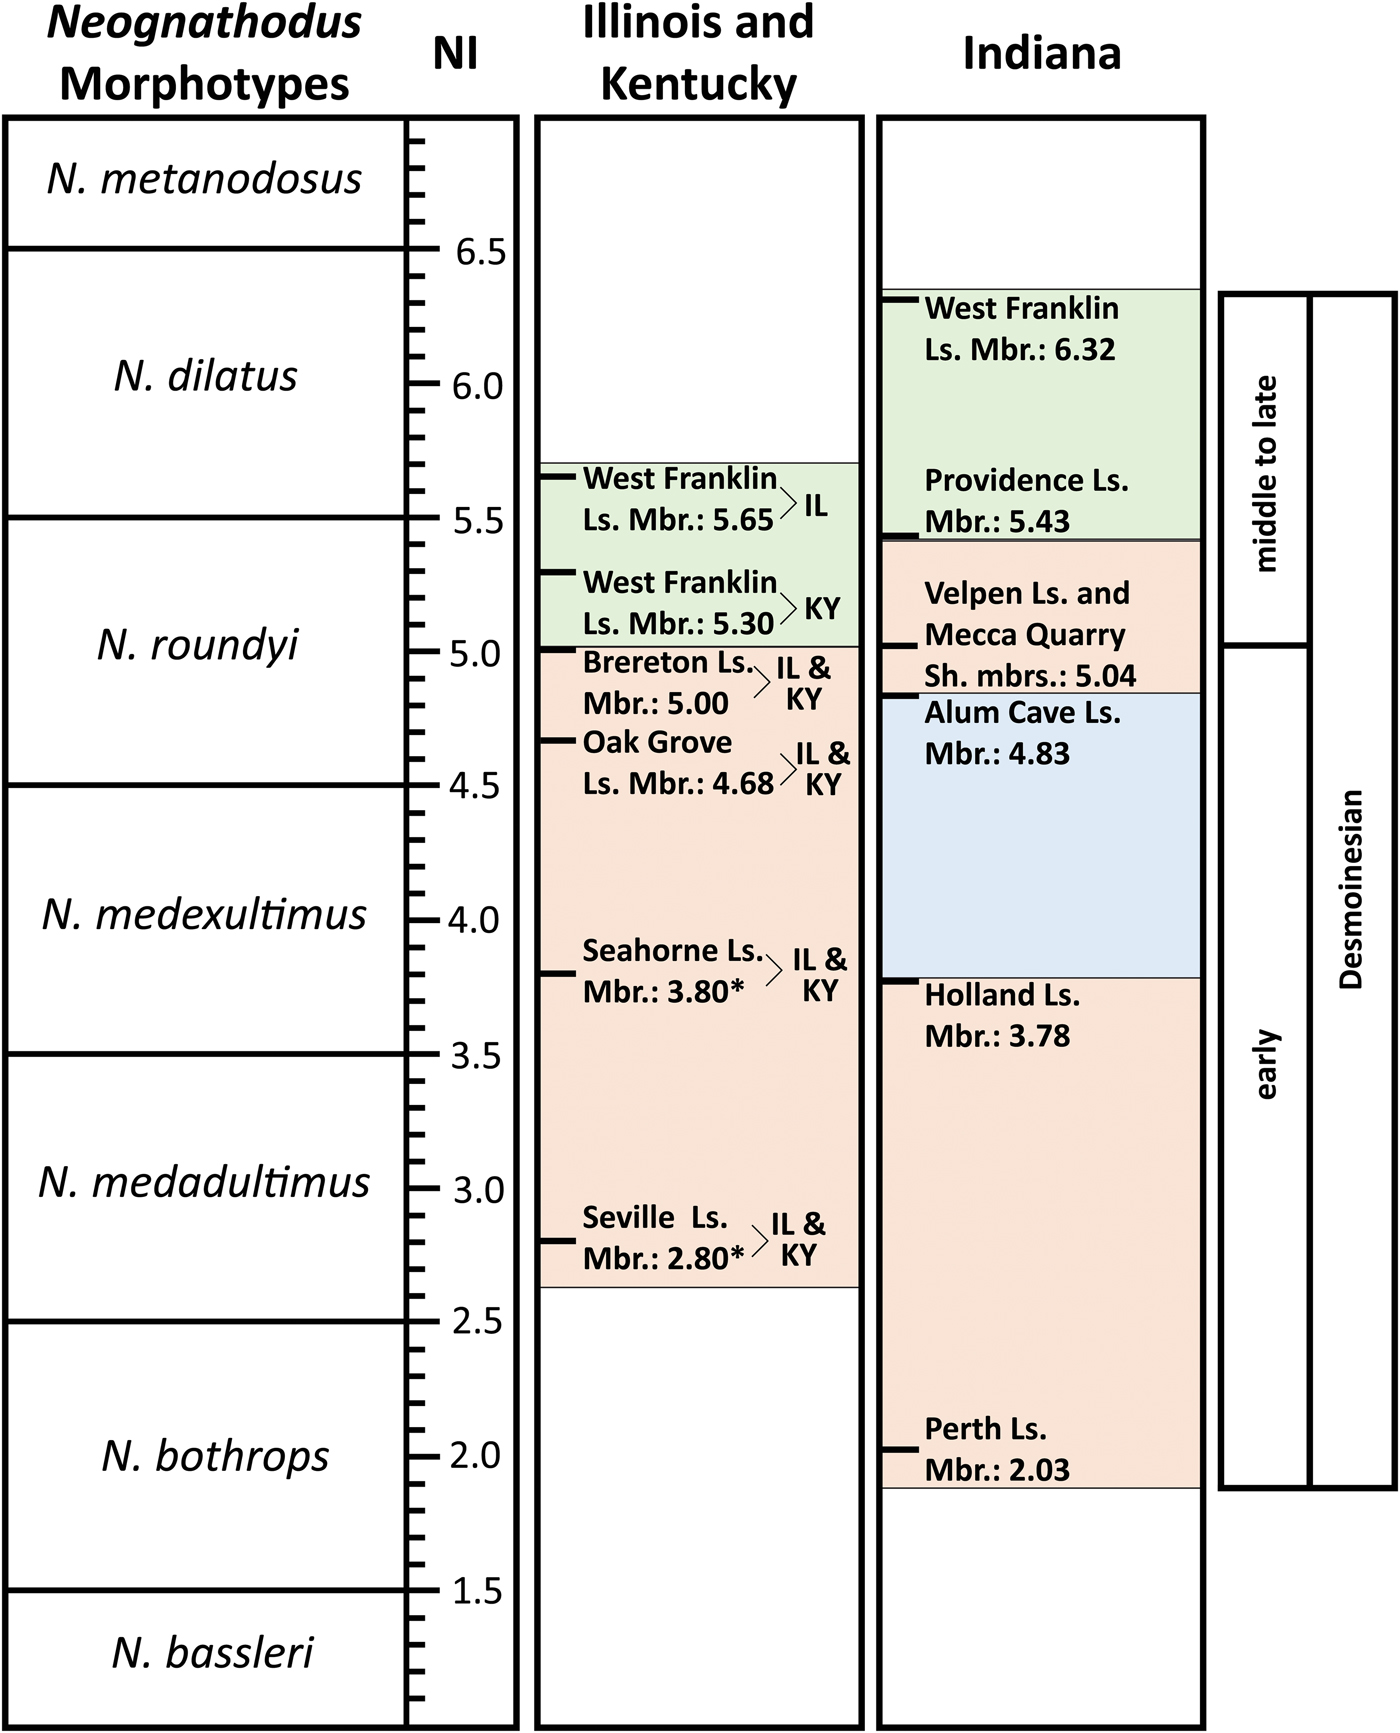
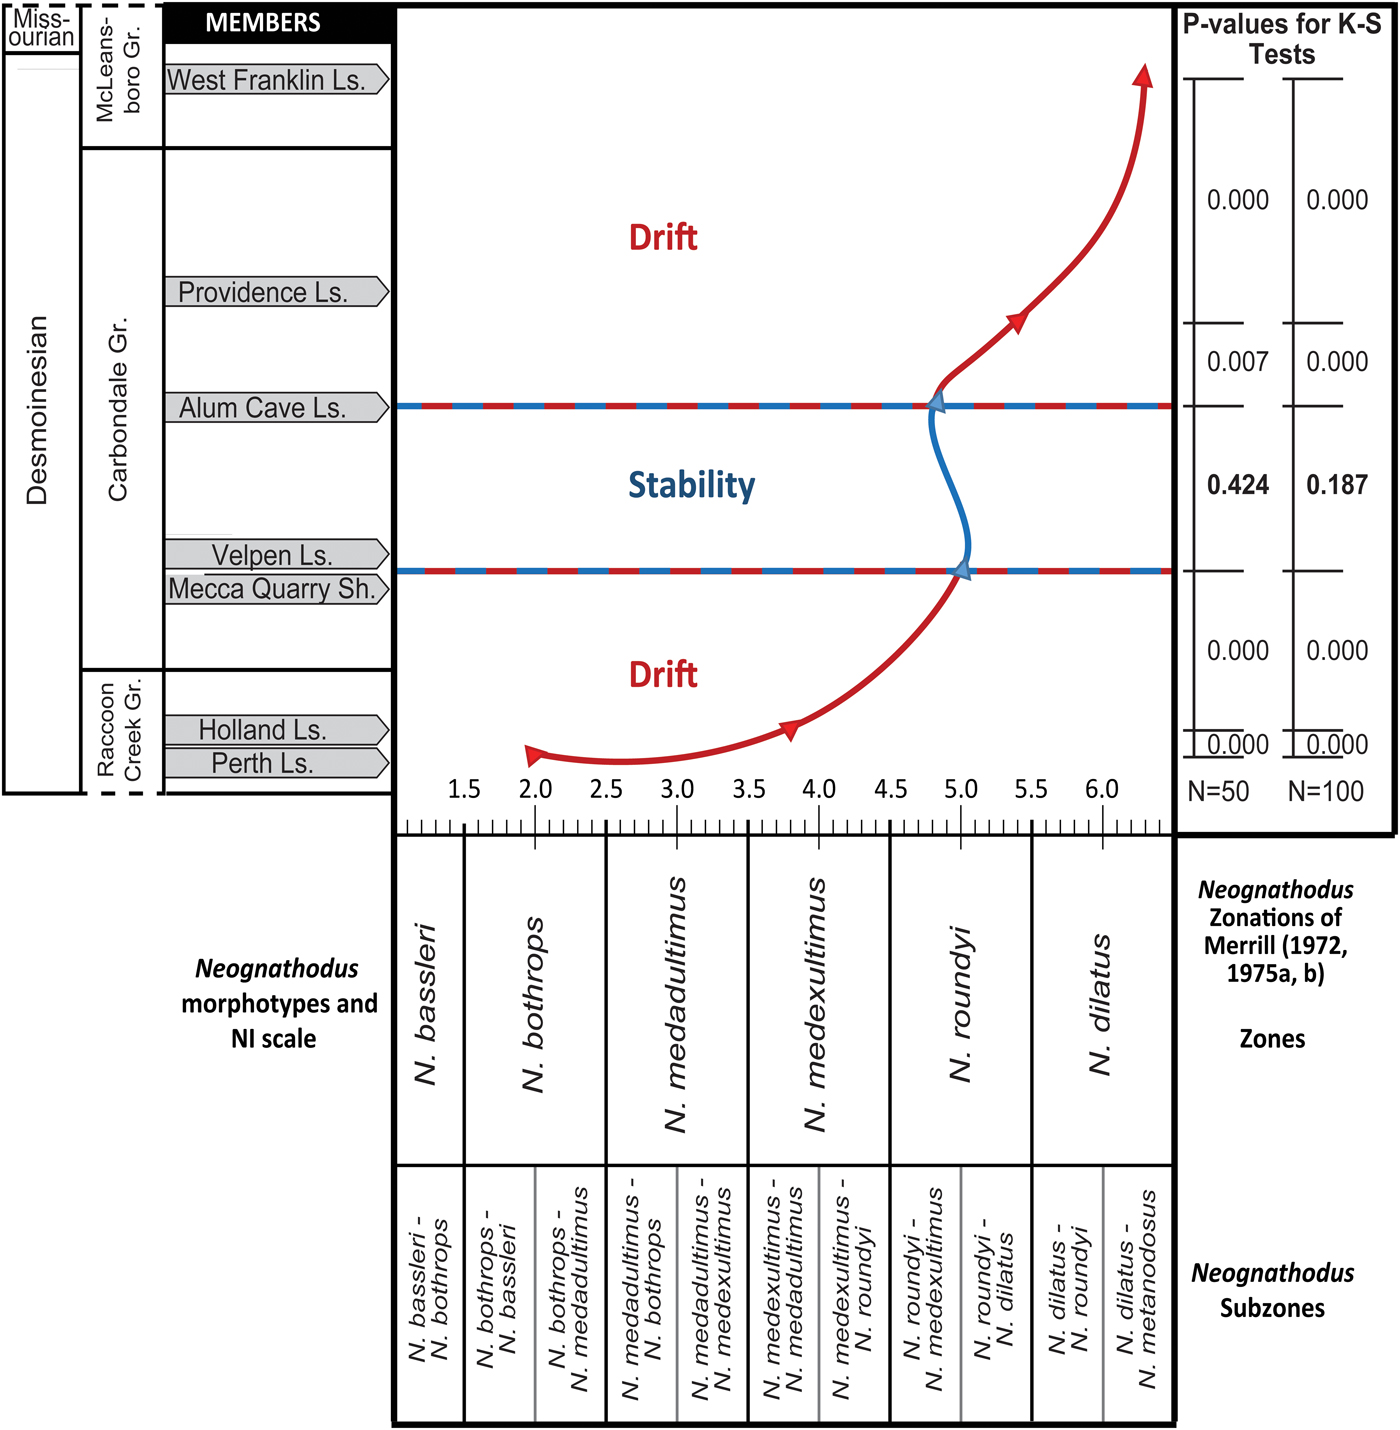
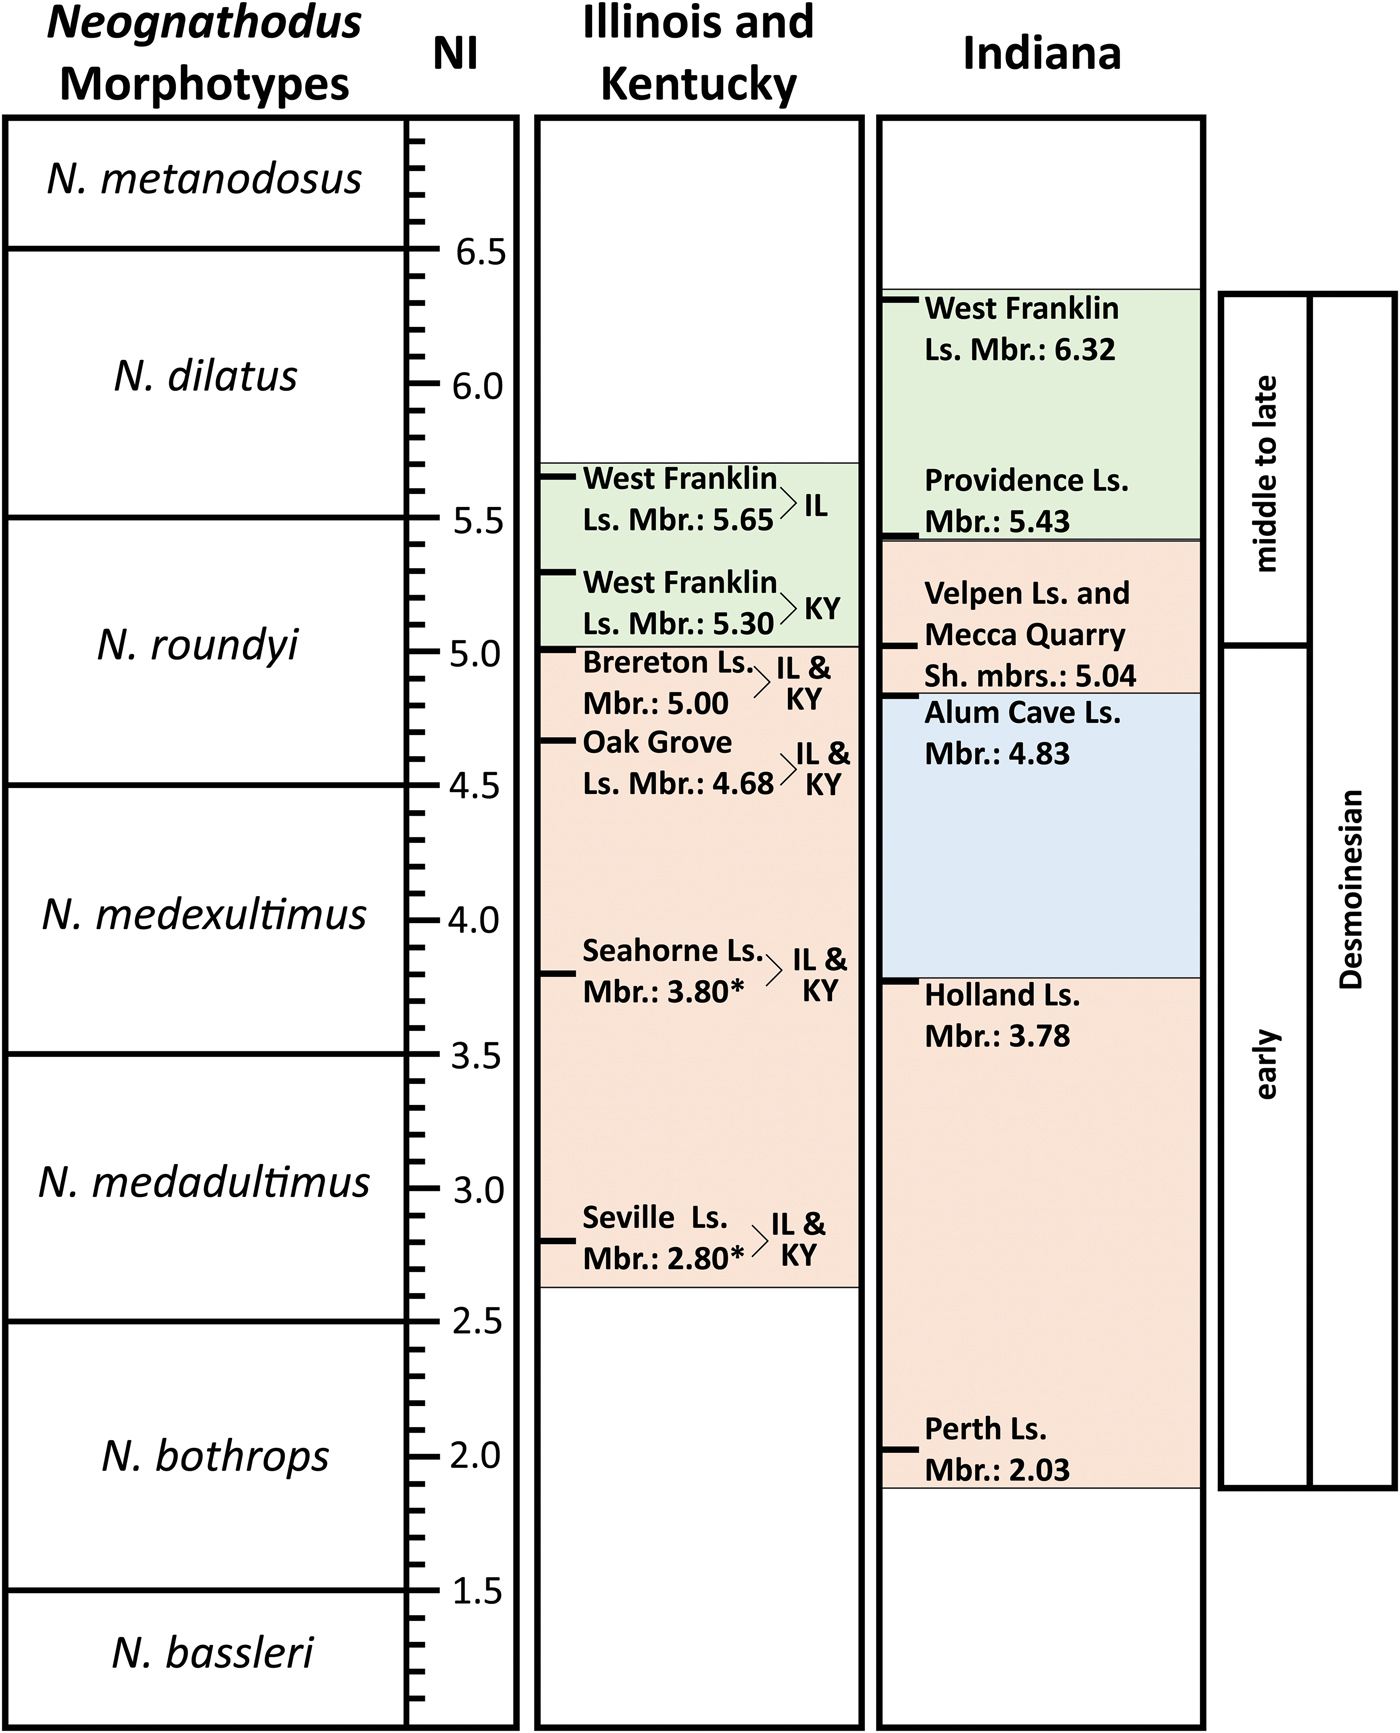
The Neognathodus Index (NI) patterns in this research, and comparative occurrence data from Merrill and King (Reference Merrill and King1971) and Merrill (Reference Merrill1975a), for the Illinois Basin are now relatively complete (Fig. 6). NIs in southern Indiana show periods of morphologic drift and periods of stability throughout the Desmoinesian (Fig. 7). Stratigraphic intervals with Neognathodus samples that show statistically significant p-values quantitatively highlight periods of morphologic drift, whereas intervals with high p-values represent periods of morphologic stability. Stratigraphic intervals that show a difference in the NI of at least 0.3 also demonstrate a Kolmogorov-Smirnov (K-S) test with a low, statistically significant p-value. These comparisons indicate that a NI difference of at least 0.3 between stratigraphic intervals represents a statistically significant difference in the distribution of Neognathodus morphotypes. A difference in sample size, N = 50 or 100, did not affect the statistical significance of any test results.
Desmoinesian correlation chart for rock units in Illinois, Kentucky, and Indiana using the Neognathodus Index (NI). Like colors between states highlight similar NI trends. Red shows a period of morphologic simplification correlated between Illinois/Kentucky and Indiana in the early Desmoinesian. Blue shows a period of localized NI reversal in the Alum Cave Limestone Member in Indiana. Green shows a period of simplification correlated between Illinois/Kentucky and Indiana in the late Desmoinesian, although this trend is much more pronounced in Indiana. Asterisks mark NI values of the Seville Limestone Member and the Seahorne Limestone Member, both of the Tradewater Formation, which are based on few specimens and are provisional. The structure of the figure is partially adapted from Brown et al. (Reference Brown, Rexroad and Zimmerman2016). Ls. = limestone; Mbr. = member; Sh. = shale.
Comparison chart showing progression of Neognathodus Index (NI) values in the Illinois Basin of Indiana. The members (at left) are ordered vertically based on general stratigraphic position. The changes in morphotypic trends for stability and drift are labeled and shown in blue and red, respectively. P-values for Kolmogorov-Smirnov (K-S) statistical tests of the standardized distribution of Neognathodus morphotypes are shown for each lithologic interval. Each morphotype distribution was standardized for a sample size (N) of 50 and 100. High p-values (> 0.05) are shown in bold and represent intervals of statistically similar morphotype distributions and morphologic stability. Low p-values (< 0.05) represent periods of statistically distinct morphotype distributions and morphologic drift. The structure of the figure is partially adapted from Brown et al. (Reference Brown, Rexroad and Zimmerman2016), although that study did not conduct statistical testing. Neognathodus zonations constructed by Merrill (Reference Merrill1972, Reference Merrill1975a, Reference Merrillb) are also shown in relation to the NI zones. Gr. = group; Ls. = limestone; Sh. = shale.
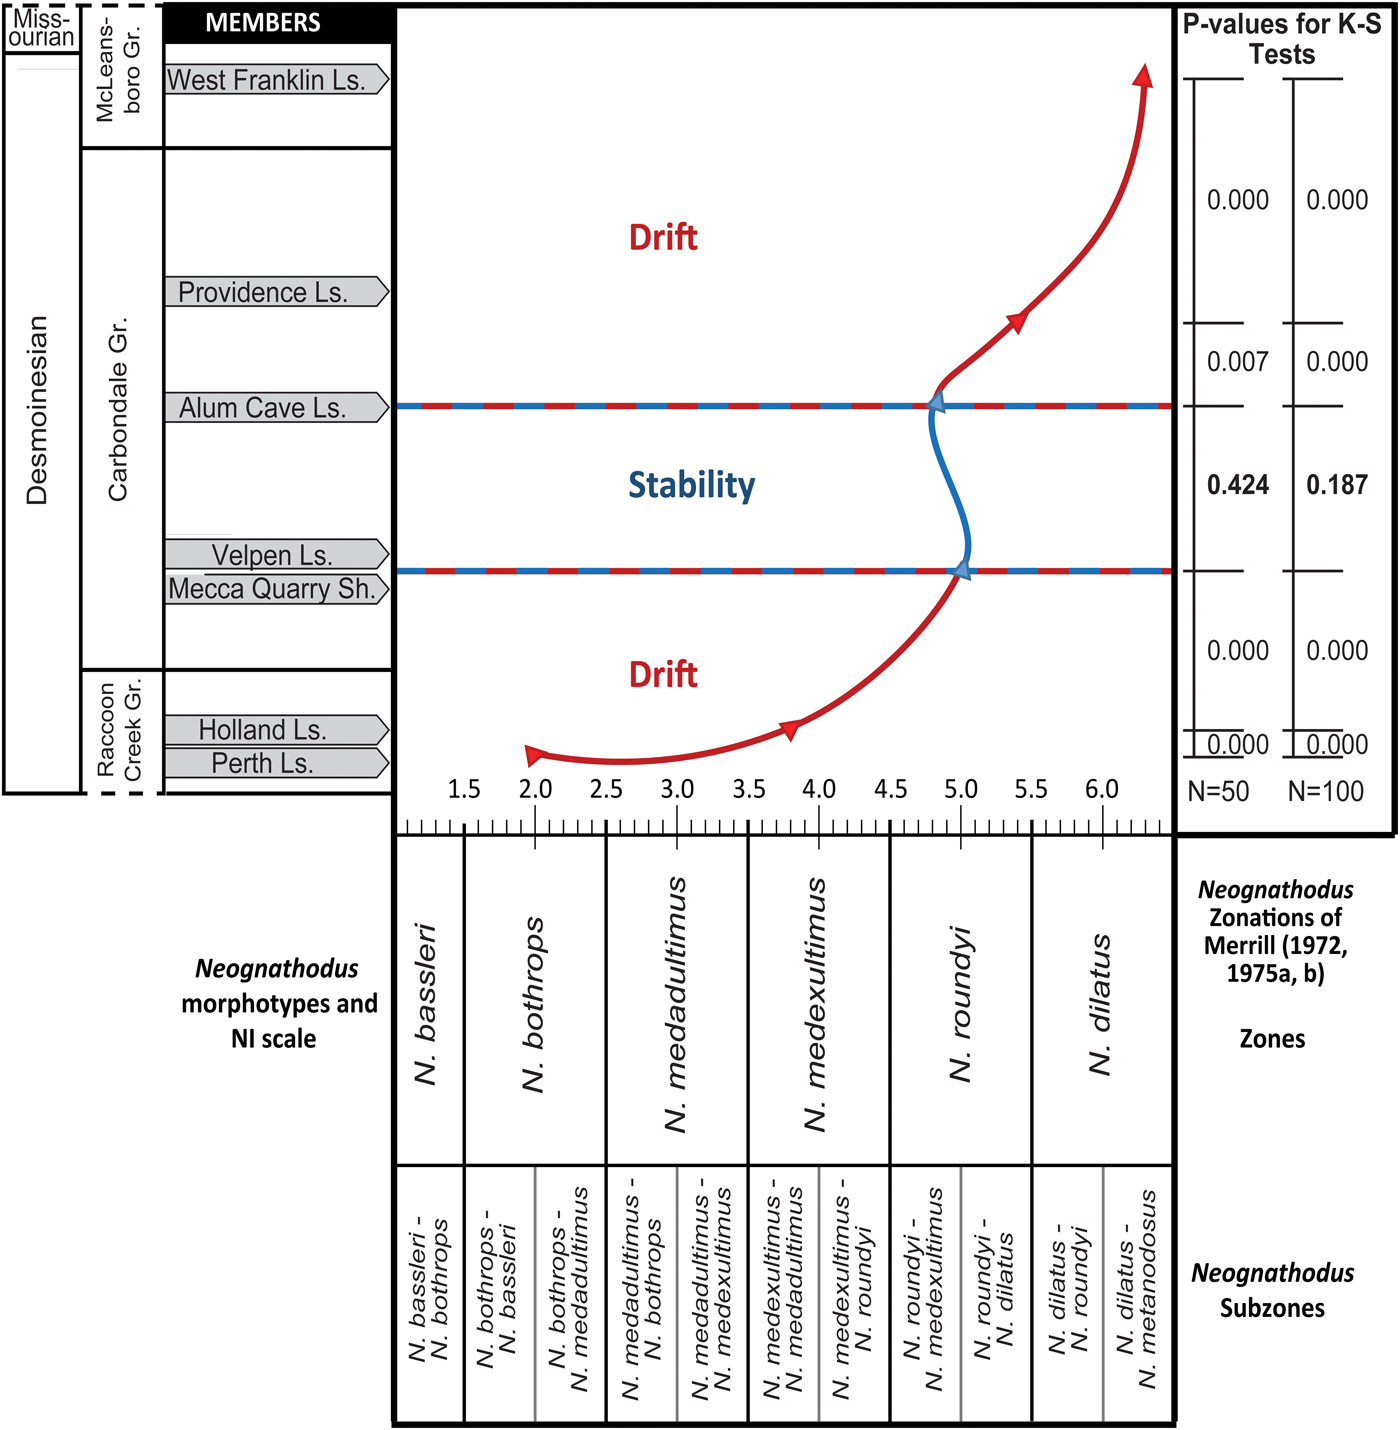
During the early Desmoinesian in Indiana, morphologic drift occurred from the Perth Limestone Member of the Staunton Formation (NI = 2.03) to the Velpen Limestone and Mecca Quarry Shale Members of the Linton Formation (NI = 5.04) (Rexroad et al., Reference Rexroad, Brown, Devera and Suman1998, Reference Rexroad, Wade, Merrill, Brown and Pagett2001). K-S tests support the interpretation of drift because the standardized distributions of Neognathodus morphotype samples between the Perth and the Holland and the Holland and the Velpen and Mecca Quarry interval each result in a statistically significant p-value rounded to three decimal points (0.000) for both N = 50 and N = 100, respectively. This demonstrates that the null hypothesis (that the Neognathodus samples are from the same population) can be rejected for each pair of members and it shows there is a statistically significant difference between the NI values of the Perth to the Holland and the Holland to the combined Velpen and Mecca Quarry interval. In Kentucky and Illinois, NIs for the Seville Limestone Member (2.80) and the Seahorne Limestone Member (3.80), both of the Tradewater Formation, are based on few specimens and are provisional (Rexroad et al., Reference Rexroad, Wade, Merrill, Brown and Pagett2001). K-S tests between the Velpen Limestone and Mecca Quarry Shale interval and the Alum Cave result in a p-value that is not significant, rounded to 0.424 and 0.187 for N = 50 and N = 100, respectively. The null hypothesis cannot be rejected and indicates that there is no statistically significant difference between the NI values of the Velpen and Mecca Quarry interval and the Alum Cave. These results support interpretations of morphologic stability.
Middle Desmoinesian stability through the Alum Cave (NI = 4.83) (Brown et al., Reference Brown, Rexroad and Zimmerman2016) was followed in late Desmoinesian by renewed morphologic drift through the Providence Limestone Member of the Dugger Formation (NI = 5.43) (Brown et al., Reference Brown, Rexroad, Eggert and Horowitz1991) and through the West Franklin Limestone Member of the Shelburn Formation (NI = 6.32) (Brown and Rexroad, Reference Brown and Rexroad2009) to the Desmoinesian/Missourian boundary. K-S tests support the interpretation of drift. The standardized distributions of Neognathodus morphotype samples between the Alum Cave and Providence result in a statistically significant p-value rounded to 0.007 and 0.000 for N = 50 and N = 100, respectively. Similarly, the p-value of the K-S test between the standardized distributions of the Providence and West Franklin are statistically significant, rounded to 0.000 for both N = 50 and N = 100. The null hypothesis that the Neognathodus samples are from the same population can be rejected for each pair of members, demonstrating that there is a statistically significant difference between the NI values of the Alum Cave to the Providence and the Providence to the West Franklin. Neognathodus is not found above the Desmoinesian/Missourian boundary in the Illinois Basin (Merrill, Reference Merrill1975a; Heckel et al., Reference Heckel, Boardman, Barrick, Hills, Henderson and Bamber2002) and extinction of Neognathodus at the end of Desmoinesian was reported by a number of studies (Merrill, Reference Merrill1975a; Merrill and Grayson, Reference Merrill, Grayson, Boardman, Barrick, Cocke and Nestall1989; Boardman et al., Reference Boardman, Heckel, Barrick, Nestall, Peppers, Brenckle and Manger1990).
The comparative changes in the NIs of the lithostratigraphic units studied (ultimately, the morphologic simplification of the genus Neognathodus) provides a useful proxy for correlating the Desmoinesian succession in the Illinois Basin (Fig. 6). In the early to middle Desmoinesian, morphologic simplification in Indiana was similar to those of Illinois and Kentucky. NIs in Indiana range from 2.03 for the Perth to 5.04 for the Velpen and Mecca Quarry. This NI range is remarkably similar to the range of 2.80 for the Seville and 5.00 for the Brereton of Illinois and Kentucky (Rexroad et al., Reference Rexroad, Brown, Devera and Suman1998, Reference Rexroad, Wade, Merrill, Brown and Pagett2001). In middle to late Desmoinesian post-Brereton, there was continued progressive evolutionary simplification although it was more pronounced in Indiana (Fig. 6). For example, in Illinois and Kentucky, NIs range from 5.30 to 5.65 for the West Franklin, whereas in Indiana, the West Franklin NI = 6.32 (Brown and Rexroad, Reference Brown and Rexroad2009).
Neognathodus Index variation
Despite the overall stability in the Neognathodus Index, variations are found in studies of the Velpen and Mecca Quarry (Rexroad et al., Reference Rexroad, Wade, Merrill, Brown and Pagett2001), the Alum Cave (Brown et al., Reference Brown, Rexroad and Zimmerman2016), and the West Franklin (Brown and Rexroad, Reference Brown and Rexroad2009) that are attributable to various local depositional and paleoecologic environments. NIs were computed from northwestern Illinois from the published occurrence data of Merrill and King (Reference Merrill and King1971) and Merrill (Reference Merrill1975a) for three units. The Oak Grove Limestone Member of the Carbondale Formation is correlated with the Velpen (Burger et al., Reference Burger, Weir, Ault, Shaver, Ault, Burger, Carr, Droste, Eggert, Gray, Harper, Hasenmueller, Hasenmueller, Horowitz, Hutchison, Keith, Keller, Patton, Rexroad and Weir1986) and yielded an NI of 4.68. The St. David Limestone Member of the Carbondale Formation is correlated with the Alum Cave (Burger and Weir, Reference Burger, Weir, Shaver, Ault, Burger, Carr, Droste, Eggert, Gray, Harper, Hasenmueller, Hasenmueller, Horowitz, Hutchison, Keith, Keller, Patton, Rexroad and Weir1986b) and provided an NI of 4.79. The Lonsdale Limestone Member of the Shelburn Formation is correlated with the West Franklin (Hopkins and Simon, Reference Hopkins and Simon1975; Peppers, Reference Peppers1996) and yielded an NI of 6.47. Results were compared to data from the Velpen and Mecca Quarry (Rexroad et al., Reference Rexroad, Wade, Merrill, Brown and Pagett2001), the Alum Cave (Brown et al., Reference Brown, Rexroad and Zimmerman2016), and the West Franklin (Brown and Rexroad, Reference Brown and Rexroad2009) and NI variations were found for each of these units and their correlatives across Illinois, Kentucky, and Indiana (Fig. 6). These variations can be attributed to differential evolution in response to localized environmental conditions, including reversals in morphology in response to local and regional environmental conditions. Such reversals have been documented for a number of animal groups including fish (Kitano et al., Reference Kitano, Bolnick, Beauchamp, Mazur, Mori, Nakano and Peichel2008), mammals (Gingerich, Reference Gingerich and Hallam1977), and Darwin's finches in the Galapagos Islands (Grant, Reference Grant1976; Weiner, Reference Weiner1995). These morphologic shifts can occur quite rapidly in response to localized environmental factors. This study emphasizes that local environments were such that more primitive morphs were locally selected over those that were more derived. This resulted in a seeming reversal in the morphotypic distribution, both locally and regionally, as seen in the indices.
The highly variable NIs associated with Neognathodus populations recovered from the West Franklin Limestone are an example of the NI variations that are attributed to localized conditions. Based on studies in Illinois (NI = 5.65), the assignment is to N. dilatus whereas in Kentucky (NI = 5.30), it is to N. roundyi (see Brown and Rexroad, Reference Brown and Rexroad2009). Utilizing the morphotype distribution reported by Merrill (Reference Merrill1975a), an NI of 6.47 was computed for the Lonsdale Limestone Member of the Shelburn Formation in northwestern Illinois. This value is close to that of the West Franklin of Indiana (NI = 6.32) and establishes a general age correlation. However, the age of the West Franklin Limestone in Kentucky is assigned to N. roundyi (NI = 5.30), and the difference in evolutionary simplification between Indiana and Illinois and Kentucky is attributed to the influence of localized environmental conditions.
The Alum Cave provides another example of environmental pressure on varying neognathodid population morphotypes. Samples were collected from 25 localities in eight counties in southwestern Indiana. Two localized areas—in east-central Sullivan County (NI = 3.40) and in south-central Warrick County (NI = 3.80)—have low NIs, and one locality in north-central Warrick County produced a high NI (5.32) in comparison to the overall Alum Cave (NI = 4.83) (Brown et al., Reference Brown, Rexroad and Zimmerman2016). These localized variations are attributed to morphologic shifts and differential evolution in response to localized environmental conditions.
Neognathodus Index correlation
Although NI variation within units occurs, successful general correlations of specific Desmoinesian units using the NI in the Illinois Basin shows potential for the method to be effective for Desmoinesian biostratigraphy. For example, the NI supports the proposed correlation of the Alum Cave with the St. David Limestone Member of the Carbondale Formation in Illinois (Burger and Weir, Reference Burger, Weir, Shaver, Ault, Burger, Carr, Droste, Eggert, Gray, Harper, Hasenmueller, Hasenmueller, Horowitz, Hutchison, Keith, Keller, Patton, Rexroad and Weir1986b). The Alum Cave NI of 4.83 (Brown et al., Reference Brown, Rexroad and Zimmerman2016) is quite similar to the NI of 4.79 that was computed from Merrill's (Reference Merrill1975a) published occurrence data for the St. David Limestone Member of Illinois. As a further example, correlation of the Lonsdale Limestone Member of the Shelburn Formation in northwestern Illinois (NI = 6.47) with the West Franklin of Indiana (NI = 6.32), as proposed by others (Hopkins and Simon, Reference Hopkins and Simon1975; Peppers, Reference Peppers1996), supports the utility of the NI for biostratigraphic purposes.
The NI shows periods of drift alternating with periods of stability in Indiana and Illinois and Kentucky, thus demonstrating generalized evolutionary simplification within the genus. Once established in a regional setting, these periods of stability and drift can also provide a framework for correlation. In Indiana, for example, the NIs of the Velpen and Mecca Quarry (5.04) and the Alum Cave (4.83) represent an N. roundyi zonation and are sufficiently close to be indicative of a period of morphotypic stability between two periods of morphotypic drift (Fig. 7). In Illinois and Kentucky, the Oak Grove, St. David Limestone, and Brereton Limestone were all assigned to the Neognathodus roundyi-medexultimus Biozone/Subzone by Merrill (Reference Merrill1972, Reference Merrill1975a). In Indiana, the Alum Cave Limestone, Velpen Limestone, and Mecca Quarry Shale fall within the same N. roundyi Zone/Subzone, thus allowing a generalized correlation within this zone/subzone if not a specific correlation among these units.
Zimmerman et al. (Reference Zimmerman, Johnson and Polly2018) applied geometric morphometric analyses to the P1 elements of Neognathodus morphotypes to determine quantitative and statistically robust biozonations of Desmoinesian units in the Illinois Basin. The shape of the P1 platform element was quantified with an outline of 241 landmarks (x, y points on an image), and the average shape between Neognathodus morphotypes and stratigraphic intervals was statistically evaluated using multivariate analysis of variance tests. The geometric morphometric-based biozones of Neognathodus align with the NI biozonation structure discussed in this paper and this illustrates that Neognathodus-based biostratigraphic correlations do not vary when utilizing either the NI or geometric morphometric analyses.
However, the vagaries associated with localized environmental influences must be considered and attempts at correlation using only one or a small number of tightly grouped and localized localities risks a compromised correlation result. It should also be noted that K-S statistical tests demonstrate that a population of Neognathodus morphotypes of > 50 specimens is most effective for statistical correlation when interpreting patterns of morphologic drift and stability.
Conclusions
The progressive simplification of the P1 element of Neognathodus through the Desmoinesian was utilized to develop a Neognathodus Index (NI). The NI represents the mean of the total population of the differing number of Neognathodus morphotypes that are present at any one time. NI values in the Illinois Basin during the Desmoinesian show periods of positive drift and stability that are supported by statistical testing. Patterns of morphologic simplification are similar across Illinois, Kentucky, and Indiana but vary in magnitude. NI variations between suggested correlative members in Illinois, Kentucky, and Indiana are attributed to variations in differential evolution in response to differing environmental conditions. Utilizing the NI for correlation purposes has potential but variation due to localized environmental influences must be considered. Stratigraphic placement of units within periods of morphotypic stability and drift has regional potential for correlation.
Acknowledgments
We would like to thank A. Bancroft, Research Geologist in the Indiana Geological and Water Survey, S. Ritter, Professor in the Department of Geological Sciences at Brigham Young University, and R. Stamm, Geologist in the Florence Bascom Geoscience Center (U.S. Geological Survey) for providing thorough, detailed, and valuable reviews that significantly enhanced the quality of this manuscript.
Accessibility of supplemental data
Data available from the Dryad Digital Repository: https://doi.org/10.5061/dryad.68k64mp.