INTRODUCTION
Because of the implementation of the EU directive 1999/74/EC, the occurrence of Ascaridia galli (A. galli) has dramatically increased within the past decade in commercial laying hens on farms in some European countries (Thapa et al. Reference Thapa, Hinrichsen, Brenninkmeyer, Gunnarsson, Heerkens, Verwer, Niebuhr, Willett, Grilli, Thamsborg, Sørensen and Mejer2015). This situation has led to a significant increase in frequency of anthelmintic use in laying flocks in several EU countries. Only benzimidazole drugs (BZs), e.g., flubendazole (FLBZ) and fenbendazole (FBZ), have been approved for treatment of A. galli within the EU member states (EMA/42178/2014). In Sweden, the amount of BZs prescribed for poultry has been doubled between 2009 when the drug was first introduced, and 2015; from 19 to 46 kg BZ active substance, without a corresponding increase of the sector/population/industry (Girma, Reference Girma2016).
A recent attempt to develop an efficient deworming control strategy against A. galli (Tarbiat et al. Reference Tarbiat, Jansson, Tydén and Höglund2016b ), indicated that the build-up of parasite eggs in a poultry barn can be prevented by early detection of infection followed by repeated anthelmintic treatments at strategic time points. This led to an overall significant lower parasite burden and egg expulsion at flock level but at a cost of more frequent treatment occasions (op cit).
The extensive use of anthelmintics to control helminth infections in livestock is in general known to be a contributing factor to the selection for resistance alleles (Coles, Reference Coles2005). From the parasitic-disease control standpoint, this poses a growing threat in the absence of other anthelmintic classes with different mode of actions. In nematode parasites of grazing livestock and horses resistance to all major classes of anthelmintics have been reported worldwide, especially for BZs in gastrointestinal nematodes (GIN) of ruminants (Kaplan and Vidyashankar, Reference Kaplan and Vidyashankar2012). For example, it was recently shown that a combination of sub-therapeutic dosages with high treatment frequency lead to rapid selection for BZ resistance in Ostertagia ostertagi of cattle (Knapp-Lawitzke et al. Reference Knapp-Lawitzke, Krücken, Ramünke, von Samson-Himmelstjerna and Demeler2015). In view of these results it is of utmost importance to screen for early signs of resistance in A. galli in laying hens.
It has been suggested that treatment of the parasite population, when the proportion of egg and larval stages in the environment (e.g. in refugia) is low, can increase the risk for selection for resistant alleles in the population (van Wyk, Reference van Wyk2001; Coles, Reference Coles2002, Reference Coles2005). Resistant genotypes with a selective advantage will then be overrepresented, which theoretically will increase the risk for rapid development of anthelmintic resistance (AR). With increased reliance on BZs against A. galli in laying hens, it may only be a question of time before resistance occurs.
The faecal egg count reduction test (FECRT) is the most widely used test for detecting AR. This technique was originally developed to detect AR in sheep and goats (Terrill et al. Reference Terrill, Kaplan, Larsen, Samples, Miller and Gelaye2001; Geurden et al. Reference Geurden, Hoste, Jacquiet, Traversa, Sotiraki, Frangipane di Regalbono, Tzanidakis, Kostopoulou, Gaillac, Privat, Giangaspero, Zanardello, Noé, Vanimisetti and Bartram2014; Crook et al. Reference Crook, O'Brien, Howell, Storey, Whitley, Burke and Kaplan2016). In principle, FECRT can be used with all types of anthelmintics and nematode species in which parasite eggs are shed in faeces. The World Association for the Advancement of Veterinary Parasitology (WAAVP) has compiled guidelines which provide straightforward techniques for estimating the drug efficacy with 95% confidence interval (CI) for ruminants and horses (Coles et al. Reference Coles, Bauer, Borgsteede, Geerts, Klei, Taylor and Waller1992). However, to the best of our knowledge guidelines for the use of FECRT has never presented for poultry.
There are also in vitro techniques, which have been frequently used to detect AR in nematode parasites of livestock. For example, the larval development test (LDT), is a tool used to quantify the level of resistance. It measures the embryonic development of parasite eggs to third larval stage (L3) in the presence of increasing concentrations of anthelmintic. Two variations of this test have been developed; a liquid- based test (Hubert and Kerboeuf, Reference Hubert and Kerboeuf1992) and an agar-based test (Gill et al. Reference Gill, Redwin, Van Wyk and Lacey1995; Coles et al. Reference Coles, Jackson, Pomroy, Prichard, von Samson-Himmelstjerna, Silvestre, Taylor and Vercruysse2006). The agar-based LDT kit is commercially available (DrenchRite®) and has been used to successfully detect AR in nematodes of goats and sheep (Terrill et al. Reference Terrill, Kaplan, Larsen, Samples, Miller and Gelaye2001; Ancheta et al. Reference Ancheta, Dumilon, Venturina, Cerbito, Dobson, LeJambre, Villar and Gray2004; Howell et al. Reference Howell, Burke, Miller, Terrill, Valencia, Williams, Williamson, Zajac and Kaplan2008). However, a major problem is the lack of validated LDT protocol for detection of AR resistance status of A. galli.
The BZs act through binding to nematode β-tubulin subunits and thereby prevent polymerization of microtubules and disrupt the microtubule equilibrium that is essential for maintenance of cellular homeostasis (Lacey, Reference Lacey1988; Prichard, Reference Prichard2001; Robinson and Spudich, Reference Robinson and Spudich2004). Advancement in molecular techniques has deepened our knowledge about mechanisms of AR especially as regards to trichostrongylids. Structural changes in the β-tubulin molecule reduce the affinity of BZs to the binding site (Lubega and Prichard, Reference Lubega and Prichard1991; Prichard, Reference Prichard1994), which have been associated with BZ resistance. These changes are known to be associated with single nucleotide polymorphisms (SNPs) in the β-tubulin gene (Kwa et al. Reference Kwa, Veenstra and Roos1994). The most recent development in search for molecular markers of AR consists of three SNPs that are linked to BZ resistance in some trichostrongylidae; TTC/Phe → TAC/Tyr (F167Y) at codon 167 (Silvestre and Cabaret, Reference Silvestre and Cabaret2002), GAG/Glue → GCG/Ala (E198A) at codon 198 (Ghisi et al. Reference Ghisi, Kaminsky and Mäser2007) and TTC/Phe → TAC/Tyr (F200Y) at codon 200 (Kwa et al. Reference Kwa, Veenstra and Roos1994). Despite discovering the role of SNPs at codons 167 and 198, mutation at codon 200 still appears to be the most important with respect to BZ resistance phenotype at least in nematode parasites of ruminants.
Systematic analysis of the β-tubulin gene of A. galli has lagged behind compared with GIN of importance in grazing livestock. To our knowledge, there are no systematic studies investigating the resistance situation in A. galli. Effective monitoring of resistance is vital in order to maintain high efficacy of anthelmintics and to detect selection at an early stage and thereby prevent spread. Furthermore, early detection of AR in A. galli will give us better insight when designing an optimal control strategy based on anthelmintic treatment. The aim of this paper therefore was to apply and evaluate tools for the detection and monitoring of AR in A. galli and to investigate the possibility of accruing resistance to BZ in isolates of A. galli with a recent treatment history.
MATERIALS AND METHODS
Study farm
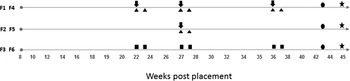
Six separate but identical flocks (flock number F1–6) (without confounding environmental and management factors) of a commercial laying hen farm with a history of A. galli mono-infection were recruited. For detailed description of the farm, refer to Tarbiat et al. (Reference Tarbiat, Jansson, Tydén and Höglund2016b ). Flocks F1 and F4 were treated with FBZ (Panacur AquaSol®, Intervet AB, 1 mg kg−1 body weight) on 3 occasions i.e., 22, 27 and 36 weeks post placement (wpp). Flocks F2 and F5 were treated with FBZ on a single occasion at 27 wpp and hens in flocks F3 and F6 were not exposed to FBZ during the study period. The drug was administered in drinking water for 5 consecutive days according to the manufacturer's recommendation (Tarbiat et al. Reference Tarbiat, Jansson, Tydén and Höglund2016b ). The study farm had a history of using BZs since 2009.
Faecal egg count reduction test
Sampling
The FECRT was performed on each deworming occasion. Only individual faecal material (no worm count) was used to assess the FBZ efficacy for two reasons. First, a recent study has shown that FLBZ successfully eliminated both larvae and adult stages of A. galli during a 7-day treatment period (Tarbiat et al. Reference Tarbiat, Jansson, Moreno, Lanusse, Nylund, Tydén and Höglund2016a ). Second, the number of sacrificed hens for scientific purposes has to be kept as low as possible because the study was performed on a commercial farm. Accordingly, 15 hens were selected randomly from treated flocks before deworming and placed individually in cardboard boxes (38 L) measuring 34 × 27 × 43 cm 3 . The bottom surface of each box was covered with a plastic tray to facilitate feces collection. The hens were kept in the boxes for approximately 30 min to allow defecation. Individual feces were collected and stored in separate plastic containers. The same procedure was repeated 10 days after the end of the deworming period. Pooled faecal samples (4 samples, ≈800 g each) were collected from untreated flocks (flocks F5 and F6) on the same days as samples were collected from flock F1/F4 and F2/F5, to obtain an estimate of the parasite egg count (Fig. 1).
The materials sampled and the timing of sampling weeks post placement from six flocks (F1–F6). The black arrows indicate fenbendazole administration (1 mg kg−1 body weight for 5 days). The black triangles indicate the time individual feces were collected for FECRT (15 hens on each occasion). The black square indicates the time pooled faeces were collected from untreated flocks. The black circle indicates when feces were collected for LDT. The star indicates the timing of parasite collection for DNA extraction (120 worms in total). FECRT, faecal egg count reduction test.

Faecal egg count reduction (FECR) assessment
To estimate the FECR, the number of parasite eggs per gram feces (EPG) of the pretreatment individual hens (n = 15) was compared with EPGs post treatment (n = 15) 10 day after deworming using the formula: FECR = 100 × (1-[T2/T1]) (McKenna, Reference McKenna2006) where T1 and T2 represented the mean pre- and post-treatment FECs. The FECs were determined using the McMaster method with a minimum detection level of 50 EPG (Foreyt, Reference Foreyt2001). The EPG values below 150 were excluded from calculation (Coles et al. Reference Coles, Jackson, Pomroy, Prichard, von Samson-Himmelstjerna, Silvestre, Taylor and Vercruysse2006).
Larval development test (LDT)
A. galli eggs isolation
At 43 wpp fresh faecal materials (pooled samples ≈800 g) were collected on plastic trays (20 × 27 cm2) placed on the manure belts under the slats in each of the six barns (Fig. 1). Parasite eggs were extracted from faecal samples using a modified flotation technique. Accordingly, parasite eggs were isolated through a series of sieves using cold tap water. The mesh sizes used in declining order were 300, 150 and 70 µm. Eggs were collected on a 35 µm sieve, transferred to several 50 mL Falcon tubes, and centrifuged (IES CL50 centrifuge, Techtum Lab AB®) for 1 min at 425× g . The supernatant was discarded and the tubes were filled with saturated salt. Tubes were vortexed vigorously and then centrifuged for 3 min at 425× g and the liquid phase containing parasite eggs were passed through a 25 µm sieve and washed several times with cold tap water. Eggs were collected in a 50 mL falcon tube and the concentration was adjusted to approximately 30 eggs per μL water.
Preparation of thiabendazole dilutions
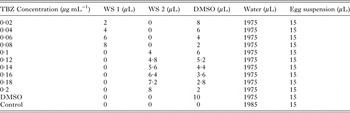
Thiabendazole (TBZ) was used in the LDT due to its relatively high solubility in water. A stock solution (SS) was prepared by dissolving 50 mg TBZ (T5535, SIGMA-ALDRICH®) in 10 mL dimethyl sulphoxide (DMSO) with a final concentration of 5000 µg mL−1. Working solution 1 (WS1) was created from the stock solution by diluting 1 mL SS in 99 ml DMSO with a final concentration of 50 µg mL−1. The working solution 2 (WS2) was prepared by diluting 4 ml WS1 in 6 mL DMSO with a final concentration of 20 µg mL−1. The WS1 and WS2 were used to create a range of TBZ dilutions (0·02−0·2 µg mL−1) with a concentration of 0·5% DMSO (Table 1).
Thiabendazole (TBZ) final concentration (μg mL−1) preparation using working solution 1 (WS1) and WS2

The final dimethyl sulfoxide (DMSO) concentration in each well is 0·5%.
LC50 and LC99 calculations
The A. galli eggs were exposed to a series of gradually increasing TBZ concentrations (0·02 µg mL−1 intervals) in micro-titer plates with 12 replicates per interval. To prevent dehydration, each plate was covered with plate sealer (Titertek®) and placed in a water bath. The sealed plates were incubated at 25 °C for 2 weeks to achieve maximum egg development rate as described previously (Tarbiat et al. Reference Tarbiat, Jansson and Höglund2015). At the end of the incubation period 10 µL of Lugol's iodine solution was added to each well and plates were examined under an inverted microscope (Olympus CK2 equipped with ULWCD 0·30 Olympus lens). A minimum of 200 eggs per well were counted and the number of L3 larvae at each TBZ concentration was determined according to Tarbiat et al. (Reference Tarbiat, Jansson and Höglund2015). GraphPad Prism 7 software for Microsoft Windows© (La Jolla, California USA, www.graphpad.com) was used to perform the statistical analysis and creation of the dose response curves. Accordingly, the percentage egg development of the replicates was corrected (baseline-corrected) based on the egg development rate of the control wells (in water). The data were analyzed by a logistic regression model: Y = B + (T-B)/(1 + 10^ ((LogLC 50 -X) × HillSlope)) where Y represents response, X is the logarithm of the TBZ concentration, B is the basal response and T is the maximal response, to determine LC50 (with their respective CI of 95% values). The LC50 values were compared using extra sum-of-squares F test (P value 0·05). The LC99 was calculated from LC50 based on the formula: LogLC 50 = LogLC F - (1/HillSlope) × log (F/(100-F)), where H and F are Hillslope and desired LC value, respectively.
Candidate gene approach (β-tubulin)
Parasitic material for DNA extraction
From each flock, 10 adult male and 10 adult female A. galli worms (120 worms in total) were retrieved from sacrificed hens at 45 wpp (Fig. 1) (Tarbiat et al. Reference Tarbiat, Jansson, Tydén and Höglund2016b ). For detailed information regarding identification of worms, refer to Tarbiat et al. (Reference Tarbiat, Jansson, Moreno, Lanusse, Nylund, Tydén and Höglund2016a ). Parasite DNA was extracted from the anterior part of worms using a DNA purification kit (NucleoSpin® Tissue) according to the manufacturer's protocol and DNA concentrations were estimated using Picodrop Microliter UV Spectrophotometer (Picodrop Ltd).
Isolation of β-tubulin
A 630 base pair (bp) fragment of the β-tubulin gene was amplified using primers previously described by Tydén et al. (Reference Tydén, Engström, Morrison and Höglund2013) under the following conditions: 25 µL reaction volumes containing 2·5 µL 10 buffer, 2 µL MgCl2 (25 mm), 0·5 µL dNTP (10 mm), 0·5 µL of each primer (20 µ m), 0·2 µL AmpliTaq, 16·8 µL H2O and 2 µL DNA. The cycling parameters for the amplification consisted of 95 °C for 5 min (denaturation) followed by 35 cycles of 95 °C for 45 s, 55 °C for 30 s (primer annealing), 72 °C for 1 min (extension) followed by additional 10 min at 72 °C (Applied Biosystems 2720 Thermal Cycler). Prior to sequencing, 5 µL polymerase chain reaction (PCR) product was examined on a 1% agarose electrophoresis gel with TBE (Tris/Borate/EDTA) buffer to confirm the existence and the size of the PCR products.
Analysis of SNPs in codons 167, 198 and 200 of the A. galli β-tubulin gene
In total 120 A. galli DNA-fragments were sequenced at Macrogen Inc. (Meibergdreef 31 1105 AZ, Amsterdam, the Netherlands). Sequences were imported into CLC Genomic Workbench 7 (version 7.2·5, CLCbio, Arhus, Denmark), assembled and aligned using default settings. Gene organization was retrieved by blasting sequences against the reference A. galli β-tubulin isotype 1 gene (GenBank accession no. KC713796·1) using the NCBI Blast engine (version 2.6·0) and visualized using the web interface, NCBI Sequence Viewer (version 3.18·3). A partial gene map based on the sequenced DNA fragment was created and regions for codon 167, 198 and 200 were identified.
RESULTS
FECR
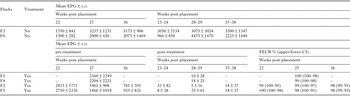
The mean pre-/post treatment EPG (±s.d.), FECR (upper and lower CI) for F1/F4 and F2/F5 and mean EPG (±s.d.) corresponding to pre-/post treatment for F3/F6 are shown in Table 2.
The mean pre-/post treatment egg per gram feces (EPG) ± s.d. counted using McMaster technique plus the faecal egg count reduction (FECR) + upper and lower confidence interval (CI) for F1/F4 and F2/F5

The mean EPG (±s.d.) corresponding to pre-/post treatment for F3/F6 is provided to show that significant reduction was a result of anthelmintic use.
LDT
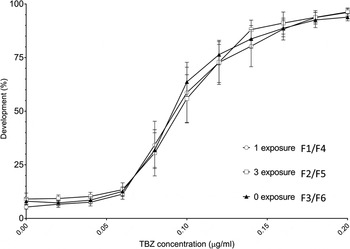
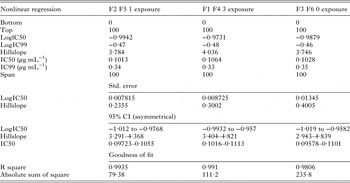
The mean larval development (±s.d.) of A. galli in the control wells were 94% ± 1·5, 90% ± 4·3 and 91% ± 2·3 in F1/F4, F2/F5 and F3/F6, respectively. Comparison of the A. galli isolates (F1/F4 and F2/F5 vs F3/F6) in the LDT test using TBZ did not reveal significant differences (P > 0·05) among obtained LC50 values (Fig. 2). Comprehensive data including the LC50, LC99, confidence limits, HillSlope and R 2 are shown in Table 3.
The XY graph shows lethal concentrations (LC50) determination of Ascaridia galli eggs collected from flocks (F1−F6) in presence of series of thiabendazole (TBZ) concentration ranging from 0·02 to 0·2 µg mL−1. Flocks had different numbers of exposure to fenbendazole.

Detailed statistical analysis of larval development test (LDT)

The lethal concentration 50 (LC50) with their respective confidence interval (CI) of 95% values obtained from logistic regression model is presented. The LC99 was calculated from LC50. The LC50 values were compared using extra sum-of-squares F test (P value 0·05).
SNPs at codons 167, 198 and 200
Three samples were excluded from analyses due to the poor quality DNA reads. Within the investigated A. galli population, 100% of the 117 adult worms showed the BZ-susceptible TTT (Phe), GAG (Glu) and TTC (Phe) homozygous genotype at codon 167, 198 and 200, respectively. Two samples were heterozygous at alignment position 102 (C/T) and 267 (G/C) in the intronic region. Nucleotide sequence data reported in this paper are available in the GenBank™ database under the accession number KY618550-KY618666.
DISCUSSION
We have for the first time investigated the susceptibility to BZs in A. galli under field condition in flocks of commercial laying hens. Three common tests to detect clinical evidence of BZ resistance in trichostrongylid nematodes of livestock (i.e. FECRT, in ovo LDT and mutation at codon 167, 198 and 200 of the β-tubulin gene) were adapted for use in A. galli in this study.
The FECRT has been widely used to monitor drug efficacy against GIN in grazing livestock but not on laying-hen farms. The FECRT can provide meaningful comparisons between different parasite populations on the incidence of AR. In this study, irrespective of the number of exposures to FBZ, the mean percentage reductions were all above 95%. The WAAVP has compiled a guideline on assessing AR in chickens and turkeys based on necropsy in laboratory studies calculating percentage reduction of the worm burden (Yazwinski et al. Reference Yazwinski, Chapman, Davis, Letonja, Pote, Maes, Vercruysse and Jacobs2003). Though, no guideline is provided so far for application of FECRT or LDT to assess AR in chickens. The WAAVP has however provided guidelines to calculate AR in strongylid nematodes of ruminants. Accordingly, resistance should be declared if the percentage FEC reduction is below 95% and the lower 95% confidence limit is less than or equal to 90% (Coles et al. Reference Coles, Bauer, Borgsteede, Geerts, Klei, Taylor and Waller1992). In horses and pigs however, lower cutoff values for FECR (90%) and lower CI level (80%) have been used (Kaplan, Reference Kaplan2002; Coles et al. Reference Coles, Jackson, Pomroy, Prichard, von Samson-Himmelstjerna, Silvestre, Taylor and Vercruysse2006; Vidyashankar et al. Reference Vidyashankar, Hanlon and Kaplan2012). Using both the higher and lower cutoff value (90% and 80% CI), our results did not show any indication of reduced anthelmintic susceptibility in A. galli. Nevertheless, appropriate attention should be given to the interpretation of the FECRT results here, as there are several FEC techniques available, each with different methodology and precision level (Coles et al. Reference Coles, Jackson, Pomroy, Prichard, von Samson-Himmelstjerna, Silvestre, Taylor and Vercruysse2006; Rinaldi et al. Reference Rinaldi, Morgan, Bosco, Coles and Cringoli2014). Furthermore, it has been suggested that factors such as sample size, fecundity and parasite aggregation level among the host population should be considered in the final interpretation of the FECRT results (Levecke et al. Reference Levecke, Dobson, Speybroeck, Vercruysse and Charlier2012). In a simulated study, Calvete and Uriarte (Reference Calvete and Uriarte2013) showed that FECRT could be performed with the McMaster method with sensitivity of 15 epg and a sample size of 20 animals to determine the resistance when the estimated FECR were ⩽92·5 and 93·5% in moderate or high egg-excretion scenarios. The latest was however concluded based on a mathematical modeling approach (Monte Carlo simulations) on sheep data. Application of the same parameters when calculating FECR in laying hens needs further evaluation as A. galli-egg excretion level and aggregation across the host population clearly differs from the nematodes of other animal species (Daş and Gauly, Reference Daş and Gauly2014; Ferdushy et al. Reference Ferdushy, Luna-Olivares, Nejsum, Thamsborg and Kyvsgaard2015). Besides, inclusion of control groups and/or sampling of larger group of individuals under field conditions are often not practical and involve a notable increase in the laboratory labor and costs. Another factor that may influence the interpretation of the FECRT results is the fact that hens are coprophagic by nature. In free-rage systems hens are exposed to their droppings and parasite eggs can pass through the digestive tract to end up in feces. This event was reported in a recent study where A. galli eggs were observed in feces of hens in which adult worms were absent (Tarbiat et al. Reference Tarbiat, Jansson, Moreno, Lanusse, Nylund, Tydén and Höglund2016a ). Still as there was no evidence of poor reduction, this did not seem to affect the outcome of our results.
The sensitivity of A. galli eggs to TBZ was herein determined in a liquid-based LDT. This technique was chosen due to its sensitivity, reproducibility and ease of interpretation (Várady et al. Reference Várady, Čudeková and Čorba2007). However, to estimate the resistance level in a worm population the initial base-line level of susceptibility is essential. Because of the lack of resistant A. galli isolates, the LC50 and LC99 values reported in this study can be used as reference values for future investigation of LDT in A. galli. No significant difference was observed between LC50 after 0, 1 and 3 times exposure to BZ (Fig. 2). The LC50 values reported in this study corresponds to values obtained from resistant GI nematode isolates of sheep (Várady et al. Reference Várady, Čerňanská and Čorba2006), in spite of lack of evidence of resistance with FECRT and candidate gene approach in this study. The LC99 values (0·34, 0·33 and 0·35 µg mL−1 TBZ after 1, 3 and 0 exposure) are also noticeably higher than the determined values for ovine nematodes (0·02 µg mL−1 TBZ) and equine nematodes (0·12 µg mL−1 TBZ) (Coles et al. Reference Coles, Jackson, Pomroy, Prichard, von Samson-Himmelstjerna, Silvestre, Taylor and Vercruysse2006). However, ascarid eggs are clearly different from strongyles. The A. galli eggs are spherical and just a little bigger than the oval eggs of strongyles. Another, yet important, difference is that A. galli eggs are surrounded by a protective thick egg shell as appose to thin-shelled strongyles eggs. Further research to confirm the LC50 and LC99 in A. galli is required.
Sequencing of the partial β-tubulin gene of A. galli was performed to identify polymorphisms. The farm included in this study has dewormed their flocks regularly with BZs since 2009. However, no history of reduced efficacy of BZ has ever been reported by the farmer. Therefore, observing only susceptible alleles in the studied codons was not unexpected. Nevertheless, our results differ from those observed in Haemonchus contortus (TTC and GAA genotypes at codon 167 and 198) (Ghisi et al. Reference Ghisi, Kaminsky and Mäser2007; Williamson et al. Reference Williamson, Storey, Howell, Harper, Kaplan and Wolstenholme2011) in that we observed synonymous mutation in the third position at codon 167 (TTT) and 198 (GAG). We cannot completely rule out the existence of non-synonymous SNPs in the A. galli β-tubulin gene. First, in this study only A. galli isolates from a single farm with a known history of exposure to anthelmintic were investigated. Second, the frequency of mutation in the investigated codons might be still very low in the studied flocks. Third, it is possible that more than one β-tubulin isotypes exist in A. galli. Four β-tubulin isotypes have been identified in H. contortus (Saunders et al. Reference Saunders, Wasmuth, Beech, Laing, Hunt, Naghra, Cotton, Berriman, Britton and Gilleard2013) and the number has been speculated to be at least nine in Ascaris suum (Kotze et al. Reference Kotze, Hunt, Skuce, von Samson-Himmelstjerna, Martin, Sager, Krücken, Hodgkinson, Lespine, Jex, Gilleard, Beech, Wolstenholme, Demeler, Robertson, Charvet, Neveu, Kaminsky, Rufener, Alberich, Menez and Prichard2014) and it is still unclear if we investigated the correct isotype. There is a lack of knowledge about β-tubulin gene isotypes in roundworms in general and their involvement in resistance to BZ mechanism. Differential expression of two β-tubulin gene isotypes has been recently observed during Parascaris development (Tydén et al. Reference Tydén, Skarin, Andersson-Franko, Sjöblom and Höglund2016). The authors highlighted that exposure to TBZ only altered expression of β-tubulin isotype 1. Regarding our observation on other positions of β-tubulin gene, it is still unclear whether these intronic SNPs can affect gene function. More research on identification of possible different β-tubulin isotypes involved in AR in A. galli is clearly needed.
Advances in genetic tools have increased our knowledge about the diversity of the tubulin gene family and their possible role in drug resistance for parasitic nematodes of veterinary importance. We certainly need further insight into their role in BZ resistance in less investigated nematode species such as A. galli. More experimental data is still needed to better understand the importance of the three discovered SNPs and other unknown polymorphisms and their phenotypic consequences in A. galli.
There are other well-established AR mechanisms, which decreases the drug–target interaction. A membrane efflux pump, P-glycoprotein, has been shown to bind to drugs and through P-glycoprotein-mediated export reduces intracellular drug concentration and thereby failure of anthelmintic effect. For review refer to Lespine et al. (Reference Lespine, Ménez, Bourguinat and Prichard2012). Therefore, drug efflux mechanism has been suggested as a possible resistance mechanism. Another pathway is drug metabolism and detoxification, which decreases the amount of drug reaching its target (glutathione-thioreduxin or cytochrome P450 enzymes) (James et al. Reference James, Hudson and Davey2009). As little is known about the resistance mechanisms in A. galli, it is wise to remain open for the possibility of other resistance mechanisms.
Concluding remarks
It is clear that the AR in laying hens is in need of sound experimental data. Our attempt to assess AR in laying hens has led to lack of evidence of resistance with FECRT despite the investigated flocks had been repeatedly dewormed for a decade. Similarly, no clear pattern was observed with LDTs and no variation was observed in investigated β-tubulin gene at codon positions known to be involved in BZ resistance in other nematodes. More investigations are needed to further optimize the existing detection tools for identification of AR in A. galli.
ACKNOWLEDGEMENTS
The author would like to thank Moa Skarin, for laboratory assistance. We acknowledge the farm owner and farm manager for their support and help.
FINANCIAL SUPPORT
This project was funded by The Swedish Research Council Formas (FORMAS 2013-665). The funding source had no involvement in the study design, in the collection, analyses and interpretation of data and in the writing of the report.