Introduction
In the context of an astrobiology mission, the use of a micro-rover instrumented with a magnetometer would serve to develop an understanding of the magnetic environment of a planetary surface (Weiss et al. Reference Weiss2014). Mobile measurements of the ambient magnetic field at the surface can be used to delineate regions of remnant magnetization (Lorenz et al. Reference Lorenz, Jones and Wu2003), identify the host rock and/or mineral carrier generating the magnetic field (Lillis et al. Reference Lillis2011) and assess the hazard related to highly energized cosmic or solar radiation (Dartnell et al. Reference Dartnell, Desorgher, Ward and Coates2007). At ‘regional’ scale, the micro-rover would detect changes in magnetic signature (e.g. short or long variations in magnetic intensity and patterns such as lineaments or circular anomalies). This information can serve to infer boundaries between geological domains and/or changes in regolith composition. Complex missions could involve several ‘scout’ micro-rovers instrumented with magnetometers performing geophysical mapping ahead of a larger and more sophisticated main rover. Magnetic maps compiled from data acquired by the micro-rovers would guide the trajectory of the main rover. At ‘local’ scale, detailed magnetic mapping can identify magnetic targets of scientific interest, locate subsurface geological features, which may host signs of extremophile development, and help to inform the precise locations where to perform astrobiological tests. Examples include the detection of small faults, which might be pathways for gas seepage to the surface (methane being of particular interest) (Boivin et al. Reference Boivin2013; Qadi et al. Reference Qadi2015), the delineation of feeder systems of hot springs, which are hosts to extremophiles (Samson et al. Reference Samson2017) and the tracking of lava tubes in the subsurface (Meglich et al. Reference Meglich, Williams, Hodges and DeMarco2003).
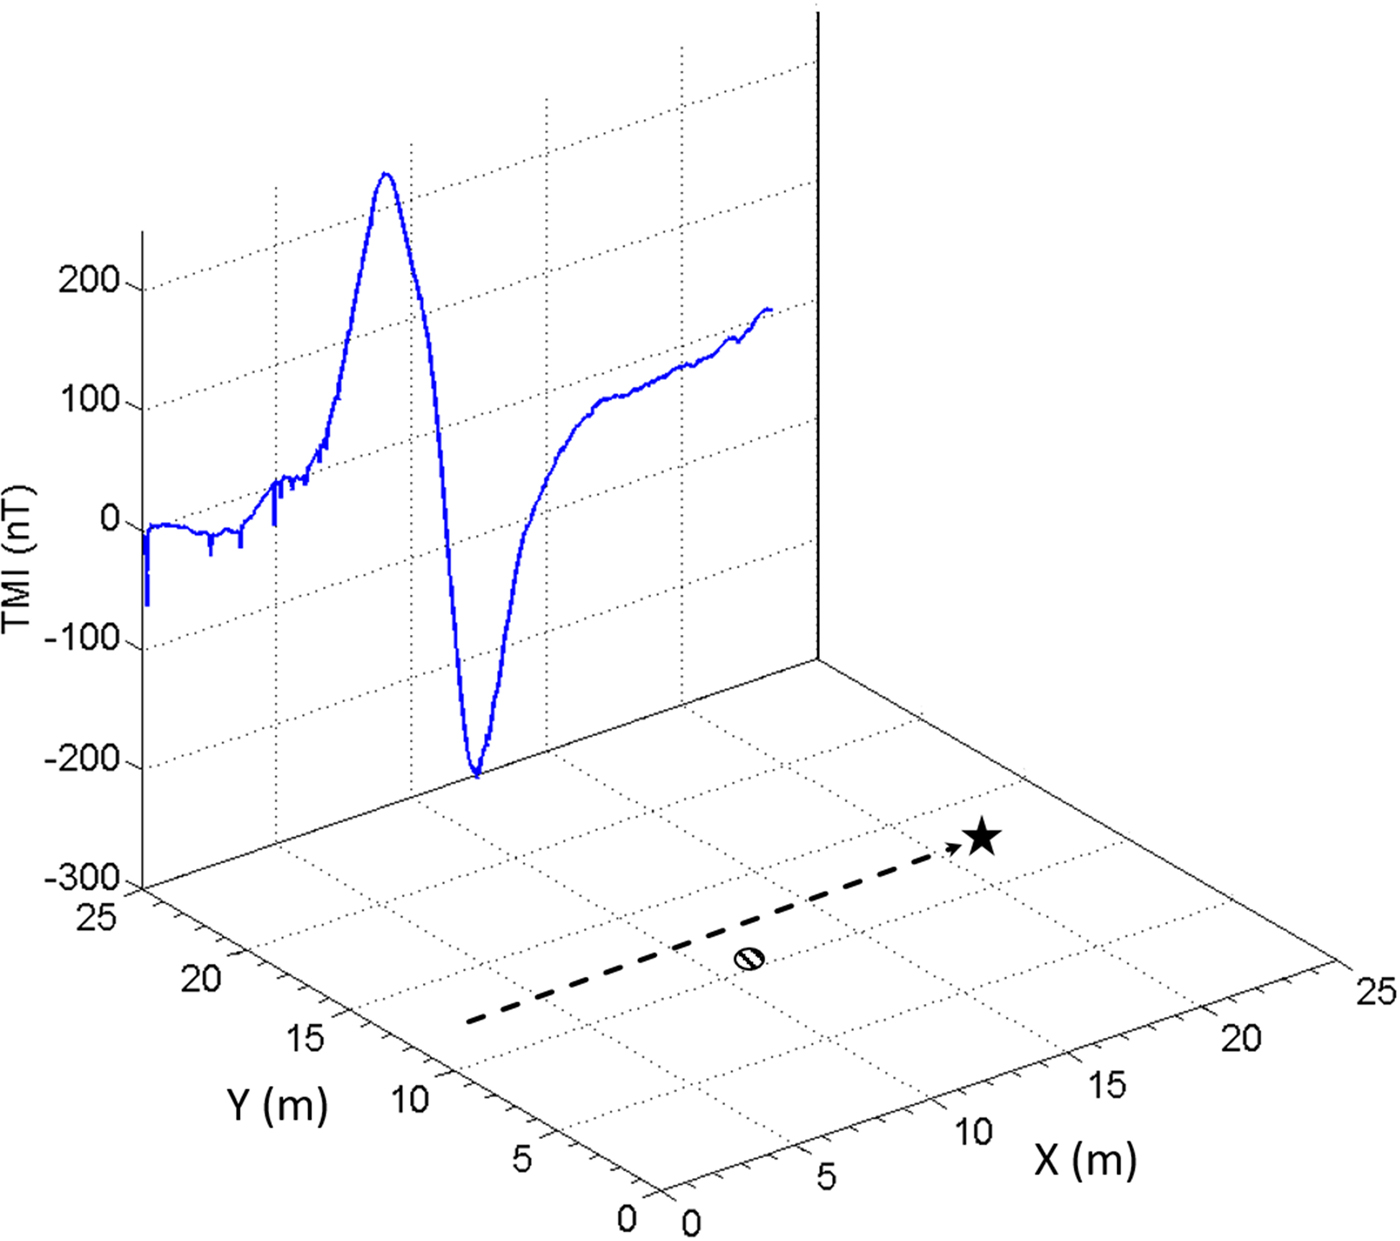
The magnetic method is a widely used terrestrial geophysical technique used to map geological trends and detect anomalous magnetic bodies in the subsurface. Figure 1 shows the magnetic anomaly created by a manhole cover at the surface (ferromagnetic material, 1 m diameter) measured by the magnetometer onboard the Kapvik micro-rover at a distance of 2 m. The robotic systems of a micro-rover may also generate a magnetic response (noise) which can obscure the magnetic signal detected. A magnetically clean micro-rover which generates negligible magnetic interference is desired for planetary exploration to maximize the response of the remnant magnetic signal (Lillis et al. Reference Lillis2011).
TMI illustration (vertical plane) of an anomalous response generated by a micro-rover traverse passing within 2 m of a ferromagnetic source. The micro-rover path in plan view is displayed (bottom) as a dashed arrow and star, with the position of a 1 m diameter manhole cover marked by a striped circle.

Magnetic measurements were first collected on another planetary body by the Apollo mission astronauts who deployed stationary (Apollo 12, 15, 16) and portable (Apollo 14, 16) fluxgate magnetometers to record magnetic data on the lunar surface (Dyal & Gordon Reference Dyal and Gordon1973). The first robotic magnetometer deployment followed in 1973, when the Lunokhod 2, a lunar rover, included a fluxgate magnetometer mounted on a long boom at the front of its chassis (Ness Reference Ness1979). Although data quality was limited by the influence of ferromagnetic components within the rover, these pioneering efforts generated datasets which were analyzed to detect and characterize magnetic variations within the lunar subsurface (Dolginov et al. Reference Dolginov1976). The Apollo 16 magnetic data proved useful in identifying anisotropic magnetic variations within the Lunokhod 2 dataset, which enabled modelling the composition and thickness of anomalous subsurface features at depths extending to 300 km beneath the lunar surface (Vanyan et al. Reference Vanyan1979). The future Mars InSight mission by NASA-JPL features a geophysical lander equipped with a stationary fluxgate magnetometer and is currently approved for launch in 2018 (Banerdt et al. Reference Banerdt2013). The data acquired by this magnetometer will be used to assess the level of remnant magnetization at the landing site and to monitor fluctuations in the ambient magnetic field strength and orientation at the Martian surface.
The research project described in this paper was a pilot study to use the Kapvik micro-rover in a new type of mission; robotic mapping of the near subsurface using the magnetic geophysical method. The objectives of the project were to determine a practical rover-magnetometer configuration, measure the impact of rover operations on sensor data quality and evaluate the capability of the Kapvik micro-rover to perform a robotic magnetic survey.
A robotic survey was mobilized in August 2015 on the campus of Carleton University, Ottawa, Canada, to map a 40 m × 15 m flat field adjacent to the Rideau rapids for magnetic anomalies. During the survey, the Kapvik planetary exploration micro-rover (Setterfield & Ellery Reference Setterfield and Ellery2013), instrumented with a potassium vapour magnetometer, was tele-operated within line of sight of the Kapvik base station over a predetermined grid. This paper presents total magnetic intensity (TMI) data gathered during the survey and the interpolation of local field strengths to outline magnetic anomalies for further interpretation of subsurface features.
Instrumentation and hardware
Magnetometers
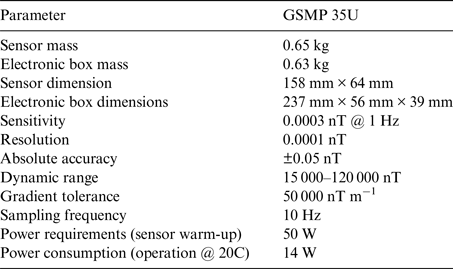
For the purposes of this study, a recently developed GSMP 35U potassium vapour magnetometer (Hrvoic & Hollyer Reference Hrvoic and Hollyer2015) was selected for integration with the Kapvik micro-rover. The design of this magnetometer has been customized for use on uninhabited aerial vehicles (UAV), which require a rapid sampling rate, high sensitivity, reduced dimensions and a low mass budget (Table 1). These parameters are also favourable for the magnetic evaluation of micro-rover interference in terrestrial applications. The potassium vapour magnetometer measures the amplitude of the total magnetic field B as a scalar value.
GSMP 35U potassium magnetometer specifications

To correct for diurnal variations and provide a magnetic baseline a Narod S-100 ring-core fluxgate magnetometer (Coles Reference Coles1988; Trigg & Olson Reference Trigg and Olson1990) was employed from an 11.5 km remote location in a magnetically quiet area. Magnetic baseline data were obtained at a 1 Hz sampling frequency, which is sufficient to evaluate the diurnal variations generated by interaction of Earth's geomagnetic field with the sun.
Kapvik micro-rover
The Kapvik micro-rover is an all-terrain modular multi-mission prototype designed for planetary exploration and scientific sample acquisition whose development was sponsored by the Canadian Space Agency. Kapvik is composed of a mobile rocker-bogie platform (Setterfield & Ellery Reference Setterfield and Ellery2013), robotic mast (Liu et al. Reference Liu, Liu, Zhang, Gao, Yuan and Zheng2015) and an array of scientific and navigational sensors. Kapvik's complement of sensors and equipment enables completion of a range of mission activities including: colour stereo vision imaging, digital elevation mapping, ultraviolet and infrared terrain examination, sample collection and measurement of mechanical soil properties. Missions are operated remotely or through a tethered configuration from Kapvik's base station, which consists of a radio transmitter, network infrastructure and laptops, which handle control of the micro-rover and monitor its operational status.
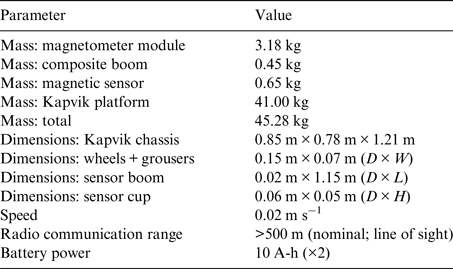
The Kapvik micro-rover (Table 2) was selected for robotic magnetic mapping due to its modular design, mobility and a magnetically quiet composition. The Kapvik chassis, mounting plates, wheel structures, suspension, fastenings and surfaces plates are constructed from aluminium, which has a low magnetic susceptibility. Active magnetic components mounted to the rover include actuators, electric motors and internal electronic switches. Some small ferrous steel fasteners are used to attach modules to the chassis assembly; these fasteners and other passive magnetic sources, however, are fixed in place and generate minimal magnetic interference. Kapvik's micro-rover mass budget (<50 kg) is capable of incorporating the payload requirement of a potassium vapour magnetometer and composite boom (4.28 kg). Once instrumented, the mass of the Kapvik micro-rover is 45.28 kg.
Instrumented Kapvik micro-rover specifications

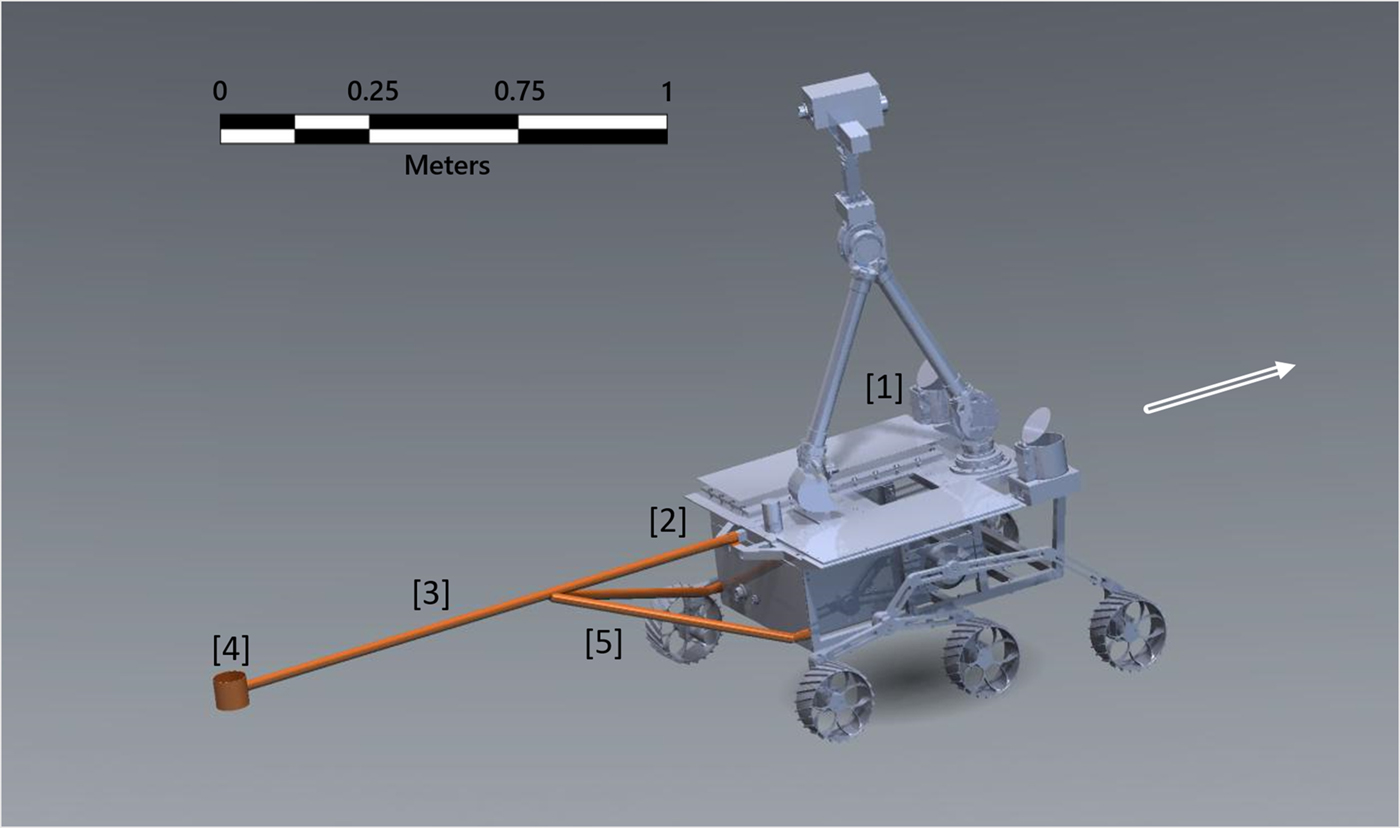
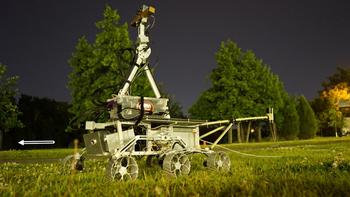
Integration of the GSMP 35U magnetometer onto the Kapvik micro-rover was accomplished by mounting the magnetometer sensor on a composite boom fixed to the rear rover chassis as rendered in Fig. 2. The Kapvik micro-rover was deployed using the configuration seen in Fig. 3 with the replacement of the fore-left cylindrical sample collection bin with a counterbalanced magnetometer module. The fore-right sample collection bin was also removed from the chassis as it contained permanent magnetic sources.
AutoCAD rendering showing the Kapvik micro-rover with mounting positions of the boom and magnetometer components. The micro-rover direction of travel is denoted by the hollow white arrow. [1] Magnetometer module mounting point. [2] Composite brackets fixed to rover chassis with aluminium bolts. [3] Composite boom, 1.21 m in length. [4] Composite sensor support cup. The magnetic sensor was fixed securely in position using compressed foam spacers, plastic zip-ties and Velcro strapping. [5] Composite support struts applied for additional support and to fix boom elevation angle.

Kapvik micro-rover, magnetic mapping configuration. The magnetometer module is shown (left) counterbalancing a boom and potassium vapour magnetometer (right). An Ethernet data and communication tether cable are seen dragging behind the rover through the grass. The micro-rover direction of travel is denoted by the hollow white arrow.

Composite boom
A prototype composite boom was designed and manufactured to mount the GSMP 35U magnetic sensor on the rear chassis of the Kapvik rover. In order to optimize boom length, static and dynamic magnetic noise tests were performed at incremental separations between the magnetic sensor and the rover chassis in the laboratory. The fourth difference method was selected as a metric to evaluate the level of magnetic noise generated during the tests (Teskey et al. Reference Teskey1991; Coyle et al. Reference Coyle2014). According to this method, the noise value at sample time (To) is defined as:
 $${\rm Noise}\;(\Delta T_{\rm o}) = \; \displaystyle{{\Delta T_{ - 2} - 4\Delta T_{ - 1} + 6\Delta T_{\rm o} - 4\Delta T_{ + 1} + \Delta T_{ + 2}} \over {16}}$$
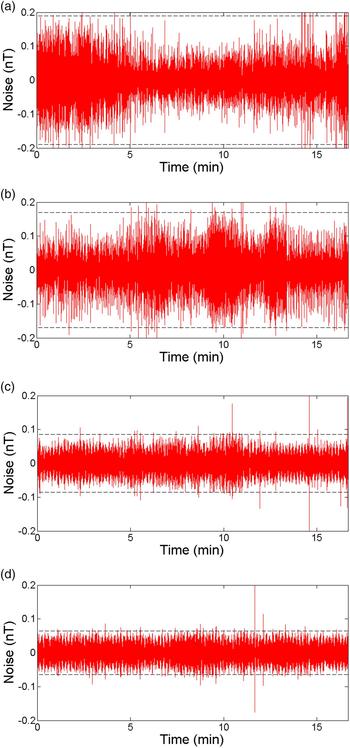
where ΔT −2, ΔT −1, ΔT +1, ΔT +2 are four magnetic values of the TMI sampled symmetrically with respect to ΔTo. An acceptable fourth difference noise limit for commercial airborne surveying is ±0.05 nT (Teskey et al. Reference Teskey1991; Coyle et al. Reference Coyle2014). During initial testing, the magnetic sensor was mounted on an inert plastic structure while the rover was positioned on a pedestal at 50 cm increments along a straight line away from the sensor. An activation sequence of Kapvik subsystems was initiated at each incremental distance and a fourth difference noise profile was generated. A summary of the fourth difference noise profiles generated at each distance is shown in Fig. 4. A marked 60% reduction in magnetic noise over the 0.70 and 1.20 m interval was observed whereas between 1.20 and 1.70 m noise reduction was only a further 10%.
Fourth-difference noise profiles for different chassis-sensor separation distances: (a) 0.2 m; (b) 0.7 m; (c) 1.2 m; (d) 1.7 m. The noise envelopes are displayed as black dashed lines.

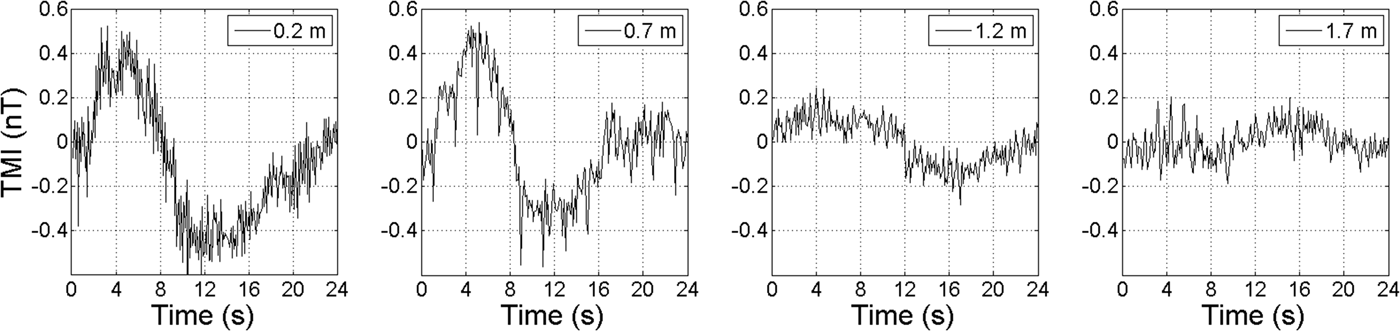
In a dynamic test the chassis wheels were activated for one full revolution of the wheels over a duration of 24 s. The test was repeated at four distances (0.2, 0.7, 1.2, 1.7 m). Figure 5 shows the resulting TMI data. The dynamic test confirmed the results of the initial test: noise is markedly attenuated when the distance increases from 0.7 to 1.2 m, but further improvement is reduced when the distance increases from 1.2 to 1.7 m. A prototype composite boom was therefore designed and manufactured to mount the GSMP 35U magnetic sensor at a distance of approximately 1.2 m from the rear chassis of the Kapvik rover, as a compromise between noise reduction and mechanical practicality.
TMI responses generated by one revolution of the Kapvik chassis wheels at distances of 0.2, 0.7, 1.2 and 1.7 m from a magnetic sensor.

The tubular boom was designed with a length of 1.15 m and an internal diameter of 2 cm. Epoxy impregnated fibreglass was chosen for its strength, light weight, ease of fabrication and low magnetic susceptibility. A cylindrical sensor support cup was fabricated from fibreglass and polyvinyl chloride (PVC) connectors and used to vertically mount the sensor at the end of the boom at a distance of 1.21 m from the chassis. By design, potassium vapour magnetometers operate at a prescribed optimal orientation with respect to the geomagnetic field. When the sensor is positioned close to magnetic sources, the orientation of the local field might fall outside the sensor's ‘active zone’, causing a loss of signal. This effect has been mitigated by raising the boom by an angle of 15° to increase the distance between the sensor and the ground. A bipod support structure was added to the design to distribute the weight of the sensor and to fix the boom elevation angle. The bipod support struts were fabricated using the same design and process as the main boom at a shortened length of 0.75 m. The boom was mounted to the chassis of the micro-rover using hybrid composite-PVC brackets. Off the shelf PVC components were selected for their modular design, low cost and deformability using heat treatment. They were reinforced and modified with composite to fit the chassis structure. The completed brackets were attached to the Kapvik rover using aluminium bolts already present within the structure of the chassis.
Magnetometer module
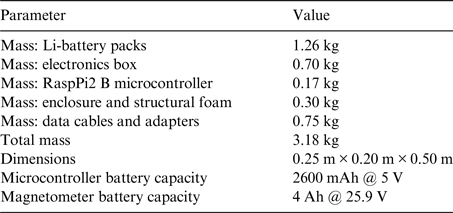
The potassium magnetometer's electronic components were built into a self-contained magnetometer module whose specifications are listed in Table 3. The module, comprising the GSMP 35U electronics box, RaspberryPi2 micro-controller, serial and USB data cables and lithium battery packs, was mounted to the rover chassis in place of a soil-sampling bin. By packaging these components as a module it was possible to replace the soil-sampling bins, which were a source of magnetic noise and counterbalance the boom-mounted sensor, which proved effective for maintaining the micro-rover at a horizontal operational pitch angle.
Magnetometer module specifications

By powering the magnetometer with a 25.9 V 4 Ah Li-battery and using a 5 V 2600 mAh battery pack for the microcontroller it was possible to operate the module for up to 6 h while keeping the magnetometer power supply separate from the rover subsystems.
Communications
Communication, data acquisition and magnetometer control was enabled using a RaspberryPi2 microcontroller bridged into the Kapvik network. The microcontroller was equipped with a Wi-Fi dongle and connected to the magnetometer electronics box via Serial-USB adapter. Wireless/Ethernet bridging was established to the Kapvik base station network enabling real-time data transmission and remote access to magnetometer functions. A secondary configuration was used to connect the micro-controller directly to Kapvik via the rover's Ethernet port using a data cable. This enabled the RaspberryPi2 to transmit and communicate using Kapvik's radio antenna. With this configuration the magnetometer module could be routed directly through Kapvik's communication network. Alternately, command and control of the Kapvik rover could be routed through the micro-controller's wireless network bridge, bypassing the radio antenna. During the field survey, an Ethernet tether from the rover to the base station was employed to ensure continuity of communications to both the rover and magnetometer module.
Robotic magnetic survey
Survey site
A robotic magnetic survey was performed with the Kapvik micro-rover in an urban environment primarily featuring local infrastructure.
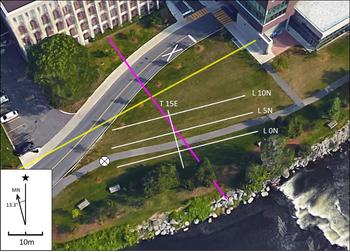
The survey site consisted of a 40 m × 15 m grid located 20 m south of the Herzberg Laboratories and 10 m west of Richcraft Hall on the campus of Carleton University as shown in Fig. 6.
Survey grid. The position of the survey lines (white), a subsurface storm sewer (purple), adjacent gas pipe infrastructure (yellow) and the location of the Kapvik robotic base station (circled X) are marked. Background image source: Google Earth.

The survey grid was oriented perpendicular to magnetic north with the survey profile lines extending from west to east. The tie-line was surveyed from north to south. The endpoints of all lines were geolocated by GPS and marked for use as navigational aids.
Local subsurface infrastructure included a sewer line cross-cutting the survey area and a gas line 3 m north of Line 10 N. Surface infrastructure consisted of a walking pathway running parallel between Line 0 N and Line 5 N, a roadway to the north of L10 N within 2 m of the survey area and a light rail line located 100 m to the east. In order to mitigate interference from active cultural noise sources the survey was conducted at night when vehicle traffic on the adjacent road was reduced.
Data acquisition
Kapvik was tele-operated by a human pilot via an Ethernet cable tether while recording TMI at a 10 Hz sampling rate. TMI data from each surveyed line was recorded in a separate file by the magnetometer in ASCII format and duplicated via real-time wireless transmission to an observation laptop. Each data point recorded was time-stamped by the magnetometer electronics with manually synchronized UTM timing. A log of anomalous events (such as vehicular and light rail traffic) and the time of occurrence were recorded manually.
Diurnal variations were interpolated from data recorded at the Ottawa Geomagnetic Laboratory, a magnetically quiet facility located approximately 11.5 km east of the survey site. This data was referenced to the rover data by UTM synchronized time-stamp.
The ‘dead-reckoned’ position of the rover was determined by interpolation based upon the time required to survey each line, the GPS position of line endpoints and a constant rover velocity of 0.02 m s−1 at 100% throttle. Profile line lengths were verified and marked using a 60 m fibreglass tape.
Magnetic data processing
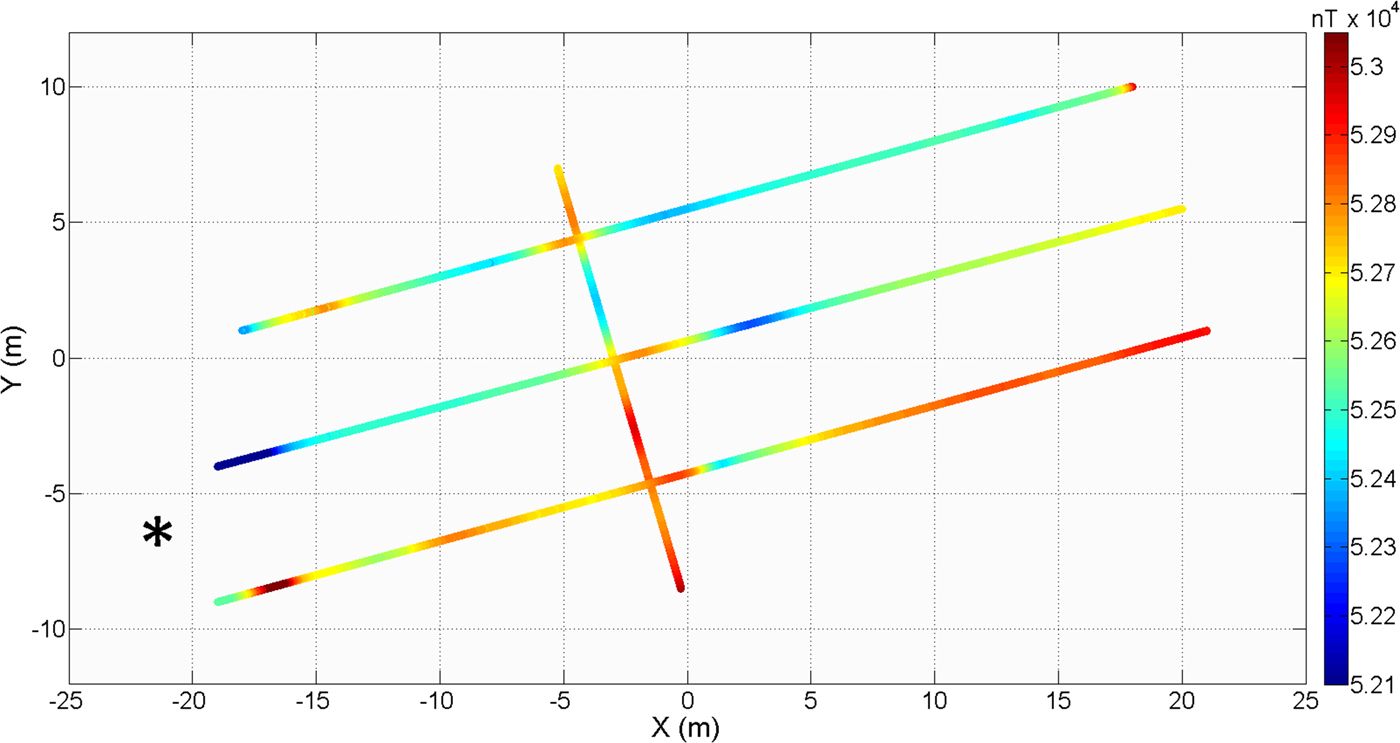
TMI datasets for each survey line were diurnally corrected using data recorded at the Ottawa Geomagnetic Laboratory. The observatory data were generated at a 1 Hz sampling frequency, which resulted in the diurnal correction algorithm correcting asynchronous data points with linearly interpolated values. These interpolated data points are considered valid due to the relatively slow rate of change of diurnal variations. The diurnally corrected data was then geolocated by stitching UTM coordinates to each data point by cross-referencing with the ‘dead-reckoned’ rover position dataset for each time-stamp. TMI for the three east-west lines was levelled by linear interpolation using tie-line intercept values and plotted to generate a spatially referenced magnetic dataset as shown in Fig. 7. The amplitude of local variations within the dataset was emphasized through normalization by removal of the ambient regional magnetic field of 52 500 nT and the application of a linear compensation to remove a 41 nT m−1 local trend, decreasing towards geographic north, from the dataset. This gradient was due in large part to significant infrastructure present adjacent to the survey grid (buildings, roadways). The resultant residual magnetic intensity grid was cropped to eliminate edge effects and a Delaunay triangulation (Lee & Schachter Reference Lee and Schachter1980) was applied to interpolate the data with respect to position.
Scatterplot of TMI versus geographical position, a regional gradient is present within the data. The Kapvik robotic base station was positioned at [−22, −7] (star symbol) and may have contributed to anomalous values observed at the western line endpoints.

Fourth difference analysis
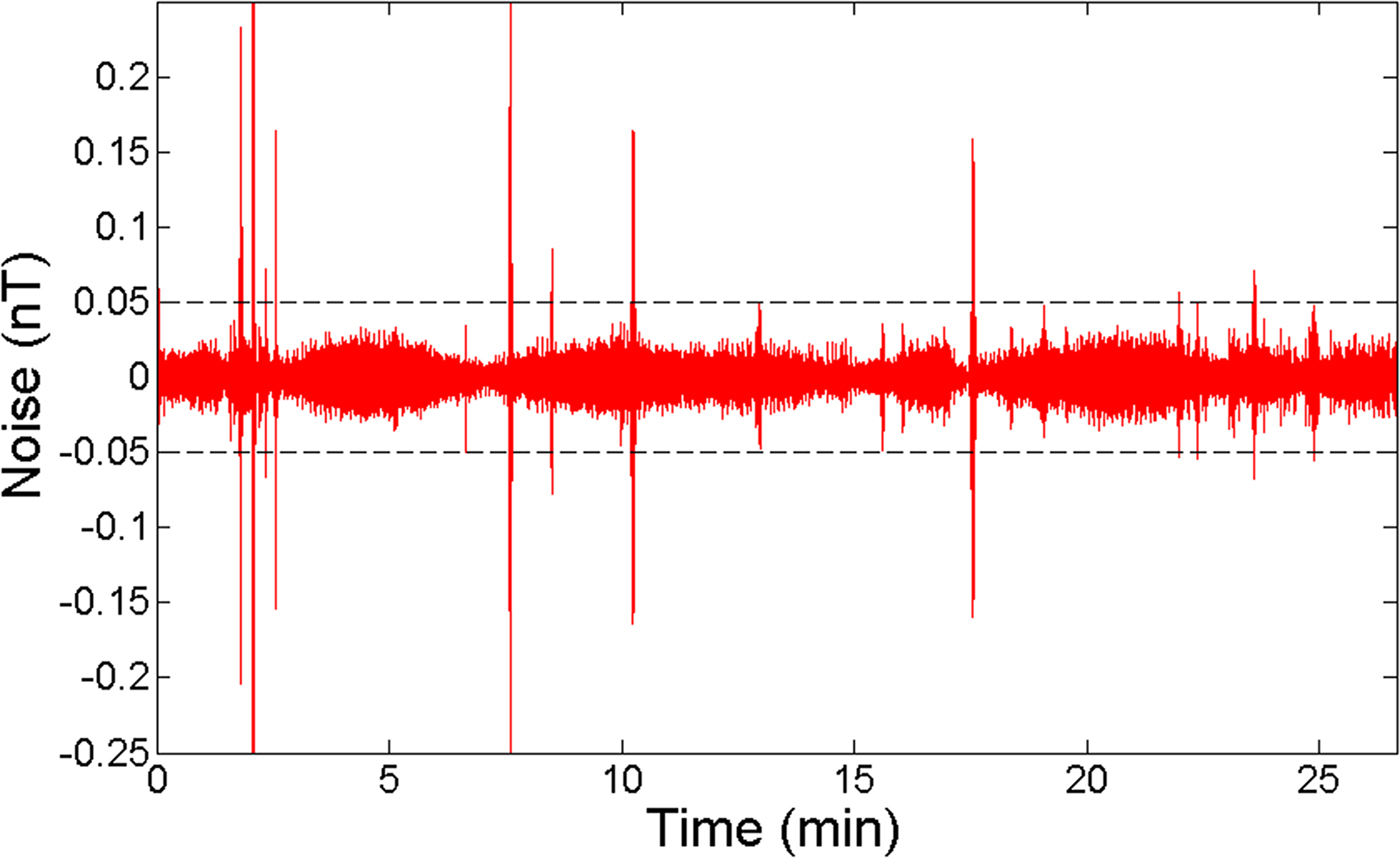
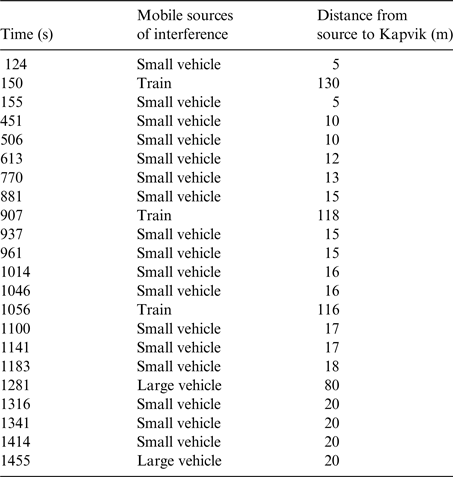
The fourth difference method was applied to evaluate the level of magnetic noise during rover operations. Noise profiles calculated using the fourth difference method display discontinuous noise as isolated spikes or a series of closely-spaced spikes forming a wavetrain and display continuous noise as a swath of consistent frequency. Spikes can be the result of external sources such as passing vehicles, DC sources (switches), crew-rover interactions, or spherics. Continuous noise may be attributed to vibrations affecting the sensor, oscillations of the rover attitude, ambient background noise of a specific frequency (such as interference by powerlines) or other periodic influences. The fourth difference noise profile of Line 10 N is chosen as an example to show the appearance of discontinuous noise sources (spikes) resulting from passing vehicles (Fig. 8). A detailed recording of all vehicles passing within view of the survey site for Line 10 N is presented in Table 4. The large spikes in the noise profile correlate well to the times at which vehicles passed in the vicinity of the survey site. Discounting the spikes, the noise envelope was estimated at ±0.03 nT. This noise envelope takes into account the ambient background noise, interference from robotic components and noise generated by the roving motion of Kapvik.
Fourth difference noise profile of line 10 N. The estimated noise envelope of ±0.03 nT is shown as dashed horizontal lines.

Cultural noise sources noted logged during data acquisition along Line 10 N

Spectral analysis
A discrete Fourier transform was applied to evaluate the spectral density of the magnetic data acquired during selected rover operations. Then 2500 time-series data points acquired at a 10 Hz sampling frequency were normalized, had a linear trend removed, and then used as input values to generate spectra. These spectra were calculated using overlapping fast Fourier transform segments of 500 data points with a Hanning window and then averaged to generate the linear spectral density response (Heinzel et al. Reference Heinzel, Rüdiger and Schilling2002). The resulting linear spectral density spectra describe the magnitude of the magnetic response in the frequency range of 0–5 Hz.
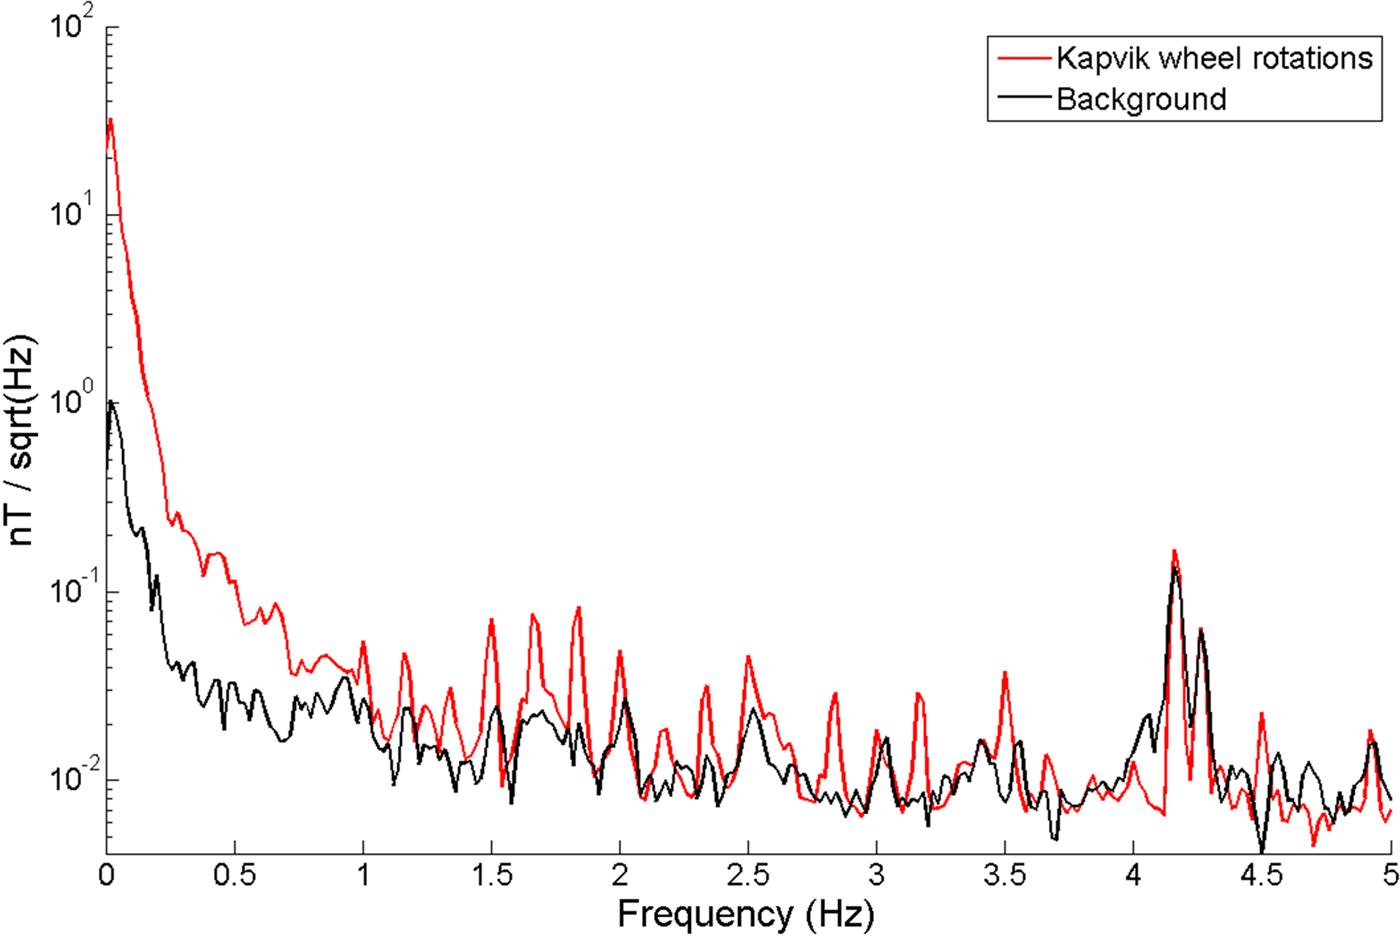
Figure 9 displays a comparison between spectra generated during active and passive testing of the chassis wheel rotation within a laboratory setting. A broad spectral response from 0 to 1 Hz with additional harmonics of a 0.125 Hz base frequency is noted within the dataset during activation of the chassis wheels. These readings were acquired within a magnetically noisy laboratory setting with a correspondingly elevated noise floor.
Linear spectral density plot of the Kapvik chassis wheel rotation response.

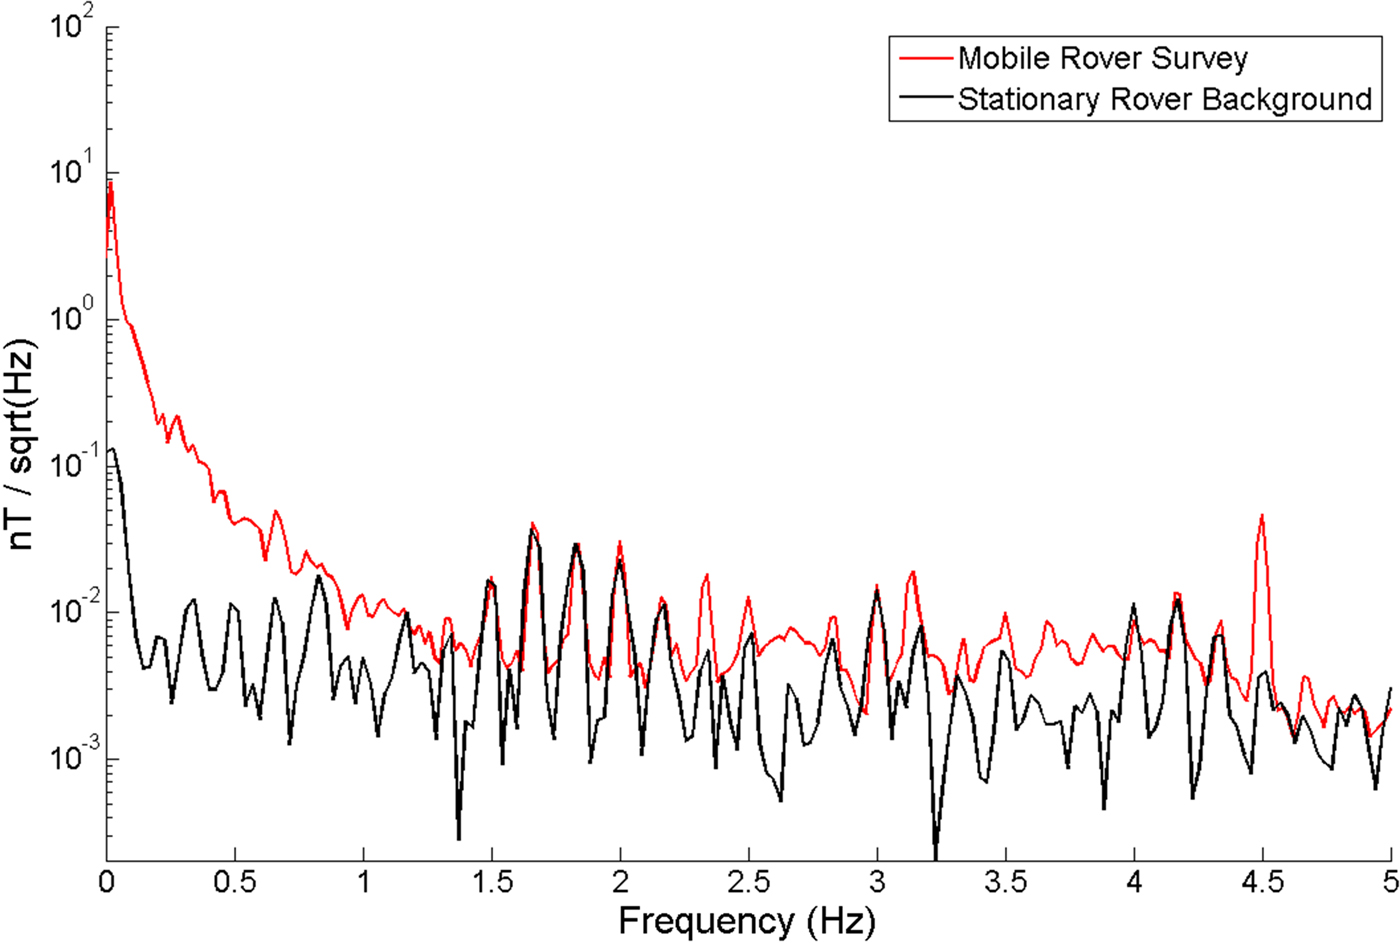
The spectral response of the micro-rover under field survey conditions is shown in Fig. 10. The ambient background spectra again display a clear harmonic with a base frequency of 0.125 Hz. The mobile rover spectra generate a broad spectrum response throughout the spectral range of 0–5 Hz as shown by the vertical offset. The difference in spectra response is primarily noted between 0–1, 2.66, 3.66 and 4.5 Hz where the variation is greatest. While the robotic survey site did have a lower ambient noise level when compared with the laboratory conditions, it should be noted that the ambient spectral noise is higher than would be expected of a non-urban survey environment.
Linear spectral density plot of robotic survey data.

At a roving speed of 0.02 m s−1, the magnetic response generated by environmental sources is generally expected to appear within the 0–1 Hz frequency range. Kapvik's wheels rotate with a period of approximately 22 s under survey conditions, at a frequency of approximately 0.045 Hz. A harmonic drive built into Kapvik's motor-gear assembly includes a wave generator containing ferromagnetic ball bearings (Ellery Reference Ellery2015). With a gearing ratio of 1 : 100 this component rotates at 100 times the period of the wheels and may be attributed to the spike at 4.5 Hz observed within the active rover spectra.
Interpretation and discussion
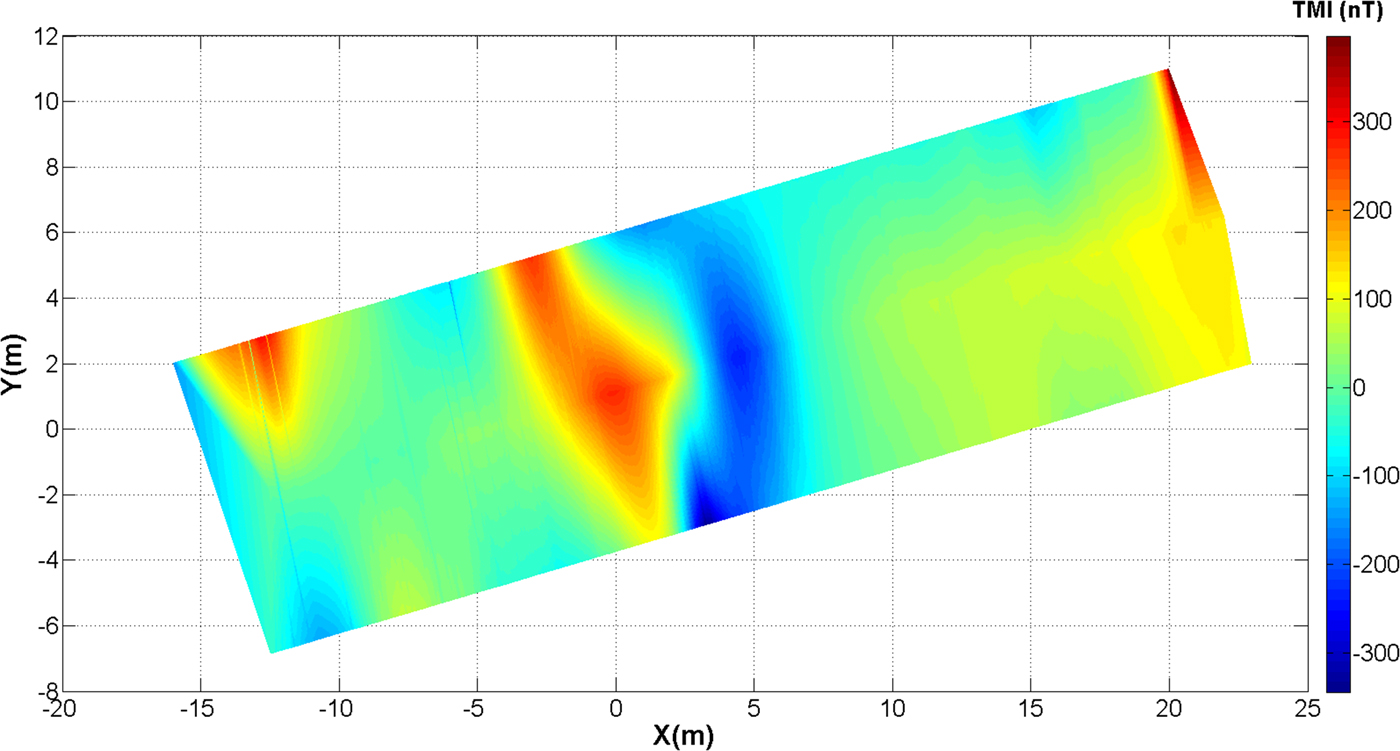
From the interpolated map of the residual magnetic intensity seen in Fig. 11 an anomalous dipole response of 650 nT describing a linear feature is clearly apparent in the centre of the grid. This anomaly coincides with the known position of a storm sewer buried at a depth of approximately 2 m as indicated on campus infrastructure service plans. A follow-up visual inspection of the small escarpment adjacent to the river south of the survey grid confirmed the presence of a ferromagnetic pipe at 2 m depth within the confines of the grid.
Delaunay triangulation of residual magnetic intensity. A dipole 650 nT in amplitude corresponds to a linear anomaly in the centre of the grid.

During the survey, the Kapvik micro-rover demonstrated that its rocker-bogie suspension caused negligible vibrations and physical oscillations acting upon the potassium sensor. The integrated systems operated within a noise envelope of ±0.03 nT under field conditions, when the rover was moving at its maximum speed of 0.02 m s−1, via tele-operation. Based on laboratory tests (see the section Composite boom), the rotation of the wheels was the largest source of continuous noise. Cultural responses observed from passing vehicles, especially trains, generated the highest amplitude discrete sources of noise.
Concluding remarks
Future work
In the future, not only the impact of each subsystem on magnetometer readings should be assessed more rigorously in isolation and in controlled conditions, but their combined impact also needs attention. Employing operation methodologies where a magnetic offset is measured during activation of additional subsystems is essential. By returning subsystems to a standard reference configuration the uncertainty related to magnetic offsets can be reduced significantly.
Scientific instruments such as ground penetrating radars (Ciarletti et al. Reference Ciarletti2011; Hamran et al. Reference Hamran2015) and electromagnetic induction sounders (Boivin et al. Reference Boivin2013) actively emit electromagnetic signal as part of their standard operations. The same can be expected from other active scientific instruments mounted on the rover such as the articulated arm and end effector instrumentation.
Results of this preliminary robotic survey open several lines of investigation for future applications of micro-rovers for planetary exploration. The GSMP 35U magnetometer used in this study has been optimized for the range of magnetic field intensities typically encountered in terrestrial environments (15 000–120 000 nT). This operational range is atypical of other planetary bodies within the solar system and would limit the use of the magnetometer to terrestrial qualification applications. A second limiting factor for the use of this magnetometer in extraterrestrial environments is the relatively large power required to maintain thermal stability. Alternate magnetometers need to be tested for the TMI range expected during a planetary mission. This range would vary according to the planetary body under consideration.
Finally, not all magnetic data acquired by the rover needs to be telemetered to Earth-based operators. A mapping mission would benefit from onboard algorithms and sufficient processing power to allow the rover to survey with some degree of autonomy (Castano et al. Reference Castano2007; Woods et al. Reference Woods2009; Gallant et al. Reference Gallant, Ellery and Marshall2013). If robotic magnetic mapping is done as part of regional scouting for targets of astrobiological interest, change detection algorithms would only alert operators if there is a departure from baseline readings. To maximize opportunity for science, algorithms could be developed to guide the rover to survey in the direction corresponding to the highest spatial gradient of the magnetic field.
Summary of results
This study focused on rover-magnetometer integration. The global impact of the rover on magnetic data was first considered and distance tests were performed to determine the optimal boom length. A length of 1.2 m was selected as a compromise between reducing noise and mechanical stability. Further tests sought to isolate the effect of different noise sources. Despite these rover-related sources of noise and additional cultural noise present in the urban environment where the field survey took place, the noise envelope of field data was ±0.03 nT during nighttime operations. As a point of comparison, a noise envelope of ±0.05 nT or less is considered acceptable for commercial airborne magnetic surveys (Coyle et al. Reference Coyle2014). The relatively low level of noise of the magnetic data recorded by the Kapvik micro-rover is mostly due to its very slow speed. The magnetic data acquired during the robotic survey identified an anomalous linear feature corresponding to a magnetic dipole 650 nT in amplitude. The system should be capable of detecting much more subtle targets.
Acknowledgements
This research project has been funded by a NSERC (Natural Science and Engineering Research Council of Canada) ENGAGE grant to Dr Claire Samson, in collaboration with GEM Systems. The authors thank GEM Systems for the loan of the GSMP 35U magnetometer as an in-kind contribution to the project. The authors thank Benôit St-Louis, Lorne McKee and Nathan Olfert of the Department of Natural Resources Canada at the Geomagnetic Observatory for providing both technical support and observatory datasets. The authors would also like to thank Dr Alex Ellery of the Department of Mechanical and Aerospace Engineering at Carleton University for granting access to the Kapvik micro-rover.