


Introduction
Glacier monitoring dates to 1894 with the establishment of the International Glacier Commission (for a brief historical review see Reference HaeberliHaeberli, 1998), and modern coordinated global efforts date to the International Hydrological Decade of the 1970s (Reference NaceNace, 1969). The global monitoring effort was based on selected glaciers ‘typical’ of their basins and distributed across different climatic regions (UNESCO/IASH, 1970). In addition to measuring the mass balance of each ‘typical’ glacier, heat and water balances were to be monitored as well. This far-sighted effort resulted in a wealth of data on glacier change, on which we now rely to understand the effects of climate change on glaciers (Reference Oerlemans and FortuinOerlemans and Fortuin, 1992; Reference Bitz and BattistiBitz and Battisti, 1999; Dyurgerov and Meier, 2000) and the effects of glacier shrinkage on sea-level change (Reference MeierMeier, 1984; Reference MeierMeier and others, 2007). These ‘typical’ glaciers are used to infer glacier changes over broad regions for the purpose of estimating effects on regional runoff (e.g. Dyurgerov and others, 1992; Reference Hagen, Kohler, Melvold and WintherHagen and others, 2003; Reference Kaser, Juen, Georges, Gomez and TamayoKaser and others, 2003) and for global sea-level rise (Reference MeierMeier, 1984; Reference Kaser, Cogley, Dyurgerov, Meier and OhmuraKaser and others, 2006). However, it is unclear how well these ‘typical’ glaciers mirror the glacier activity within their respective regions.
Some cause for concern exists because the selection criteria were qualitative, as no quantitative data existed on the population of glaciers within the region at the time of selection. Also, the glaciers, by necessity, were partly selected for accessibility to the glacier and to most parts on the glacier. This made field logistics much simpler and less expensive. Finally, the glaciers needed to have well-constrained stream channels so streamflow could be gauged and water budget calculated. For these very practical reasons, the final choice of a representative glacier may be quite different from a ‘typical’ glacier in the region.
Finally, one has to consider how to define ‘typical’. One way to characterize a glacier is through its topographic characteristics, including area, elevation, area–elevation distribution, slope and aspect. Another criterion may be location, that is, position relative to the center of the glacier-covered region. A final criterion may be activity. Does the ‘typical’ glacier respond to climatic variations in a way similar to the other glaciers in the region? The influence of local effects, such as shading and avalanching, relative to regional climate influences, may cause a glacier to be more or less sensitive to variations in regional climate (Reference Hoffman, Fountain and AchuffHoffman and others, 2007).
This paper summarizes a case study of South Cascade Glacier, the US Geological Survey’s ‘benchmark glacier’ for the North Cascades Range of Washington State. We examine the topographic characteristics of South Cascade Glacier relative to the glaciers in the surrounding region and explore the temporal change (1958–98) of South Cascade in relation to glaciers nearby. This comparison is based on the strategy for monitoring glaciers broadly outlined by Reference Fountain, Krimmel and TrabantFountain and others (1997), and we adopt their terminology to distinguish the glaciers. The ‘benchmark’ glacier is the single glacier in a region that is intensively studied through detailed measurements of mass balance, streamflow, meteorological conditions and changes in geometry. The benchmark glacier corresponds to a tier 2 site in the Global Hierarchical Observing Strategy (GHOST) used by the World Glacier Monitoring Service (Reference Haeberli, Cihlar and BarryHaeberli and others, 2000). Measurements on a limited number of ‘secondary’ glaciers (GHOST tier 3) within the region are limited to mass balance and geometry changes. Finally, a ‘remotely sensed’ inventory (GHOST tier 5) comprises the majority of glaciers in the region, and each is measured for geometry change at multi-decade intervals.
Site Description And Methods
The North Cascade Range is located at 48° N,120° W, near the US–Canadian border in the northwest region of Washington State. The range is glacially carved with significant relief from <100m to >2800ma.s.l. The climate of the region is strongly maritime, with up to 300cm of precipitation falling mostly between November and May (Reference Post, Richardson, Tangborn and RosselotPost and others, 1971). Air temperatures are moderate, with a mean annual air temperature at South Cascade Glacier of 1.4°C (Reference Meier and TangbornMeier and Tangborn, 1965). All the glaciers in the region can be characterized as small (<7 km2) maritime temperate glaciers (Reference HubleyHubley, 1956; Reference LaChapelleLaChapelle, 1960; Reference Granshaw and FountainGranshaw and Fountain, 2006).
Our dataset consists of mass-balance measurements made on one benchmark glacier (1958–2005) and four secondary glaciers (1993–2005), and area changes on 321 remotely sensed glaciers in the region (1958–98). The benchmark glacier is South Cascade Glacier, one of the original glacier sites of the International Hydrological Decade. The US Geological Survey monitors both the mass and water balance of the glacier, and records meteorological measurements in the basin (e.g. Reference Bidlake, Josberger and SavocaBidlake and others, 2004). South Cascade Glacier has been monitored since 1958 (Reference Meier and TangbornMeier and Tangborn, 1965), and because of this long record, in addition to the ancillary data collected, it is considered the ‘benchmark’ glacier for this region. The four secondary glaciers have been monitored for mass balance only by the US National Park Service since 1993 (Reference Pelto and RiedelPelto and Riedel, 2001). These four glaciers form the secondary glacier network that can be used to help extrapolate mass balance to other glaciers in the region. Finally, the tertiary network is composed of remotely sensed glaciers where only area changes are defined with the intention of inferring mass changes over the region.
Both the secondary and remotely sensed glaciers are located in the North Cascades National Park Service Complex, a federal land holding that includes the park and two recreation areas (Fig. 1). This region was chosen because it was the subject of a previous study and the data are readily available (Reference Granshaw and FountainGranshaw and Fountain, 2006). The benchmark glacier, South Cascade, is located about 10 km outside the Complex to the southwest, but the glacier is nominally considered representative of the glacierized region in the states of Washington and Oregon, approximately 800 km from north to south (Reference MeierMeier, 1984; Reference Fountain, Krimmel and TrabantFountain and others, 1997). For our analysis we rely on data from the US Geological Survey for South Cascade Glacier (e.g. Reference KrimmelKrimmel, 1997; Reference Bidlake, Josberger and SavocaBidlake and others, 2004), the National Park Service for the secondary glaciers (Table 1), while for the remotely sensed glaciers we draw from Reference Granshaw and FountainGranshaw and Fountain (2006). The remotely sensed glaciers were last mapped in 1998 using aerial photography, which was later converted to digital orthophotographs, from which we estimate area but not topography. We make the comparisons to 1958 rather than more recent dates because the topography of all the glaciers was last mapped in 1958. To facilitate comparison we also use values dating to 1958 for the benchmark and secondary glaciers.
1. Location of the North Cascades Park Complex, the four Park Service secondary glaciers and the USGS benchmark glacier, South Cascade.

Topographic characteristics of the total population of glaciers (321 glaciers) in the North Cascades Park Complex, the benchmark and secondary glaciers as of 1958. Average values for the glacier population are denoted by asterisks (∗), and the minimum (Min.) and maximum (Max.) elevation above mean sea level of the population of glaciers refers to the centroid of the lowest and highest glacier, respectively. Otherwise, Min. and Max. refer to the elevation range for the named glaciers. Ave. refers to the average elevation

Glacier Characteristics
Topographic characteristics were measured in 1958 for all glaciers in the region including the benchmark and secondary glaciers (Fig. 2). The benchmark glacier is larger than 95% of the glaciers in the region, with a mean elevation about 115 m lower than the average of the population, and the gentlest mean slope of all glaciers in the region. Of the secondary glaciers, three are larger than 85% of the population and one is close to the median (69% are smaller). The elevations of the secondary glaciers are biased towards the higher elevations, and their slopes are biased toward lower angles. The area changes over the 40 year period show that most glaciers in the region decreased in area by 10% or less, with some glaciers shrinking almost 60% (Fig. 3). A few glaciers may have advanced. Three of the secondary glaciers reflect the small area change exhibited by most of the glaciers. The area change of one secondary glacier (Silver) was larger, and the benchmark glacier exhibited a large area change (–23%) experienced by a relatively small fraction of the glaciers.
Topographic characteristics of the glaciers in the North Cascades Park Complex. (a) Size – number of glaciers expressed as percent number of glaciers smaller than a given area; (b, c) mean elevation plotted against area (b) and mean slope (c) for each glacier. The black square is the benchmark glacier, South Cascade Glacier, and the open triangles are the secondary glaciers.

Number of glaciers per fractional area change. The triangles represent the secondary glaciers, and the rectangle represents the benchmark glacier.

To examine whether a correlation exists between area change and glacier area, the two variables were plotted together (Fig. 4). Small glaciers (<0.5km2) exhibited the greatest variability in change, and the larger glaciers tend to show the least. Three of the secondary glaciers are well within the population of glacier change, one was slightly outside, and the benchmark glacier had anomalously large fractional area change relative to its large area. If we apply the area change value from the benchmark and secondary glaciers to the entire population to infer regional area change, we find a large range of values (Table 2). If we use the area change of South Cascade Glacier or Silver to infer changes in the region, the result exaggerates the area shrinkage by a factor of three. If North Klawatti, Noisy Creek or Sandalee Glaciers are chosen, then the estimated area change is nearly within the uncertainty of the measured change.
Area change (1958–98) for the population of glaciers in the North Cascade Complex compared with the area change of the population as inferred from the benchmark glacier (South Cascade) and the secondary glaciers. The percentage change is that measured for the population or glacier. The volume change for the total population is based on area–volume scaling (Reference Granshaw and FountainGranshaw and Fountain, 2006), for South Cascade it is derived from field measurements (Reference Bidlake, Josberger and SavocaBidlake and others, 2004), and for the secondary glaciers it is based on a regression between field measurements from each glacier with the benchmark glacier

Fractional area change plotted against initial glacier area. The grey shading indicates uncertainty (Reference Granshaw and FountainGranshaw and Fountain, 2006).

Mass Balance
Another way to evaluate whether a benchmark glacier is typical of the region is to consider the mass-balance record. The year-to-year mass-balance variations of the benchmark glacier show very good correspondence with the secondary glaciers (Fig. 5). The correlation coefficient (r 2) between the benchmark glacier and each of the secondary glaciers was excellent, with the two correlations exceeding 0.92. Other correlations were >0.75 but ignored. The overall high correlation is to be expected given that the climate is regional, and temporal variations in winter snow accumulation and summer melt should extend across a broad region. Year-to-year mass-balance variations are well represented by the benchmark glacier and for that matter any of the secondary glaciers or perhaps any glacier in the region.
Yearly (a) net mass balance and (b) cumulative values for the benchmark glacier, South Cascade Glacier, and the four secondary glaciers in the region.
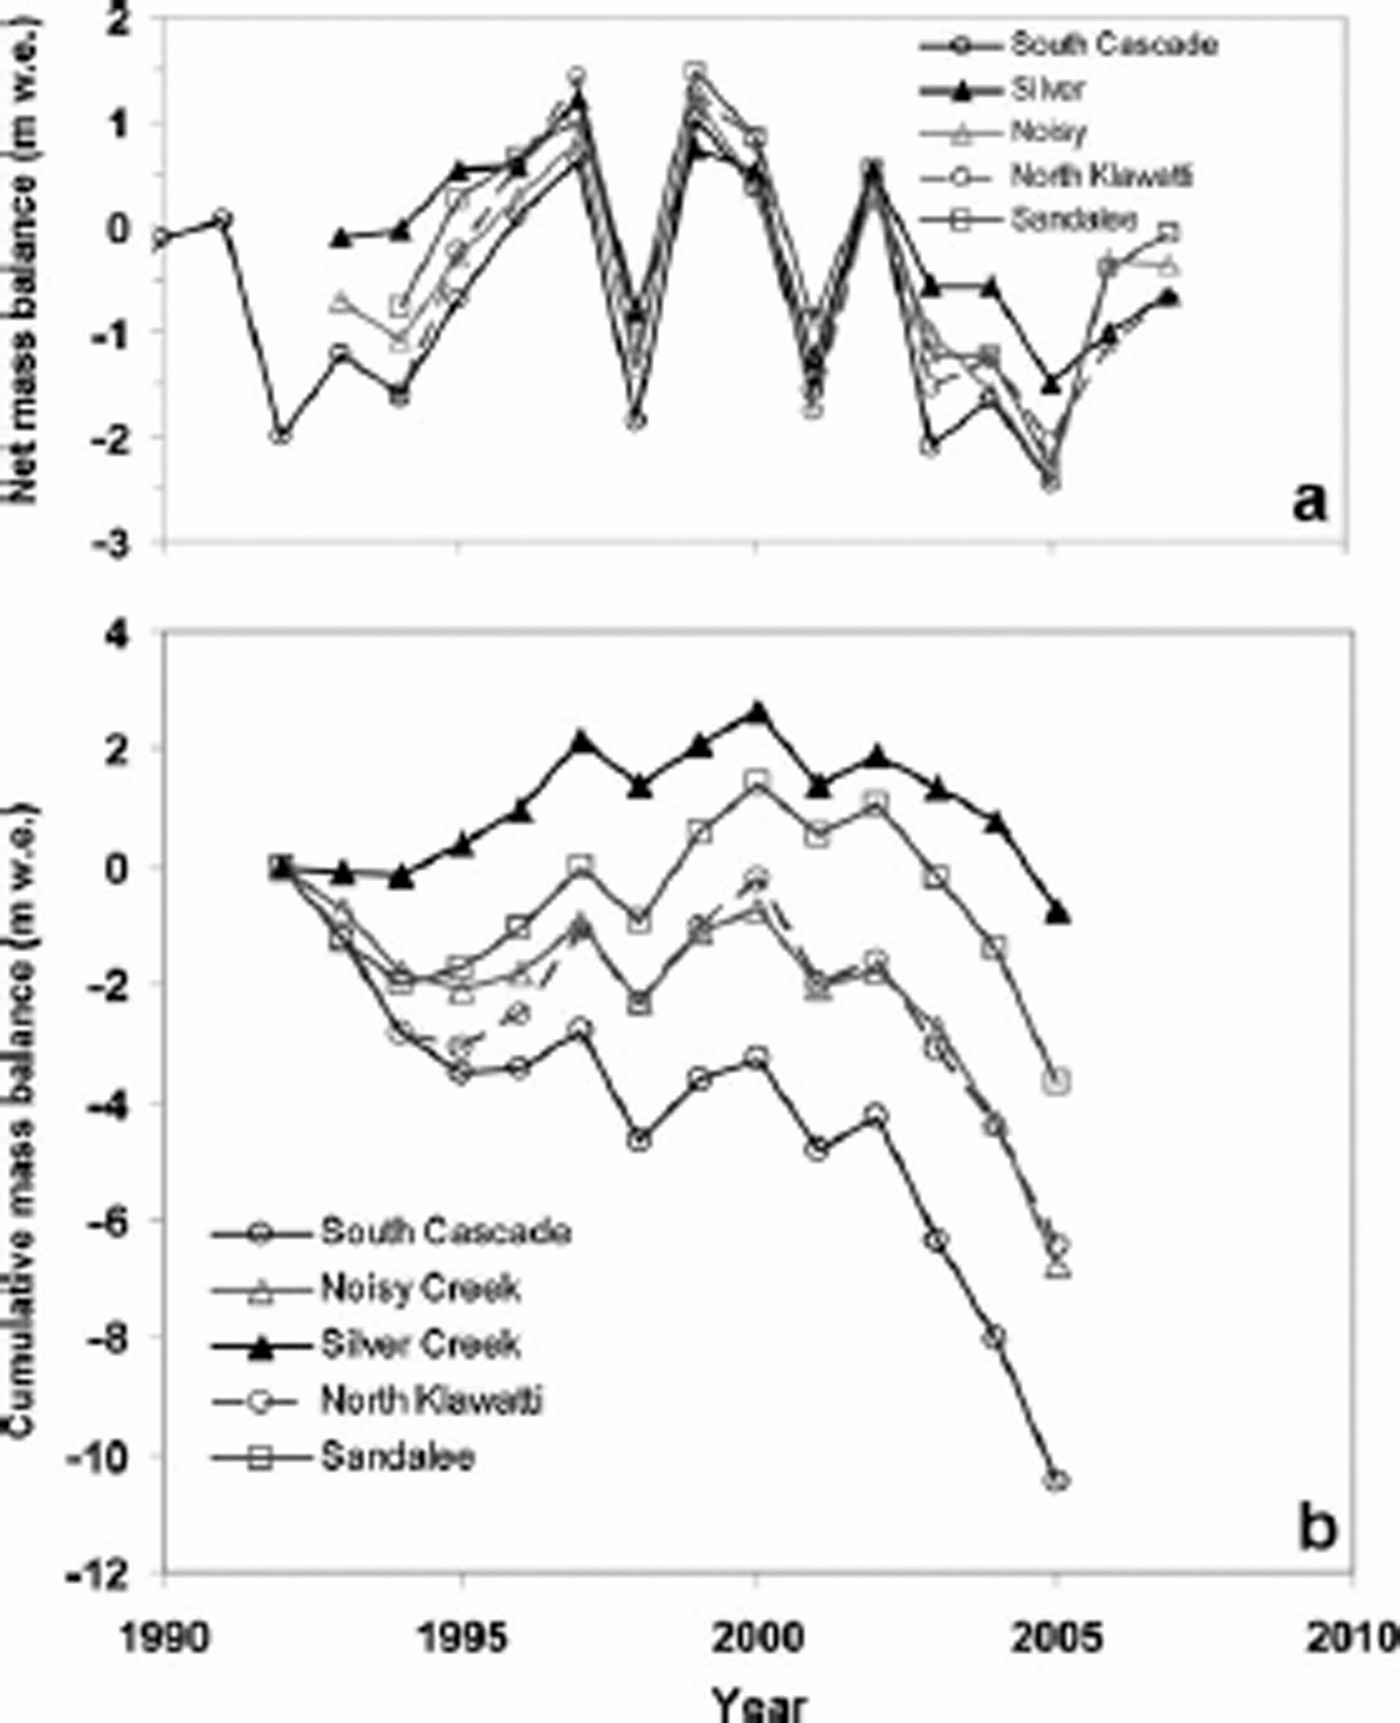
The mass balance of each of the glaciers is slightly different, such that South Cascade is generally the most negative of all the glaciers and Sandalee or Silver is the most positive. The cumulative sum of mass balance shows that these small differences are critical to the mass change of each glacier (Fig. 5). Silver Glacier generally maintained a positive balance from 1993 to about 2002, after which losses dominated, resulting in a mass change over the period of –0.71mw.e. South Cascade Glacier, in contrast, maintained a cumulative negative balance throughout the entire period, resulting in a mass balance of –10.5mw.e. The trends of the other glaciers were bounded by those of Silver and South Cascade Glaciers. Therefore, small differences in mass balance between glaciers have profound consequences for differences in cumulative mass loss and it is clear that the selection of a representative glacier has an important influence on assessment of mass loss in the region. For the period 1993–2005 using the benchmark glacier, one would infer an average specific mass loss (average surface lowering) of –10.5mw.e. for all the glaciers in the region. Using the 1998 glacier area (109.06km2) the estimated release of water from its storage as ice is 1.15 km3, whereas if one used Silver Glacier, the estimated release is 0.08 km3. Because we do not have information on the mass balance of the population, we cannot definitively say which glacier is more representative.
However, we can estimate population mass loss approximately using area–volume scaling (Reference Chen and OhmuraChen and Ohmura, 1990; Reference Bahr, Meier and PeckhamBahr and others, 1997). Using such techniques, Reference Granshaw and FountainGranshaw and Fountain (2006) estimated the total ice
volume loss from the Park Complex between 1958 and 1998 to be 0.8 km3w.e., equivalent to a specific volume loss of –6.7mw.e. The benchmark glaciers, with mass-balance measurements that span the 40 year period, show a specific volume loss of –20.7 m. To determine the specific mass loss of the secondary glaciers, we correlated the net mass-balance values from each secondary glacier to that for the benchmark glacier and calculated the cumulative change (Table 2). Of the three glaciers examined, including the benchmark glacier, North Klawatti Glacier best approximates the specific mass loss of the glacier population.
Discussion And Conclusions
The regional benchmark glacier concept is fundamental to assessing regional glacier contribution to water runoff (Reference Dyurgerov, Kunakhovitch, Mikhalenko, Sokalskaya and KuzmichenokDyurgerov and others, 1992) and to global sea-level rise (Reference MeierMeier, 1984; Reference Oerlemans and FortuinOerlemans and Fortuin, 1992; Reference Dyurgerov and MeierDyurgerov and Meier, 2000; Reference Kaser, Cogley, Dyurgerov, Meier and OhmuraKaser and others, 2006). Historically, logistical constraints and funding limitations precluded quantifying ice-mass changes over large areas because of the time-intensive nature of the fieldwork. Therefore intensive study on one glacier was the only cost-effective approach. Recently, so-called geodetic mass-balance methods, which infer mass change from glacier surface elevation measurements at different times, have been extended to groups of glaciers using techniques such as photogrammetry, lidar, laser altimetery and satellite- and shuttle-obtained topography (e.g. Reference Arendt, Echelmeyer, Harrison, Lingle and ValentineArendt and others, 2002; Reference Larsen, Motyka, Arendt, Echelmeyer and GeisslerLarsen and others, 2007). Additionally, satellite-borne gravimetric measurements have been used to measure regional mass changes directly (e.g. Reference LuthckeLuthcke and others, 2006). However, these methods have yet to be applied extensively and the benchmark method is still quite current.
We examined several interpretations of ‘typical’, including topographic characteristics, area changes, annual mass-balance variations and cumulative mass changes. Results showed that the benchmark glacier, South Cascade, was quite different from most of the glaciers in the North Cascades National Park Service Complex. South Cascade Glacier is larger and with a much gentler slope than the average glacier. The secondary glaciers were generally closer to the average glacier although they too tended to be a bit larger and lower in slope than the average. Practical selection issues, such as access, ease and safety of surface travel, and scientific interest, will bias the selection towards larger, less steep glaciers. Area changes over the past 40 years showed that the benchmark glacier changed more than the secondary glaciers and most of the population. The change is unusual for its size, in that larger glaciers tended to change less. Three of the four secondary glaciers exhibited changes typical of their size class. The yearly net mass balance showed almost identical variations, indicating the influence of regionally uniform climate. In this sense, any of the glaciers, benchmark or secondary, could be considered typical.
However, cumulative sum of mass change over the measurement period 1993–2005 showed that some glaciers changed much more than others. The benchmark glacier lost the most (10.5mw.e.), whereas the secondary glacier Silver lost only 0.71 mw.e., an order-of-magnitude difference. Small differences in annual mass balance result in large cumulative differences and, consequently, differences in area change. We should not expect the magnitude of change to be identical between glaciers despite a spatially uniform regional climate variation. Therefore, depending on which glacier is selected as the reference, the inferred change for the population of glaciers could also differ by an order of magnitude. The total volume change for the population over a 40 year period (1958–98), estimated from area–volume scaling, showed that the mass change estimated for two secondary glaciers was relatively close (≤3.1m difference) to that for the population. However, the benchmark glacier showed an order-of-magnitude difference.
That the benchmark glacier has lost much more mass than the secondary glaciers may be due partly to its low slope. In a comparison between South Cascade and Blue Glaciers, Reference Rasmussen and ConwayRasmussen and Conway (2001) argued that the greater mass loss of South Cascade was due to its lower slope and thicker ice, especially in the lower ablation zone. Consequently, South Cascade Glacier has not yet completely adjusted to the end of the Little Ice Age, whereas Blue Glacier has adjusted. Of course, difference in slope is one of many factors affecting changes in glacier mass and area loss, and by itself is not a determining factor (Reference Granshaw and FountainGranshaw and Fountain, 2006). Despite the differences in total mass loss, the annual variations in net mass balance of the benchmark glacier accurately reflect the variations of glaciers in the region, as illustrated by the excellent statistical correlations. Reference Pelto and RiedelPelto and Riedel (2001) found similar results in their analysis of glacier variations in the North Cascade Range and support the view of a regionally uniform climate forcing. Therefore, differences between glaciers largely result from differences in local topographic effects (e.g. elevation, slope, aspect) that control both snow accumulation and ablation.
In conclusion, the use of benchmark glaciers to infer glacier change in a region is an important historical legacy from the recent past when technologies for assessing changes in regional glacier cover did not exist. Our findings show that the benchmark glacier (and all the secondary glaciers) accurately tracks yearly mass-balance variations. No especially ‘typical’ topographic characteristics seem to be necessary, such as glacier size or elevation. However, area changes and cumulative mass change are quite sensitive to the glacier chosen. Monitoring a glacier with topographic characteristics that typify the glaciers in the region increases the chances of choosing a glacier which has cumulative mass changes that reflect those of other glaciers in the region; however, it does not guarantee success. Given that all glaciers reflect temporal climate variations, the large year-to-year variations in mass balance mask the more subtle issue of small glacier-to-glacier differences in mass balance that result in large and significant cumulative mass change differences between glaciers. Apparently, there is no a priori way of knowing which glacier will serve as regionally representative, and this must be evaluated after the fact. Therefore, assessment of the benchmark glaciers in each region should be conducted in comparison with regional changes to reduce the now apparent uncertainty in regional mass change and to improve estimates of sea-level change resulting from the ice loss from alpine glaciers.
Acknowledgements
This work was supported by US National Science Foundation grant BCS-0351004, NASA grant NNG04GJ41G and the US Geological Survey’s Western Mountain Initiative. M. Dyurgerov and two anonymous reviewers contributed a number of thoughtful comments that significantly improved the manuscript.



