


Introduction
The paper describes detailed mapping of the ice surface and bedrock topography of western Vatnajökull and the whole ice cap, Hofsjökull in central Iceland (Fig.1). Both ice caps are situated within the active volcanic zone and cover unexplored landforms, significant geological structures, and volcanic features. Further, some of the largest rivers in Iceland originate at these ice caps.
The ice caps of Iceland and the location of the active volcanic zones.

The first maps that outline, with some accuracy, the extent of ice caps in Iceland were surveyed by the Danish Geodetic Institute, in the period 1904 to 1938, and published on a scale of 1:100 000 (Reference NørlundNørlund 1944). On these maps, however, the indicated ice-surface elevation was not based on surveying, except along the edge of the glaciers. The contour lines were drawn with the help of oblique aerial photographs and show, according to Reference NørlundNørlund (1944), the form of the ice surface, rather than its elevation. The maps of western Vatnajökull, as welt as Hofsjökull, were surveyed in 1937–1938 and the oblique aerial photographs date from 1938. The position of the glacier edge was later revised by air photographs from 1961 (see Fig.5).
Radio echo-sounding lines on western Vatnajökull, plotted on the map surveyed by the Danish Geodetic Institute in 1937–38.

The next maps of the glaciers were compiled by the U.S. Army Map Service, on a scale of 1:50 000, on the basis of air photographs from 1945–46 and the triangulation system previously surveyed by the Danish Geodetic Institute. The ice-surface contours, in the marginal areas of the ice caps (some few km up from the edge), were compiled from the air photographs, but, higher up, the contours are identical with those of the Danish Geodetic Survey maps. A recent test of the reliability of the elevation contours on these maps (outside the ice caps, of course) indicates that they are generally accurate to ± 10 m, but, in some places, they prove to be wrong by up to 100 m (Sigmundur Freysteinsson and Örn Arnar Ingólfsson, personal communication 1985). In addition to these two sets of maps, ice elevation has repeatedly been geodetically levelled on two profiles on western Vatnajökull (TungnaarjOkull) (see Reference FreysteinssonFreysteinsson 1984) and from Grimsvötn north-east, towards Kverkfjöll. Further, Landsat images of Vatnajökull (see Fig.3) show the extent of the ice cap and surface forms which reflect sub-ice features (porarinsson et al. 1973). The same applies to Hofsjökull (Fig.4), which covers prominent, buried, volcanic structures (see e.g. Reference SæmundssonSæmundsson 1979).
A Landsat image of Vatnajökull (31 January 1973). (Copies from a map, published by the U.S. Geological Survey, in cooperation with the Iceland Geodetic Institute and the Icelandic National Research Council).

A Landsat image of Hofsjökull (S 237 014 C7, 20th October 1980, obtained from the Iceland Geodetic Survey).

Exploration of the ice thickness of Vatnajökull and the sub-ice topography started in 1951, when a French-Icelandic expedition carried out seismic soundings at 33 points, spread over the ice cap (Reference HoltzschererHoltzscherer 1954). On the basis of these soundings, Eythórsson (Reference Eythórsson1951, Reference Eythórsson1952) presented a preliminary map of the bedrock beneath Vatnajökull. This map shows the central ice masses resting on a highland plateau, at 700—800 m altitude, and only a few peaks rising above the 1000 m elevation, which marks the present level of the firn line in the southern part of Vatnajökull. In 1955, a second French-Icelandic expedition continued the seismic work on Vatnajökull (Reference SigurdssonSigurdsson 1970) and on Myrdalsjökull (Rist 1976).
The next step in the exploration of the ice depths was taken on Vatnajökull by gravity surveying. In 1960 and 1961, the average ice thickness was estimated in the Grímsvötn area and along a profile from Grímsvötn to Kverkfjöll (Reference PálmasonPálmason 1964). Two profiles were later surveyed at Tungaárjökull (Reference SigurdssonSigurdsson 1970) and Thorbergsson (unpublished data) made gravity measurements on several points on Vatnajökull, in 1971. Reference BjörnssonBjörnsson (1974) summarized all the available data. No observations were available on the bedrock topography of glaciers other than Vatnajökull and Mýrdalsjökull.
Since 1977, the Science Institute of the University of Iceland has made radio echo-soundings of ice depths. Continuous ice thickness profiling has been carried out by a series of oversnow traverses on large areas of the ice caps Vatnajökull, HofsjökuIl, and Myrdalsjökull, as well as on some valley glaciers (Reference BjörnssonBjörnsson 1977, Reference Björnsson1981, Reference BjörnssonBjörnsson et. al. 1977, Reference Sverrisson, Jóhannesson and BjörnssonSverrisson et. al. 1980, and Björnsson (various internal reports)). The total length of the sounding lines is about 4000 km so far. Maps of the glacier surface and the sub-ice bedrock have been compiled. Since 1980, the main work has been funded by the Iceland Power Company.
Radio Echo-Sounding Surveying
Instrumentation for the radio echo-sounding survey includes an echo-sounder, a satellite geoceiver and Loran-C equipment for navigation, and a precision, pressure altimeter.
The echo-sounder
The radio echo-sounder is a mono-pulse system, designed by the Science Institute (Reference Sverrisson, Jóhannesson and BjörnssonSverrisson and others 1980). Pulses of 0.2 μs duration are transmitted into a 30 m-long, resistively-loaded, dipole antenna, at the repetition rate of I kHz. The reflected signal is picked up by an identical antenna and fed into a receiver, which has a 2–5 MHz band-pass filter. The transmitter and the receiver are placed on sledges at the centre of the antennae and towed on a line along the glacier surface. The intensity modulation (Z-scope display) of the received signal is recorded photographically on a 35 mm camera, which is held open while the base of the oscilloscope is scanning the screen. The speed of the scanning beam is proportional to the angular velocity of a bicycle wheel, which is mounted on the receiver sledge. Fig.2 shows a typical profile from the echo-sounder, with the two-way, travel time of the electromagnetic wave on the Y-direction and the traversed, oversnow distance on the X-axis. For ice thickness of more than 700 m, 60 m-long antennae may have to be used to get a good bedrock return.
A typical radio echo-sounding profile from Vatnajökull.

Navigation
During the first two years of radio echo-sounding, navigation on traverses across the ice was only done by means of compass bearing and the distance derived from the bicycle wheel of the echo-sounder. Markers for position were put on the film record of the sounder. The accuracy in position of these sounding lines is assumed to have been ± 200 m. Since 1982, however, Loran-C has been used for navigation on all traverses on the ice caps and, from 1983, the latitude and longitude obtained from Loran-C (in WGS 66 coordinates) has been recorded on a magnetic tape at 100 m intervals, along all sounding lines. The corrections due to using the Loran on the ground have proved to be systematic within the surveying area and of the order of some hundred metres. The correction has been determined by satellite navigation in a few points in the area. The final position of the sounding lines is expected to be accurate to better than ± 50 m.
For detailed mapping, an orthogonal grid of sounding lines has been placed on the glaciers, usually with a separation of 500 m to 1000 m between the lines (see Fig.5). Up to the year 1982, the grid was set out by geodetic surveying and all data for position, ice thickness, and ice elevation referred to the coordinate system of this grid. The geographical position of the grid was later fixed by satellite navigation. The position of the sounding line is considered to be accurate to ± 30 m. Since 1983, grids have not been geodetically surveyed, but the position of the sounding lines has been logged by Loran-C (to 50 m), (Fig.8). This has speeded up the sounding work.
Radio echo-sounding lines on Hofsjökull.

Determination of ice-surface elevation
The ice-surface elevation was derived by precision, barometric altimetry. Up to the year 1981, the barometer was read manually at 100–300 m intervals along the sounding lines and the position marked on the film record of the echo-sounder. Since 1982, a barometric altimeter has recorded on magnetic tape every 50 m along the sounding lines. Corrections are made for temperature effects and a barometer records variations in pressure with time at the base camp. All elevations are related to the altitude of the neighbouring mountain peaks. The absolute accuracy is considered to be ± 15 m on the sounding lines and the relative elevations are estimated at ± 10 m. The difference in surface elevations at crossing points was less than 5 m in all points at Hofsjökull, but about 10 - 15 m on western Vatnajökull. This is caused by calibration errors of the altimeter, as well as uncertainty in the location of the crossing points. Occasionally, the altitude on the sounding lines has been geodetically levelled.
Data Reduction
The photographic records of the return echo have been digitized, with an interval of about 30 m in oversnow distance between points. The geographical position of these echo points is obtained by interpolation between the points where position was recorded on the sounding line. The vertical depth of ice was obtained from the digitized, photographic records by general, one-dimerssion, inversion techniques, as described by Reference HarrisonHarrison (1970). The result is a final, geographical position of the points of reduced ice thickness on the sounding line, A constant velocity of electromagnetic waves in ice of 169 m/μs was used. A correction, due to higher velocity in the surface firn layer, was neglected, as its maximum thickness is about 20–30 m. About 80% of all crossing points show a difference in ice thickness of less than 20 m. In a complex topography, sounding lines perpendicular to the bedrock slopes were given the highest priority and the deepest reflection selected, after a manual inversion. The accuracy for the ice thickness is considered to be ± 15 m, or 2%, whichever is greater.
The bedrock elevation was obtained as the difference between the ice-surface altitude and the ice thickness. The absolute bedrock elevation is estimated to ± 30 m.
Map Compilation
The maps of the bedrock and surface topography were compiled, using data from the sounding lines and elevations from maps outside the glacier, as well as data from recent surveying by the National Energy Authority (Gunnar Thorbergsson, personal communication). The outline of the edge of the glaciers was digitized from Landsat images and recent glacier variations were included. The reduced data of ice-surface and bedrock elevations were put into a grid of conformal, conical, Lambert coordinates. The maps were drawn on the basis of the reduced data and values obtained by interpolation through them. The first interpolation routine assigned values for each 100 m distance along the sounding lines, placed a spline-curve across these points and derived values for each grid, of 100 x 100 m square, of the surveying area. Further, surface-trend analysis of the computer program. Surface II (Reference SimpsonSimpson 1978), has been used for gridding and producing contour maps, which are considered fairly reliable for our set of data. The final maps, however, have been drawn by hand, after checking the interpolation. The reduced data and the data obtained by interpolation are stored in a data-base for use as a digital map.
Maps of Western Vatnajökull
In 1980, the ice-surface elevation and bedrock were mapped in detail on the outlets, Tungnarjökull and Sylgjujökull and, in 1982, on Köldukvislaárjöflkull (the outlets are named after the rivers). Outside these outlets, the map is drawn from data obtained in various traverses since 1977. Fig.5 shows the grid of all the sounding lines placed on the Danish Geodetic Survey map of western Vatnajökull. Points located with satellite navigation are marked as dots on the map.
The maps of Tungnaárjökull and Sylgjujökull cover an area of 350 km2. The total length of the sounding lines was about 600 km. The main 25 lines were placed parallel, 1 km apart, perpendicular to the ridges reflected north-east to south-west on the Landsat image (Fig.3), thus simplifying and the number of data points for ice thickness about 17 000 and 10 000 for the ice-surface elevation. Bedrock return was obtained over the whole area, but was rather faint in some places with ice thickness of 800–900 m (between Bárdarbunga and Grímsvötn). This may partly be caused by internal ash layers.
Glacier Surface Maps
Fig.6 shows a map, with 50 m contour intervals, of western Vatnajökull, This is the first map of the glacier with known accuracy and shows surface forms created by the flow of ice, thus reflecting the bedrock structures. Further, the map shows, in detail, ice cauldrons, north-west of Grimsvotn that are created by subglacial, geothermal activity and drain water, in joku!hlaups, to the river Skaftá (see e.g. Reference BjörnssonBjörnsson 1977). Comparison with the 1938 map of the Danish Geodetic Institute (Fig.5) shows the most striking difference in the northern part above 1500 m elevation. In the area between and Bárdarbunga the old maps have underestimated elevations by 50–100 m.
A map of ice-surface contours of western Vatnajökull. The easternmost part of the map shows the contours from the map of the Danish Geodetic Institute, see Fig.5.

Bedrock Terrain: Geological Structures
Fig.7 shows a map, with 50 m contours, of the bedrock of western Vatnajökull. The bedrock elevation is, on the whole, lower in the southern than in the northern part of western Vatnajökull. On Sidujökull, Skaftárjökull and Tungaárjökull (see Fig.6 for place names) the bed is lower than 850 m, but is above that height everywhere in the northern area. In the south, the topography is dominated by long linear ridges, north-east to south-west, which are, presumably, volcanic fissures, hyaloclastic ridges, and crater rows. In the north-eastern area, the landscape is dominated by the central volcano complexes, Hamarinn, Bárdarbunga, and Grimsvötn and mountain ridges running out from them. In their analysis of the Landsat image of Vatnajökull of 31 January 1973, Thorarinsson and others (1973) pointed out that a feature, aligned north-west to south-east (N.35°W) from Thordarhyrna towards Hamarinn, separates these two, markedly-different, tectonic regimes.
A map of sub-ice contours of western Vatnajökull. A three-dimensional, perspective plot of Tungnaarjökull is added.

The main mountain ridge in the southern area runs north-east from Langisjór and Fogrufjöted mountains, 850–1000 m high, are seen on both sides of the ridge, east of Kerlingar. This ridge is clearly reflected on the glacier surface and separates the outlets Tungnaárjökull and Skaftárjökull. East of it, the bed declines toward the main part of the ice cap, where erosion has taken place for thousands of years and tectonic lineaments may have become obscured. There, a 30 km-long valley, bounded by the ridge, reaches all the way up to the south-eastern slopes of Hamarinn. Another branch of this valley seems to stretch north of the nunatak, Palsfjall, and eastward to the slopes of Háabunga. The bottom of the subglacial valley is, in places, below 600 m and locally down to 550 m. Thus, in large areas, the bedrock is lower than in front of the glacier outlets. On Tungnaárjökull, to the west of the main ridge, the bed is about 100 m higher than east of it. TungnaárjökulI has eroded its bed for a shorter time than has the older, main ice cap.
Three central volcanos have built up mountains by volcanic eruptions in the northern area. Those are Hamarinn and Bárdarbunga, at the glacier edge, and Grímsvötn, in the interior of the ice cap. Mountain ridges radiate from the volcanoes and, presumably, they show the strike of the related, volcanic, fissure swarms, as mountains tend to build up above the subglacial craters, Hamarinn is a steeply sloped volcano, about 60 km2 in area inside its nearly circular rims, that slope from 1570 m down to about 1200 m. A slight depression is found inside the rim, suggesting a caldera formation. The main ridge separating Tungnaárjökull and Skaftárjökull, strikes south-east from the southern slopes of Hamarinn. At the glacier edge, this fissure swarm continues south-west, south of Langisjor. Another ridge strikes east from the north-eastern corner of Hamarinn, 1100–1200 m high, but terminates after about 10 km. About 2—3 km further south and 5 km east of Hamarinn, another, separate, ridge starts and continues eastward all the way to the northern slopes of Grímsvötn. These ridges have shown much geothermal and volcanic activity in recent years, as well as being one of the most active seismic areas in Iceland, In 1938, a large area north of Grimsvötn subsided, presumably due to volcanic activity that did not reach through the ice. About 3 km3 of melt water drained down into Grímsvtön and causeed a large jökulhlaup (Reference ThorarinssonThorarinsson 1974, Reference BjörnssonBjörnsson 1974, Reference Björnsson1983, Reference Björnsson and KristmannsdóttirBjörnsson and Kristmannsdottir 1984). In 1955, the easternmost ice cauldron was formed, the central one around 1970, and, in 1980, the westernmost cauldron could be observed (Reference BjörnssonBjörnsson 1977, Reference Björnsson1983). The two eastern cauldrons drain water down the valley east of the ridge, which separates the outlets Tungnaárjökull and SkáftarjOkull. We note that these cauldrons seem to have no connection, through fissure swarms, with volcanic activity, south-west of Vatnajökull. They are located on a ridge, connecting the central volcanos, Hamarinn and Grimsvötn. The third central volcano, Bardarbunga, was mapped in detail in 1985. The survey revealed a 700 m deep caldera, surrounded by mountains that reach 1800 m and rise from 1000 m elevation on the southern, as well as the northern slope. South of the volcano, more than 900 m-thick ice flows towards Grímsvötn. A ridge strikes south-west across KöldukvislarjökuII, from the south-western slopes of Bardarbunga, but is separated from Hamarinn by a crater-like depression. The volcano, Bardarbunga, appears to be the centre of an active volcanic system, with a fissure swarm running 150 km to the south-west (Reference SæmundssonSæmundsson, 1979 and Reference LarsenLarsen 1984).
Maps of Hofsjökull
In 1983, the ice-surface elevation and the bedrock were mapped in detail on the whole of the ice cap of Hofsjökull. Fig.8 shows the position of all the sounding lines, as recorded on a magnetic tape from Loran-C. Most of them run along the longitudinals, but, when necessary, they were placed perpendicular to the slopes of the buried, subglacial structures reflected on the Landsat image (Fig.4), Points fixed by satellite navigation are marked on the map. The ice cap covers an area of 923 km2. Altogether, data from 1350 km of sounding lines were used in the compilation of the maps. The ice thickness was calculated at about 42 000 echo-sounding points. The ice-surface elevation was calculated at about 30 000 points.
Glacier Surface Maps
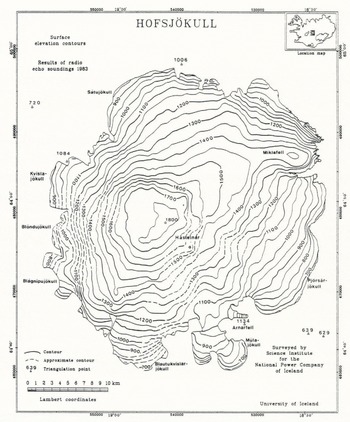
Fig.9 shows a map, with 50 m contour intervals, of Hofsjökull. The highest parts of the ice cap form a circular plateau, at about 1800 m elevation. On earlier maps, the maximum elevation was 1765 m and all the plateau above 1700 m has obviously never been correctly mapped. The surface elevations on Thjórsarjökull look fairly similar on both maps, but other areas are lower now than shown on the other maps, as is to be expected. An ice ridge strikes north-east towards Miklafell and ice flows south-east to Thjórsarjökull and Múlajökull, but north-west to Satujökull. The outlets, Blöndujökull and Blöndujökull flow westwards and Blautukvislarjökull south wards from the plateau.
A map of ice-surface contours of Hofsjökull.
Bedrock Terrain at Hofsjökull
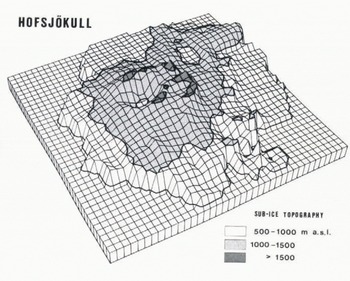
Fig. 10 shows a map, with 50 m contours, of the bedrock of Hofsjökull. The most prominent landform beneath Hofsjökult is a large, circular volcano, with a 250 km2 base, at 1000 m elevation. The mountain rises up to rims at 1500–1600 m, surrounding a 600 m deep caldera. The bottom of the caldera is at about 980 m, which is the same as along most of the edge of the ice cap. To the east, the rims are crowned by the Hásteinar nunataks, made of rhyolite, which indicates that they were formed when the mountain was not covered by ice (see Fig.9 for place names). A breach in the caldera rim, at 1250 m, is facing west. The maximum ice thickness on Hofsjökull is found in the caldera, about 750 m. Fig.11 shows the main features of the bedrock beneath Hofsjökull. Fig.12 shows the distribution of area and ice volume with elevation. About 2/3 of the bedrock of Hofsjökull is above 1000 m and 1/9 higher than 1300 m. The total volume of ice on Hofsjökull is 200 km3 and the average thickness is 215 m.
A map of sub-ice contours of Hofsjökull.

A three-dimensional, perspective plot of the bedrock beneath Hofsjökull the bedrock beneath Hofskjökull.
Area and volume distribution with elevation, for Hofsjökull.

The bedrock map reveals a north to south alignment in the landscape in southern Hofsjökull. A ridge strikes southwards from the south-western corner of the central volcano and separates Blautukvislarjökull and Bláagnipujökull (see Fig.9 for place names). Further east, on Thjórsarjökull, the north-south strike is seen, north of Arnarfell (see Fig.9). The peculiar, narrow north-south valley on Blautukvislarjökull may be eroded by catastrophic jökulhlaups from the central volcano. The deep north-south valley, north of Mlajökull, may be tectonically induced, as well as caused by ice and water erosion.
Beneath the deeply-eroding outlet, Múlajökull, the bottom is locally down to 500 m elevation, the lowest on Hofsjökull, which is 100 m lower than in front of the glacier outlets.
In northern Hofsjökull a north by 25° east alignment dominates the landscape. A mountain ridge runs north-north-east from the central volcano and another parallel ridge strikes south-south-west from Miklafell. Between those ridges is a trough-formed valley, where the elevation is locally at 950 m. The ice cap, Hofsjökull, is supported by the main, central volcano and Miklafell and the two ridges that strike out from them, Outside the caldera, the ice is thickest on the ice ridge above the valley, between the two mountain ridges (580 m).
Conclusion
The maps compiled from the precision, pressure altimetry are the first, accurate maps available of the surface elevation of the large ice caps in Iceland. They form the basis for delineation of ice-drainage basins and theoretical studies of glacier flow. The maps of the bedrock topography reveal previously unexplored landforms and geological structures within the active volcanic zone in Iceland. Together, the ice surface and the sub-ice maps are used to estimate the volume of the ice caps and its distribution as well as to define drainage basins for the rivers that run from the ice caps (Björnsson, in press).
The fieldwork on western Vatnajökull and Hofsjökull, as well as the processing of the data, was financed by the National Power Comapny of Iceland. Jón Sveinsson and Marteinn Sverrisson operated the echo-sounder and the geoceiver, in the field. Finnur Pálsson operated computers during the data processing. Tómas Jóhannesson and Magnus T. Gudmandsson worked on the data processing of Hofsjökull.



