Implications
NIRS is an alternative technology used widely to assess feedstuff chemical composition, but most feed evaluation systems also need values to model kinetics of nutrient degradation. For the current study, a large set of samples of feedstuffs commonly used in ruminant nutrition was used and it became possible to predict degradability parameters of dry matter and CP. However, for some degradability parameters of NDF our data set was not sufficiently large to obtain robust predictions.
Introduction
Kinetics of nutrient degradation in the reticulo-rumen is one major determinant of feedstuffs evaluation for ruminants. Most current feed evaluation systems are based on the kinetics of nutrient degradation (e.g. Cornell Net Carbohydrate and Protein System (Sniffen et al., Reference Sniffen, O’Connor, Van Soest, Fox and Russell1992); Molly (Baldwin, Reference Baldwin1995); Dairy NRC (National Research Council, 2001); NorFor (Volden, Reference Volden2011)), which usually are obtained with the in situ method. The in situ is a well-established technique for the determination of the degradation kinetic parameters and the effective degradation (ED) of nutrients (Huhtanen et al., Reference Huhtanen, Ahvenjärvi, Weisbjerg and Norgaard2006). However, it is an expensive and tedious method because it requires rumen-cannulated animals and rumen incubations may last several days. These factors limit its use for routine evaluation of feeds by the feed industry and in practice tabulated values are used to estimate ruminal degradability of nutrients and to formulate diets for ruminants. A considerable variability has been documented around these tabulated values (von Keyserlingk et al., Reference von Keyserlingk, Swift, Puchala and Shelford1996; Hvelplund and Weisbjerg, Reference Hvelplund and Weisbjerg2000) that may lead to imbalances in diet formulation at farm level.
Several biological and chemical methods have been tested as alternatives. López et al. (Reference López, Carro, González and Ovejero1998) compared the in situ method with the gas production technique and enzymatic assays using hay samples and reported considerable differences depending on the botanical composition of hay. Moreover, Huhtanen et al. (Reference Huhtanen, Seppälä, Ots, Ahvenjärvi and Rinne2008) utilized the in vitro gas production technique to estimate degradability parameters of NDF in forages and reported accurate estimation of the intrinsic degradation rate, although incubations with rumen fluid for up to 60 h are still needed. On the other hand, feed industry relies strongly on IR reflectance spectroscopy as an alternative to wet chemistry (Roberts et al., Reference Roberts, Stuth and Flinn2004; Workman and Shenk, Reference Workman and Shenk2004). IR reflectance spectroscopy is a fast, reliable and cost-effective way to predict feedstuffs’ chemical composition (Andrés et al., Reference Andrés, Murray, Calleja and Giráldez2005a) and it is used in combination with mathematical models to formulate diets for cattle (Roberts et al., Reference Roberts, Stuth and Flinn2004). Recently, Belanche et al. (Reference Belanche, Weisbjerg, Allison, Newbold and Moorby2013 and Reference Belanche, Weisbjerg, Allison, Newbold and Moorby2014) used Fourier transformation mid-IR spectroscopy (FTIR) to estimate degradability parameters of CP, dry matter (DM) and NDF, and results suggested that mid-IR can be used for screening purposes but not for estimating dynamic parameters of degradability. Similarly, several efforts using NIRS to predict rumen degradation parameters have been reported (Todorov et al., Reference Todorov, Atanassova, Pavlov and Grigorova1994; De Boever et al., Reference De Boever, Vanacker and De Brabander2003; Andrés et al., Reference Andrés, Giráldez, González, Peláez, Prieto and Calleja2005b; Ohlsson et al., Reference Ohlsson, Houmøller, Weisbjerg, Lund and Hvelplund2007). However, most of these studies are feedstuff specific, predicting degradation parameters of a particular feedstuff or a specific category of feedstuffs, mainly forages or compound feeds and not byproducts or grains.
Our objective was to evaluate the potential of the NIRS technique to predict degradability parameters and ED of feed samples utilizing a wide range of feedstuffs commonly used in ruminant nutrition.
Material and methods
Database
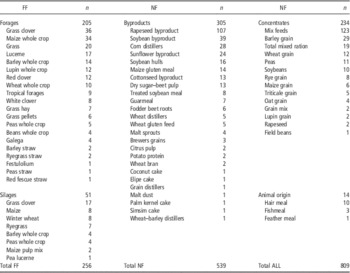
A database of 809 feedstuffs frequently used in ruminant nutrition were collected over the course of a 10-year period at AU Foulum (Aarhus University, Denmark) and used in this study. All samples were freeze-dried, ground to pass through a 1.5-mm diameter sieve and stored in airtight containers at −20°C until further analysis. Feedstuffs were classified, according to their use in ruminant nutrition, as forages (FF; n=256), non-forages (NF; n=539) and of animal origin (n=14). Table 1 shows the wide variety of feedstuffs. The FF group included hays, straws, whole crops, grass pellets and silages. The NF group included concentrates (n=234) and byproducts (n=305). Concentrates included different mixed feeds, seeds and grains. Byproducts included those of distillery and oil production. Moreover, samples of animal origin (n=14) were included for calibrations with all feedstuff (ALL).
Feedstuffs (ALL) classified in the database as forages (FF) and non-forages (NF) for the prediction of ruminal degradability parameters

Not all feeds in the database were analyzed for each nutrient component. In total, 665 feedstuffs were analyzed for DM degradability parameters and 682 for CP degradability parameters. The reported DM and CP values do not necessarily relate to the same feedstuff. For NDF, a total of 100 samples were available and the majority of feedstuffs were grouped as FF. Thus, for NDF predictions separation in groups included only FF. The exact number of feedstuffs per group and nutrient is presented in Tables 2 and 3.
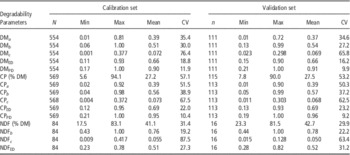
Population statistics of calibration and validation data set of all feedstuffs (ALL)

N=number of samples for calibration; n=number of samples for validation; min=minimum value of the data set; max=maximum value of the data set; mean=the mean of the data set; CV (%)=coefficient of variation (s.d./mean×100); DM a and CP a =washable fraction of dry matter (DM) and CP; DM b , CP b and NDF b =slowly degradable fraction of DM, CP and NDF; DM c , CP c and NDF c =degradation rate of DM b , CP b and NDF b ; DMED, CPED and NDFED=effective degradation of DM, CP and NDF; DMPD, CPPD and NDFPD=potentially degradable DM, CP and NDF (a+b).
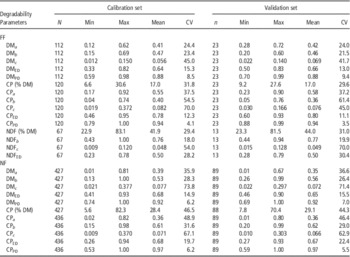
Population statistics of calibration and validation data set of feedstuffs classified as forages (FF) and non-forages (NF)

N=number of samples for calibration; n=number of samples for validation; min=minimum value of the data set; max=maximum value of the data set; mean=the mean of the data set; CV (%)=coefficient of variation (s.d./mean×100); DM a and CP a =washable fraction of dry matter (DM) and CP; DM b , CP b and NDF b =slowly degradable fraction of DM, CP and NDF; DM c , CP c and NDF c =degradation rate of DM b , CP b and NDF b ; DMED, CPED and NDFED=effective degradation of DM, CP and NDF; DMPD, CPPD and NDFPD=potentially degradable DM, CP and NDF (a+b).
In situ analyses
In situ analyses were performed according to the NorFor procedure (Madsen et al., Reference Madsen, Hvelplund, Weisbjerg, Bertilsson, Olsson, Spörndly, Harstad, Volden, Tuori, Varvikko, Huhtanen and Olafsson1995; Åkerlind et al., Reference Åkerlind, Weisbjerg, Eriksson, Thøgersen, Uden, Olafsson, Harstad and Volden2011). Feed samples were incubated in the rumen of three dry Holstein–Friesian cows in 11×8.5 cm (10×7.5 effective size) Dacron bags with 38 μm pore size (PES material 38/31 with 31% open bag area, Saatifil PES 38/31; Saatitech S.p.A., Veniano, Como, Italy). Cows used for incubations were fed at maintenance level a ration containing (kg/day) 2.0 spring barley straw, 4.0 artificially dried grass hay, 0.15 vitamin-mix and 2.8 concentrate (concentrate composition (g/kg): 400 barley, 400 oats, 100 soybean meal, 30 rapeseed meal, 30 beet molasses and 40 mineral mixture). Chemical composition of ration was (g/kg DM) 139 CP, 465 NDF and 137 starch. Feed samples were ground to pass a 1.5-mm screen and 1 g was weighed into each bag. Bags were mounted with plastic strips on rubber stoppers. The rubber stoppers (with hooks) were mounted on a plastic tube fitted with rings. The plastic tube had a sink (weight 200 g) in one end and strings with a length of 40 cm at both ends to ensure its mobility in relation to the rumen cannula. Bags were incubated in the rumen for 0, 2, 4, 8, 16, 24, 48, 96, 126 and 168 h. Maximum incubation time for protein degradation was 48 h for concentrates and 96 h for forages; and for NDF degradation was 126 h for concentrates and 168 h for forages. After rumen incubation, bags on the rubber stopper were rinsed with cold tap water and machine-washed (AEG, Fredericia, Denmark) twice for 5 min with 22 l of water at 25°C. Subsequently, bags were frozen at −20°C until analysis. To remove adhering microbes, forage residues were transferred to a plastic bag with 60 ml demineralized water, and treated for 5 min in the stomacher before returned to the Dacron bag and washed thoroughly with demineralized water. Residues in bags for DM and CP were transferred to tarred nitrogen-free filter paper, dried at 103°C to determine the DM residue, then analyzed for nitrogen content using an automated Foss-Kjeldahl apparatus (Fisher Scientific, Pittsburgh, PA, USA) and CP concentration was calculated as N×6.25 (Association of Official Analytical Chemists, 1990). Residues in bags for NDF were transferred directly to porosity 2 filter crucibles and ash-free NDF residue was determined in a Fibertec system (FOSS, Hillerød, Denmark) using a heat stable amylase and sodium sulfite according to the study by Mertens (Reference Mertens2002).
Degradability parameters were fitted using PROC NLIN in SAS (version 9.2; SAS Institute Inc., Cary, NC, USA) according to the model of Ørskov and McDonald (Reference Ørskov and McDonald1979). ED of DM, CP and NDF (DMED, CPED and NDFED, respectively) was calculated according to the following equation:
 $${\rm ED=}a{\rm {\plus}}b\,\left( {c/\left( {c{\rm {\plus}}k} \right)} \right)$$
where a is the washable fraction (DM a and CP a for DM and CP, respectively; not included for NDF), b the slowly degradable fraction (DM b , CP b and NDF b for DM, CP and NDF, respectively), c the rate of degradation (DM c , CP c and NDF c for DM, CP and NDF, respectively) and k the fractional outflow rate from the rumen (5%/h for CP and DM; 2%/h for NDF). Then, the potentially degradable (PD) DM and CP (DMPD and CPPD, respectively) was calculated as the sum of fractions a and b. Degradation parameters of NDF did not include fraction a because NDF degradation at 0 h was considered to be zero.
NIRS analyses
All samples were scanned in the same month from 1100 to 2500 nm using an NIRSystems 5000 scanning monochromator (FOSS). Reflectance was recorded in 2 nm steps, which gave 692 data points for each sample, as log (1/R), where R represents reflected energy. Samples, ground at 1.5-mm screen, were scanned twice in duplicate (four scans per sample) using closed ring cup cells and the mean spectrum was calculated for each sample.
NIRS calibrations for CP, NDF and degradability parameters of DM, CP and NDF were performed using the WinISI III (version 1.6) software. The modified partial least squares (MPLS) regression method was used for calibration development. Separate MPLS calibrations were performed for each parameter in the calibration set. Multiple scatter correction, standard normal variate (SNV), detrend (D), and SNV and D (SNV-D) algorithms were used to remove or reduce the effects of scatter. In addition, six derivative mathematical treatments were tested in the development of NIRS calibrations: 1, 4, 4, 1; 1, 10, 10, 1; 2, 4, 4, 1; 2, 10, 10, 1; 3, 4, 4, 1 and 3, 10, 10, 1, where the first digit is the number of the derivative, the second is the gap over which the derivative is calculated, the third is the number of data points in a running average or smoothing and the fourth is the second smoothing. Hence, in all cases, 24 regression equations per parameter were developed by combining six spectral derivative math treatments and four scatter correction methods.
Cross-validation was applied to optimize calibration models, determine the optimal number of terms for the calibration equation and to identify chemical and spectral outliers. In addition to cross-validation, an external validation was performed using a set of 20% of total samples (Tables 2 and 3). Samples in the validation set were selected randomly from the total matrix and were balanced according to the previously mentioned grouping of feedstuffs and year of selection to represent a wide range of composition. Samples in the validation set were not used in the calibration set or vice versa. The optimum calibration model was selected on the basis of minimum standard error of calibration and standard error of prediction (SEP), and of greatest coefficient of determination of calibration (R 2), cross-validation (r cv 2) and validation (r 2). These coefficients were used as indicators of precision. Further, performance of calibrations was evaluated using the ratio of performance to deviation (RPD) described as the ratio of standard deviation for the validation samples to the SEP, and the range error ratio (RER) described as the ratio of the range in the reference data (validation set) to the SEP. With an RPD⩽1.9 calibration is considered to be not suitable; values between 2.0 and 2.4 are considered poor and only adequate for rough screening purposes, values between 2.5 and 2.9 are providing a fair prediction that can be used for screening and values ⩾3.0 (or RER>10) indicate good prediction and can be used for quantitative analysis (Williams, Reference Williams2014). Equations were obtained using all available feedstuffs (ALL) and the two groups (FF and NF).
Results
Calibration and validation matrices
Table 2 presents the descriptive statistics of the calibration and validation data set for ALL, including the mean, minimum and maximum values of each parameter, the standard deviation, the CV and the total number of samples used. All parameters were well represented in both calibration and validation matrices covering similar ranges. The degradability parameters database included samples where the degradation at time 0 was 80.2% of total DM content and others where the degradation after 48 h was only 16.5%, representing the existing variability in samples. The CP concentration of feedstuffs included in the calibration matrix ranged from 5.6% to 94.1% on DM basis with a CPED ranging from 12% to 95%. The NDF content ranged from 17.5% to 83.1% on DM basis in the calibration matrix. The in situ parameter with the greater CV was the degradation rate, ranging from 67.5% for CP c to as high as 87.5% for NDF c of ALL in the calibration data set (Table 2). Compared with ALL, grouping samples in two major groups (FF and NF) reduced variation mainly for FF; however, a wide variation within parameters was still present (Table 3). Similar to ALL, fraction c was the parameter with the greatest CV, and was lower for both the calibration and validation set of DM c for FF compared with NF and ALL.
Degradability parameters of DM
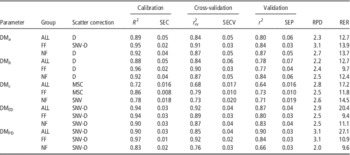
Table 4 presents calibration and validation statistics of the equations used to predict the degradability parameters of DM including ALL, FF and NF groups. The mathematical treatment that fitted best for most degradability parameters and groups of feedstuffs was the 2, 4, 4, 1, whereas the best scatter correction method differed among parameters and groups.
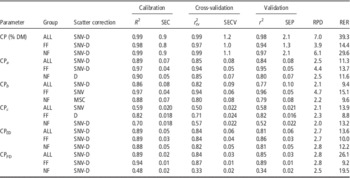
Calibration and validation statistics for estimation of dry matter (DM) degradability parameters by near-IR analysis on feedstuffs

R 2=coefficient of determination for calibration; SEC=standard error of calibration; r cv 2=coefficient of determination for cross-validation; SECV=standard error of cross-validation; r 2=coefficient of determination for external validation; SEP=standard error of prediction; RPD=ratio of performance to deviation (s.d./SEP); RER=range error ratio (range/SEP); DM a =washable fraction of DM; DM b =slowly degradable fraction of DM; DM c =rate of DM b degradation; DMED=effective degradation of DM; DMPD=potentially degradable DM (a+b); ALL=all samples; FF=group of forages; NF=group of non-forages; D=detrend; SNV=standard normal variate; MSC=multiple scatter correction.
For ALL, the calibrations for DM a (r 2=0.80; RPD=2.3) and DM b (r 2=0.78; RPD=2.2) were good for screening, whereas those for DMED (r 2=0.87; RPD=2.9) and DMPD (r 2=0.90; RPD=3.1) can be used for quantitative purposes. Predictions for DM a and DM b were improved by separating samples into groups, reducing the SEP (0.06 v. 0.03 and 0.05 for DM a and 0.07 v. 0.04 and 0.06 for DM b of ALL v. FF and NF, respectively). However, group separation did not improve predictions for DMED and DMPD, even though SEP was lower for FF. In addition, RPD of DMED decreased for both FF and NF, but it remained >2.5. The rate of degradation (DM c ) was predicted for quantitative purposes when all samples were included (r 2=0.64; RPD=2.81), whereas separating into groups reduced the SEP for FF (0.010 v. 0.016 for FF and ALL, respectively).
Degradability parameters of CP
Table 5 summarizes the statistics of calibration and validation of the equations used to predict the degradability parameters of CP. The concentration of CP was predicted with high accuracy by using SNV-D transformation and second derivative treatment of the spectra (r 2=0.98; RPD=7.0). Most of the degradability parameters were best predicted by 2, 4, 4, 1 and like in degradability parameters of DM, there was not a unique scatter correction that gave the best predictions of degradability parameters.
Calibration and validation statistics for estimation of CP degradability parameters by near-IR analysis on feedstuffs

R 2=coefficient of determination for calibration; SEC=standard error of calibration; r cv 2=coefficient of determination for cross-validation; SECV=standard error of cross-validation; r 2=coefficient of determination for external validation; SEP=standard error of prediction; RPD=ratio of performance to deviation (s.d./SEP); RER=range error ratio (range/SEP); CP (% DM)=CP concentration as % of dry matter (DM); CP a =washable fraction of CP; CP b =slowly degradable fraction of CP; CP c =rate of CP b degradation; CPED=effective degradation of CP; CPPD=potentially degradable CP (a+b); ALL=all samples; FF=group of forages; NF=group of non-forages; SNV=standard normal variate; D=detrend; MSC=multiple scatter correction.
Similar to degradability parameters of DM, NIRS predicted CP a and CP b for screening purposes and CPED for quantitative purposes. Separating in groups provided equations with lower SEP for both FF and NF. The coefficient of determination of validation of CP c was low when all samples were included (r 2=0.58), and prediction was improved for FF (r 2=0.82) but not for NF (r 2=0.52). Further, RPD was >2 in all cases (2.1, 2.3 and 2.0 for ALL, FF and NF, respectively) and group separation reduced SEP for FF (0.016) but not for NF (0.022) compared with ALL (0.021). Moreover, CPPD was precisely predicted when all samples were included (r 2=0.85; RPD=2.8), and predictions were improved for FF by group separation as indicated by the reduced SEP (0.01) and increased r 2 (0.89). However, prediction for NF group was below acceptable limits (r 2=0.34), even though RPD remained >2.5 and SEP was reduced (0.02 v. 0.03 for NF and ALL, respectively).
Degradability parameters of NDF
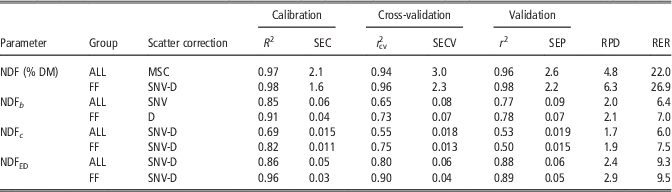
Table 6 summarizes calibration and validation statistics of the equations used to predict the degradability parameters of NDF. In this case, the number of feedstuffs was lower (100 in total; Table 2) and the need for an external validation matrix reduced it further (N calibration=84; n validation=16). Similar to degradability parameters of DM and CP, most of the parameters were best predicted using the second derivative pre-treatment.
Calibration and validation statistics for estimation of NDF degradability parameters by near-IR analysis on feedstuffs

R 2=coefficient of determination for calibration; SEC=standard error of calibration; r cv 2=coefficient of determination for cross-validation; SECV=standard error of cross-validation; r 2=coefficient of determination for external validation; SEP=standard error of prediction; RPD=ratio of performance to deviation (s.d./SEP); RER=range error ratio (range/SEP); NDF (% DM)=concentration of NDF as % of dry matter (DM); NDF b =degradable fraction of NDF; NDF c =rate of NDF degradation; NDFED=effective degradation of NDF; ALL=all samples; FF=group of forages; MSC=multiple scatter correction; SNV=standard normal variate; D=detrend.
The NDF content for ALL could be predicted with high precision (r 2=0.96; RPD=4.8; SEP=2.6), whereas the equation for NDFED was suitable for screening purposes (r 2=0.88; RPD=2.3; SEP=0.06). Group separation improved predictions increasing RPD and lowering SEP in both cases. For ALL, NDF b and NDF c were not precisely predicted providing RPD values <2, but performing analysis for FF increased RPD of NDF b . Owing to the low number of samples in the validation set, RPD was calculated for cross-validation as well and was as follows: 2.1 and 2.3 for NDF b of ALL and FF, respectively and 1.7 and 2.2 for NDF c of ALL and FF, respectively.
Discussion
The broad range of feeds represented in the database with different botanical origins, states of maturity, feed processing and preservation method resulted in a wide range of values for all parameters. As a consequence, minimum or maximum values reflected particular feedstuffs. For example, minimum value of CP a for ALL is equal to 2% (Table 2) because in the data set soypass samples (a commercially prepared rumen escape soybean product) were included (average CP a =6%, with minimum and maximum value of 2% and 8%, respectively; descriptive statistics per ingredient not shown). Similar values of CP a for soybean-treated products have been reported in the literature (Harstad and Prestløkken, Reference Harstad and Prestløkken2000; Sadeghi et al., Reference Sadeghi, Nikkhah, Shawrang and Shahrebabak2006). Similarly, minimum value of CP b for ALL is equal to 4% because winter wheat silages were included into the database (average CP b =6%, with minimum and maximum value of 4% and 7%, respectively; descriptive statistics per ingredient not shown).
The main strength of the current work is the number and diversity of available feed samples incorporated into the database and its analysis with 24 spectral models. Four scatter correction techniques and six mathematical treatments were tested to remove or reduce disturbing effects not related to the chemical absorption of light. Results suggested the use of a different spectral model for each parameter instead of the use of a unique model for all parameters. The second derivative treatment performed best for most parameters. The first and second derivatives are the most common forms in which spectra of agricultural products are displayed, third-order derivative are possible but are rarely used to interpret spectra (Shenk et al., Reference Shenk, Workman and Westerhaus1992).
Equations for ALL provided acceptable estimations either for screening or quantifying purposes of ED, PD and fractions a and b of DM and CP and NDFED, whereas predictions were improved in most cases by group separation, especially for FF group. A key component to explain this improvement is the variance of the data sets. We measured variance with the CV and in accordance with the literature (von Keyserlingk et al., Reference von Keyserlingk, Swift, Puchala and Shelford1996; Hvelplund and Weisbjerg, Reference Hvelplund and Weisbjerg2000; Hackmann et al., Reference Hackmann, Sampson and Spain2010), the variance of the current data set was high for all degradability parameters. However, group separation reduced the CV in most parameters in FF and some parameters in NF compared with ALL. This resulted in more homogeneous data, but still maintained a high range of values in each parameter tested. For FF, the inclusion of silages provided another factor. Silages provided more accurate predictions of DM and CP degradability parameters (de La Roza et al., Reference de La Roza, Martínez, Santos, González and Gómez1998) than other forage sources (Todorov et al., Reference Todorov, Atanassova, Pavlov and Grigorova1994; Mathison et al., Reference Mathison, Hsu, Soofi-Siawash, Recinos-Diaz, Okine, Helm and Juskiw1999). However, when silages were included to forage sources predictions were improved (Hsu et al., Reference Hsu, McNeil, Okine, Mathison and Soofi-Siawash1998). Silages have a different degradation pattern than other forages. Fraction CP a is higher in silages compared with other forages (75% v. 43% for silages v. other forages, respectively; data not shown), making CP b lower in silages than in forages (18% v. 51% for silages v. other forages, respectively; data not shown). Even though differences are not that strong for degradability parameters of DM, they still remained statistically significant. Thus, including silages in FF increased the range of values of degradability parameters improving overall prediction by NIRS.
Dyer (Reference Dyer2004) reviewed the utilization of NIRS for oilseeds and coarse grains and reported that several studies predicted contents of DM, CP, NDF or concentration of particular parameters, such as gossypol in cottonseed, fatty acids, or even total digestibility and energy estimation. Moreover, De Boever et al. (Reference De Boever, Vanacker and De Brabander2003) used NIRS to predict degradability parameters of compound feeds. However, to our knowledge, no studies examined the potential to predict degradability parameters of grains or byproducts. The current data set incorporated 539 byproducts and concentrates and results for NF group suggested NIRS can provide fair predictions of DM and CP degradability parameters (RPD>2.5 and 2.0 for degradability parameters of DM (Table 4) and CP (Table 5), respectively).
Several studies reported the inability of NIRS to predict the rate of degradation of nutrients (Andrés et al., Reference Andrés, Giráldez, González, Peláez, Prieto and Calleja2005b; Nordheim et al., Reference Nordheim, Volden, Fystro and Lunnan2007; Ohlsson et al., Reference Ohlsson, Houmøller, Weisbjerg, Lund and Hvelplund2007). Herrero et al. (Reference Herrero, Jessop, Fawcett, Murray and Dent1997) related this difficulty to the exponential nature of the models used in parameterization of the degradation rate. In the current study, DM c and CP c were predicted for screening purposes (RPD between 2.0 and 2.8; Tables 4 and 5), but prediction of NDF c was not reliable (RPD⩽1.9; Table 6). Moreover, RPD of DM c was higher than that of DM b , indicating that the mathematical issue was not the limiting factor. As a secondary procedure, NIRS is not independent of the disadvantages arising from the reference method used for calibration. As mentioned earlier, the variance of the current data set was high for all degradability parameters. In addition and similar to the literature (von Keyserlingk et al., Reference von Keyserlingk, Swift, Puchala and Shelford1996; Hvelplund and Weisbjerg, Reference Hvelplund and Weisbjerg2000), the rate of degradation had the greatest CV among degradability parameters. Moreover, for FF the CV of NDF c was greater than that of DM c and CP c (Table 3). Vanzant et al. (Reference Vanzant, Cochran and Titgemeyer1998) analyzed variance of the in situ and suggested that bags, animals and days contribute to it. Several standard procedures have been proposed to increase the precision of the in situ (Nocek, Reference Nocek1988; Vanzant et al., Reference Vanzant, Cochran and Titgemeyer1998). For the current study, all in situ were conducted under the procedure described in the study by Madsen et al. (Reference Madsen, Hvelplund, Weisbjerg, Bertilsson, Olsson, Spörndly, Harstad, Volden, Tuori, Varvikko, Huhtanen and Olafsson1995), which is the basis for the NorFor procedure (Åkerlind et al., Reference Åkerlind, Weisbjerg, Eriksson, Thøgersen, Uden, Olafsson, Harstad and Volden2011). Dry cows at maintenance level were used to minimize potential effects of intake level on in situ disappearance. However, incubation time for NDF was longer than that of DM or CP (maximum incubation time of 168 v. 96 h for NDF and CP of forages). This may explain why variance of NDF c was greater than that of DM c and CP c .
Additional variance was introduced by our approach of obtaining universal equations for each category (ALL, FF and NF) owing to the incorporation of within-feed variation. Murray and Cowe (Reference Murray and Cowe2004) discussed the effect of reference analysis on sample size and NIRS performance and suggested that a good calibration model can be obtained from relatively imprecise data if the data set is sufficiently large. In our data set, the number of available samples for degradability parameters of NDF was much lower compared with DM or CP (100 v. 665 or 682 for NDF and DM or CP, respectively). It is possible that a larger data set may improve NDF c prediction.
Interestingly, provided equations for most degradability parameters with NIRS resulted in higher r 2 and RPD compared with those reported with FTIR for CP (Belanche et al., Reference Belanche, Weisbjerg, Allison, Newbold and Moorby2013) and DM and NDF (Belanche et al., Reference Belanche, Weisbjerg, Allison, Newbold and Moorby2014) using a similar data set. The main difference between mid-IR (400 to 4000 cm−1 or 2500 to 25 000 m) and NIRS (4000 to 14 000 cm−1 or 750 to 2500 nm) ranges is that absorption in mid-IR corresponds to fundamental bands of molecular vibrations, whereas absorptions in NIR correspond to overtones and combinations of these fundamental bands (Williams and Norris, Reference Williams and Norris1987). Ferreira et al. (Reference Ferreira, Galão, Pallone and Poppi2014) determined quality parameters of soybean samples with both technologies (NIR and FTIR) and reported similar results for the two methods, even though the R 2 of NIRS was greater than FTIR.
Current results suggest that NIRS technology can be used to predict effective and potential degradabilities either utilizing universal equations or by separating feeds into groups. Moreover, using NIRS it is possible to predict DM c and CP c for screening purposes, but a larger data set is needed to provide equations for NDF c .
Acknowledgment
The current work was supported by the Commission of the European Communities (Rednex project FP7; grant agreement number: KBBE-211606).