Introduction
Our ability to detect edges in the visual world is enhanced through a process called lateral inhibition, mediated by horizontal cells (HCs), which exert both a negative (Baylor et al., Reference Baylor, Fuortes and O’Bryan1971) and a positive (Jackman et al., Reference Jackman, Babai, Chambers, Thoreson and Kramer2011) feedback onto cone photoreceptors. The underlying synaptic mechanisms are still not fully understood. Inconsistencies in the pharmacology and ions underlying the negative feedback current have challenged the initial hypothesis of a GABAergic transmission between HCs and cones (reviewed in Piccolino, Reference Piccolino1995; Thoreson & Mangel, Reference Thoreson and Mangel2012). A modulation of cone calcium channels (Verweij et al., Reference Verweij, Kamermans and Spekreijse1996, Reference Verweij, Hornstein and Schnapf2003), either by hemichannel-mediated ephaptic communication (Fahrenfort et al., Reference Fahrenfort, Steijaert, Sjoerdsma, Vickers, Ripps, van Asselt, Endeman, Klooster, Numan, ten Eikelder, von Gersdorff and Kamermans2009; Kamermans et al., Reference Kamermans, Fahrenfort, Schultz, Janssen-Bienhold, Sjoerdsma and Weiler2001; Kemmler et al., Reference Kemmler, Schultz, Dedek, Euler and Schubert2014; Klaassen et al., Reference Klaassen, Sun, Steijaert, Bolte, Fahrenfort, Sjoerdsma, Klooster, Claassen, Shields, Ten Eikelder, Janssen-Bienhold, Zoidl, McMahon and Kamermans2011; Pottek et al., Reference Pottek, Hoppenstedt, Janssen-Bienhold, Schultz, Perlman and Weiler2003) or through pH changes in the synaptic cleft (Davenport et al., Reference Davenport, Detwiler and Dacey2008; Hirasawa & Kaneko, Reference Hirasawa and Kaneko2003; Wang et al., Reference Wang, Holzhausen and Kramer2014), has arisen as the main mechanism for the negative feedback. Far from being mutually exclusive, both ephaptic and pH modulations are likely to shape cone calcium signals (Kemmler et al., Reference Kemmler, Schultz, Dedek, Euler and Schubert2014).
Many of the molecular and physiological underpinnings required for a GABAergic transmission from HCs to cones are, however, present in various species. On the presynaptic side, in lower vertebrates, GABA can be released in a Ca2+-independent manner via membrane transporters (Schwartz, Reference Schwartz1987). In the mammalian outer retina, the vesicular transporter VGAT/VIAAT was localized at the HC tips in mouse, guinea pig, human, and macaque retinas (Cueva et al., Reference Cueva, Haverkamp, Reimer, Edwards, Wässle and Brecha2002; Guo et al., Reference Guo, Hirano, Stella, Bitzer and Brecha2010; Haverkamp et al., Reference Haverkamp, Grünert and Wässle2000; Jellali et al., Reference Jellali, Stussi-Garaud, Gasnier, Rendon, Sahel, Dreyfus and Picaud2002); HCs were reported to express the synaptic proteins required for vesicular release in rabbits and guinea pigs (Hirano et al., Reference Hirano, Brandstätter and Brecha2005; Lee & Brecha, Reference Lee and Brecha2010). Though HCs were previously reported not to contain GABA in rodents (Agardh et al., Reference Agardh, Bruun, Ehinger and Storm-Mathisen1986; Fletcher & Kalloniatis, Reference Fletcher and Kalloniatis1997; Versaux-Botteri et al., Reference Versaux-Botteri, Pochet and Nguyen-Legros1989), we have demonstrated that this was due to the loss of GABA during tissue preparation, which could be compensated by supplementing the medium with a GABA precursor, such as glutamine or glutamate, and with pyridoxal phosphate, a cofactor of glutamate decarboxylase (Deniz et al., Reference Deniz, Wersinger, Schwab, Mura, Erdelyi, Szabó, Rendon, Sahel, Picaud and Roux2011). Preventing GABA release from HCs by targeted deletion of VGAT removed the feedback to cone photoreceptors (Hirano et al., Reference Hirano, Liu, Boulter, Grove, Pérez de Sevilla Müller, Barnes and Brecha2016), possibly through an autaptic action of GABA on HCs, changing the membrane permeability to HCO3− and hence affecting the pH in the synaptic cleft (Liu et al., Reference Liu, Hirano, Sun, Brecha and Barnes2013). If GABA receptors are expressed in cone terminals, they could modulate cone output both by influencing directly the membrane potential and by affecting the pH in the synaptic cleft, as those expressed in HCs.
On the postsynaptic side, while the presence of GABA receptors on cone terminals has been reported in many lower vertebrates (reviewed in Wu, Reference Wu1992), it remains controversial regarding cones in mammals. In situ hybridization in rats showed signal in the outer nuclear layer (ONL) for β 1 subunit but not for several other subunits of GABAA receptors (α 1–4, β 2–3, γ 2, and δ) (Greferath et al., Reference Greferath, Müller, Wässle, Shivers and Seeburg1993, Reference Greferath, Grünert, Fritschy, Stephenson, Möhler and Wässle1995). β 1 and β 2 mRNAs were detected in the rat ONL by PCR (Grigorenko & Yeh, Reference Grigorenko and Yeh1994). In situ hybridization for the GABAA α 1 subunit was also negative in the rabbit retina (Brecha et al., Reference Brecha, Sternini and Humphrey1991). α and β subunits were detected in cone pedicles but not in rod spherules by immunohistochemistry in the cat (Vardi et al., Reference Vardi, Masarachia and Sterling1992). Further electron microscopic studies of macaque and rabbit retinas suggested that the GABA receptor subunit staining in the outer plexiform layer (OPL) might be attributed solely to the strongly labeled bipolar cell dendritic tips (Greferath et al., Reference Greferath, Grünert, Müller and Wässle1994; Vardi & Sterling, Reference Vardi and Sterling1994). α 1 and ρ subunits were not detected in mouse cones by immunoelectron microscopy (Kemmler et al., Reference Kemmler, Schultz, Dedek, Euler and Schubert2014). A GABA-evoked current was detected in only a fraction of cones in macaque flat mount retina, without pharmacological characterization (Verweij et al., Reference Verweij, Hornstein and Schnapf2003); the presence of both GABAA and GABAC receptors was reported by combining electrophysiology and immunohistochemistry in porcine cones in culture (Picaud et al., Reference Picaud, Pattnaik, Hicks, Forster, Fontaine, Sahel and Dreyfus1998) and in putative mouse cones from flat mount rd1 retinas or dissociated from wild-type C57BL/6J retinas (Pattnaik et al., Reference Pattnaik, Jellali, Sahel, Dreyfus and Picaud2000). These apparent discrepancies may be due to variations between species, a difficult path for GABA to reach the cone terminals in retinal flat mounts, low levels of expression of GABA receptor subunits in mammalian cones, difficulty in identifying dissociated cones, and/or changes in expression during retinal degeneration or in culture. To circumvent those issues, we have assessed directly the presence of GABA receptors in photoreceptors on acute slices of adult mouse retinas using either whole-cell or perforated patch clamp recordings.
Materials and methods
Retinal slice preparation
Procedures involving animals and their care were conducted in agreement with the ARVO Statement for the Use of Animals in Ophthalmic and Vision Research, the French Ministry of Agriculture, and the European Community Council Directive no. 86/609/EEC, OJL 358. Mice strains used in this study were either C57BL/6J or Balb/c ByJ bred at the Mouse Clinical Institute animal house (Illkirch, France). As results from both strains were similar, the results were pooled together. Mice were maintained in a 12 h/12 h light–dark cycle, with light ON from 7 AM to 7 PM. Light-adapted, adult (9–19 weeks) mice were killed by cervical dislocation in the morning (9–10 AM). The eyes of the mice were enucleated and immediately put in ice-cold bicarbonate-buffered saline (BBS), composed of (in mm) NaCl 126, KCl 2.5, CaCl2 2.4, MgCl2 1.2, NaH2PO4 1.2, NaHCO3 18, and glucose 11, previously bubbled with 95% O2/5% CO2. The cornea, lens, and vitreous were removed. The retina was detached from the pigmented epithelium and embedded in agarose 1.5% prepared in PBS (0.1 m, pH 7.4) kept at 42°C. After agarose solidification on ice, the retina was cut into 150- or 200-µm-thick slices using a Leica VT1000S vibratome (Leica, Wetzlar, Germany). The slices were kept at room temperature in bubbled BBS for at least half an hour before recording, in normal lighting conditions.
Patch clamp recordings
The slices were observed under infrared differential interference contrast (DIC) using a 63× objective and a C8484 camera (Hamamatsu, Massy, France) on a Leica DMLFS microscope (Leica). The preparation was continuously perfused at ∼2 ml/min with bubbled BBS. Pipettes (6–8 MΩ) were pulled from GC150TF borosilicate glass capillaries (Harvard Apparatus, Les Ulis, France) on a horizontal puller (DMZ Universal Puller; Zeitz Instruments, Munich, Germany). Two different intracellular solutions were used: one containing (in mm) KCl 42, K-gluconate 98, EGTA-Na4 10, MgCl2 1, HEPES 5, and ATP-Na2 5 (E Cl = −28.9 mV, junction potential of 12.4 mV, referred to in the text as E Cl = −29 mV) or KCl 138, EGTA-Na4 10, MgCl2 3, CaCl2 1, HEPES 10, ATP-Na2 3, and GTP-Na3 0.5 (E Cl = 1.9 mV, junction potential of 3.9 mV, referred to in the text as E Cl = 2 mV). For perforated patch recordings, amphotericin B (80–180 µg/ml) or gramicidin (80–100 µg/ml) was added to the pipette solution from a 120 mg/ml stock solution in DMSO. All solutions contained 10 µ m of Alexa Fluor® (488 or 594) Hydrazide (Molecular Probes, Eugene, OR), and the pH was adjusted to 7.4 with NaOH. The extracellular solution was the BBS described above, continuously bubbled with 95% O2/5% CO2. Potentials were corrected post-recording for the calculated junction potential. For simplicity, the potentials indicated in the text are rounded to integer values. All experiments were performed at room temperature (20–25°C), between 11 AM and 8 PM for the successful cone recordings, with no evident circadian variation (Supplementary material Fig. 4). Data were acquired using a Multiclamp 700A amplifier, a Digidata 1322A interface, and the pClamp9 software (Molecular Devices, Sunnyvale, CA). The data were filtered prior to digitization at a frequency of 1/2 or 1/5th of the acquisition frequency, which was 200 Hz for puffed GABA (γ-aminobutyric acid) and 10 kHz for depolarizing pulse experiments. Agonists were applied locally with a puffer pipette connected to a Picospritzer III (Parker Hannifin, Fairfield, NJ), and antagonists were applied via bath application. TPMPA [(1,2,5,6-tetrahydropyridin-4-yl)methylphosphinic acid] was obtained from Tocris (Ellisville, MI), and all others chemicals were obtained from Sigma-Aldrich (Lyon, France). All values are indicated as mean ± s.e.m.
Results
Targeting cone photoreceptors on mouse retinal slices
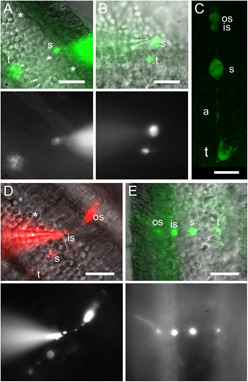
To determine if mouse photoreceptors express functional GABA receptors, we recorded cones and rods in the whole-cell patch clamp configuration, on acute slices from mouse retinas. Cones, which represent only 3% of the photoreceptor population in mice (Jeon et al., Reference Jeon, Strettoi and Masland1998), have slightly larger and more oval cell bodies than rods. This morphological difference allowed for a partially targeted rather than “blind” cone recording. Although most of the cone cell bodies were located close to the outer limiting membrane (Fig. 1A), some of them were also found close to the OPL (Fig. 1B). As an Alexa dye was included in the pipette solution, cone identity could be confirmed at the end of the recording by visualizing the synaptic terminal, as previously reported by Cangiano et al. (Reference Cangiano, Asteriti, Cervetto and Gargini2012). Cone pedicles (Fig. 1A–1C, Supplementary material Fig. 1) are much larger than the small rounded terminals of rods (Fig. 1D and 1E, Supplementary material Fig. 2). The long outer segment of rods (Fig. 1D and 1E, Supplementary material Fig. 3) was also more frequently observed than the shorter one of cones. While the formation of a gigaseal could be readily obtained with both types of photoreceptors, most of the cells were lost when attempting to go into the whole-cell configuration, possibly due to the fact that the nucleus occupies most of the cell soma volume. Some rods were recorded after contacting them at the level of the inner segment (Fig. 1D), which allowed for an easier transition to whole-cell mode. Some recordings were obtained using amphotericin B–perforated patch, which allowed for a higher success rate than whole-cell patch. Cone identity could be confirmed by dye diffusion after membrane rupture at the end of the recording.
Distinguishing cones from rods through their morphology. (A and B) Superposition of DIC images from retinal slices and fluorescence images, and fluorescence images only, of recorded cones, filled with Alexa Fluor 488. Cones had an oval soma (s) and a large terminal (t). Stars (*) indicate putative cone somas. (C) Confocal image from a cone filled with Alexa Fluor 488 acquired after recording. (D and E) Superposition of DIC images from retinal slices and fluorescence images, and fluorescence images only, of recorded rods, filled with either Alexa Fluor 488 or 594. The smaller rounded somas and terminals contrast with those of cones. Scale bars: 10 µm in C and 20 µm in other panels.

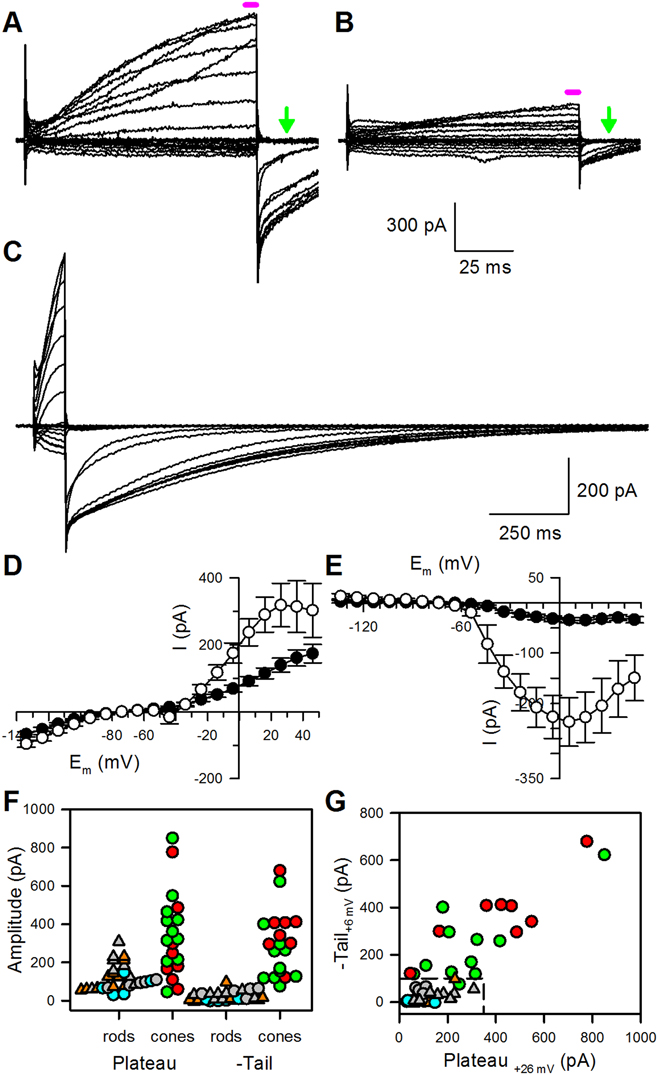
To compare the responses to GABA applications in cones with and without terminals, we needed a criterion to distinguish the latter from terminal-lacking rods. To this end, we compared the current–voltage (I–V) relationships obtained from photoreceptors. We have more specifically focused on I–V curves recorded with the E Cl = −29 mV pipette solution during 100 ms voltage steps, conditions for which we had the most cells in the different categories. For the well-identified, terminal-bearing photoreceptors, currents evoked by voltage steps above −50 mV were larger in cones than in rods (Fig. 2A–2D), as were the following tail currents (Fig. 2A–2C and 2E; 13 rods and 11 cones in Fig. 2D and 2E), requiring in some cones over a second to fully deactivate after a 100 ms depolarizing step (Fig. 2C). These currents were similar to the chloride currents described in cones from the larval tiger salamander (Barnes & Bui, Reference Barnes and Bui1991) and the ground squirrel (Szmajda & DeVries, Reference Szmajda and DeVries2011). The depolarization-evoked current was maximal at +26 mV (Fig. 2D), while the tail current peaked when returning from a step to +6 mV (Fig. 2E). The individual values of these currents are represented in Fig. 2F and 2G, distinguishing five groups of cells. Cones (n = 11) and rods (n = 13) that could be identified through the morphology of their synaptic terminal are represented by green and gray symbols, respectively. Rods identified as such through the presence of a typical outer segment but with no visible synaptic terminal are represented by orange symbols (n = 11). The remaining cells were tagged either as putative cones (red symbols, n = 8) or as putative rods (cyan symbols, n = 5), depending on the shape of their soma as observed prior to recording—oval for cones (see stars in Fig. 1A) and rounded for rods. The presence of a short outer segment was not used to tag cones, as such a segment could correspond to a damaged/collapsed rod outer segment. For both types of currents, the range of amplitudes was comparable between identified and putative cones and between identified and putative rods (Fig. 2F). However, there was some overlap between the cone and rod populations; thus, neither the plateau nor tail current amplitude alone could be used to unambiguously identify as cones some of the terminal-less cells. When considering both currents together, there was very little overlap between the cone and rod populations; all identified and putative rods being included in the range [I tail < 100 pA, I plateau < 350 pA], while all but one of the identified and putative cones were outside this range (Fig. 2G).
Electrophysiological signature of cones and rods. (A and B) Representative currents evoked by voltage jumps in a cone (A) and in a rod (B), from a holding potential of −74 mV, with 100 ms steps to potentials ranging from +46 mV to −134 mV by 20 mV decrements (E Cl = −29 mV intrapipette solution). The magenta horizontal bar indicates the period considered to measure the “plateau” current, as plotted in D, F, and G; the green arrow indicates the time at which the tail current was measured, 13 ms after repolarization, as plotted in panels E, F, and G. (C) Currents evoked by voltage jumps in a cone as in A, with a longer time scale to show the full deactivation of the Ca2+-dependent Cl− current. The interval between steps was 10 s to allow for a full deactivation of this current. (D) Current–voltage relationship of the current evoked by 100 ms voltage jumps, from a holding potential of −74 mV to potentials ranging from +46 mV to −134 mV by 10 mV decrements (E Cl = −29 mV intrapipette solution), measured from 97 to 99 ms following depolarization, for morphologically identified rods (black circles, n = 13) and cones (open circles, n = 11). (E) Current–voltage relationship of the tail current measured 13 ms after returning to the holding potential of −74 mV, following 100 ms voltage jumps to potentials ranging from +46 mV to −134 mV by 10 mV decrements (E Cl = −29 mV intrapipette solution), for rods (black circles, n = 13) and cones (open circles, n = 11). (F and G) Individual values of the “plateau” current measured at +26 mV (F) or the tail current measured after a depolarization at +6 mV (G) for rods (gray symbols when spherule is present, n = 13; orange symbols for rods for which no spherule could be seen at the end of the recording but identified as rods through their external segment, n = 11), putative rods (cyan symbols for cells considered as putative rods due to their soma appearance prior to patching, n = 5), cones (green symbols, presence of a pedicle, n = 11), or putative cones (red symbols, cells for which no pedicle could be seen at the end of the recording, but with a soma appearance suggestive of a cone prior to recording, n = 8). Triangles are used for rods in which an intact outer segment could be identified at the end of the recording and circles are used for other cells. The dotted line delimits the [I tail < 100 pA, I plateau < 350 pA] range, which includes all identified and putative rods and only one of the identified or putative cones.

Cones response to GABA applications
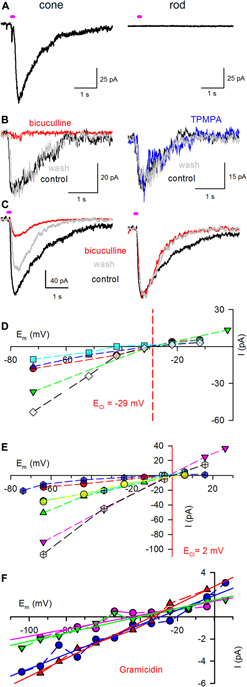
GABA (1 mm) was puffed nearby the synaptic terminal of the recorded photoreceptors (5–250 ms duration). A GABA-evoked current was detected in 34 of 35 cones with pedicles. The amplitude of the current evoked by a 100 ms puff of 1 mm GABA on 14 pedicle-bearing cones recorded with the E Cl = 2 mV intracellular solution ranged between −12.5 and −166 pA at −64 mV (−51.4 ± 46.5 pA, n = 14) (Fig. 3A, left). As GABA was applied to the surface of the slice, the current amplitude was at least in part dependent on the depth of the pedicle in the slice. Notably, a cone with an intact morphology but with a pedicle deeper than 30 µm (estimated from the epifluorescence focus) did not respond to GABA when puffed on the slice surface but responded when the puff pipette was dipped into the slice. As the response kinetics was similar to that of other cones after GABA puffs on the slice surface, it was most probably a true response to GABA rather than a mechanical artifact. No GABA-evoked current was detected from cells tentatively identified as pedicle-less cones through the current amplitude criteria presented in Fig. 2G (n = 4), in line with a GABA receptor localization restricted to the synaptic terminal, as in turtle retina (Tachibana & Kaneko, Reference Tachibana and Kaneko1984). No current was evoked in rods either (Fig. 3A, right), whether they had their spherule (n = 7) or not (n = 8). This was an additional control against a possible mechanical puff-induced response. Bicuculline methiodide (100 µ m) blocked 87.5 ± 3.2% (n = 11) of the GABA-evoked current (Fig. 3B, left). For cells in which bicuculline methiodide did not fully block the response to GABA, the presence of the antagonist did not change the kinetics of the GABA-evoked current, as can be seen in Fig. 3C, which presents both the raw traces (left) and currents normalized to their peak (right). This suggests that the remaining current corresponds to an incomplete blockade, rather than to a kinetically slower GABAC component. Consistent with this hypothesis, the GABAC antagonist TPMPA (50 µ m) had little effect (Fig. 3B, right) on the GABA-induced current, with a mean blockade of 4.7 ± 4.7% (n = 3). We could not systematically apply both inhibitors, as most of the cone recordings were short-lived. As expected for currents mediated by ionotropic GABA receptors, the GABA-evoked current reversed at a potential close to the Cl− equilibrium potential (E Cl): when E Cl was set at −29 mV, the current reversed at −30.3 ± 4.1 mV (n = 5, Fig. 3D). When E Cl was set at 2 mV, the current reversed at 0.7 ± 1.7 mV (n = 7, Fig. 3E).
Cone responses to GABA have a GABAA pharmacology. (A) Puff application of GABA (100 ms, 1 mm) in the vicinity of a photoreceptor terminal evoked a current in cones (left) but not in rods (right). The holding potential was −74 mV, as in B and C. (B) Cone responses to puff application of GABA (100 ms, 1 mm, control trace in black) were blocked by 100 µ m bicuculline methiodide (left, red trace) but not by 50 µ m TPMPA (right, blue trace). Traces obtained following wash out of the applied drug are shown in gray. (C) As in B, but for a cone in which GABA response was not fully blocked by 100 µ m bicuculline methiodide (left, red trace). The right panel represents the traces from the left panel normalized to their peak, showing that the remaining component has the same kinetics as the control and wash currents. (D and E) Currents evoked by GABA reversed close to E Cl, whether it was set close to −29 mV (D, five cells) or 2 mV (E, six cells), depending on the intrapipette solution. The calculated E Cl is represented by a red line for reference. Each cell is plotted with a given color and distinct symbols linked by a dashed line. (F) GABA-evoked currents as a function of membrane potentials for four cones recorded using gramicidin-perforated patch. Data points of a given cell are linked by a dashed line; solid lines are linear regressions to the data points.

E Cl in mouse cones
The physiological role of the GABA-evoked current depends on its reversal potential. To assess this parameter, we used gramicidin-perforated patch recordings. The success rate of such recordings on cones was very low. In four cells with adequate intracellular access, GABA evoked very small currents (−3.4 ± 1.7 pA at −94 mV, −1.5 ± 0.8 pA at −64 mV). It is probable that these cells were cones rather than rods, as in whole cell, we did not record any GABA response from identified rods (0/7) in opposition to cones (34/35), as mentioned above. The GABA-evoked current changed linearly with the membrane potential, reversing at −36.9 ± 6.3 mV (n = 4, Fig. 3F).
Discussion
There is contradictory evidence for the presence of functional GABAA receptors on cone synaptic terminals, depending on species. GABAA receptor–mediated currents were reported in many lower vertebrates, including in the turtle (Kaneko & Tachibana, Reference Kaneko and Tachibana1986) and the salamander (Wu, Reference Wu1986). Atypical ionotropic GABA receptors as well as GABAB receptors were detected in the bullfrog retina (Liu et al., Reference Liu, Zhao, Du and Yang2005, Reference Liu, Li and Yang2006). There are, however, very few published electrophysiological recordings from mammalian cones. Small GABA responses were detected in only a fraction of cones in macaque flat mount retinas (5/12), with a polarity matching the one expected for a Cl− current in four of the five responding cones (Verweij et al., Reference Verweij, Hornstein and Schnapf2003). No pharmacology was performed to determine if those responses could be due to the activation of GABA receptors. Large GABAA and GABAC currents were recorded both in primary culture of pig cones (Picaud et al., Reference Picaud, Pattnaik, Hicks, Forster, Fontaine, Sahel and Dreyfus1998) and in putative mouse cones, either on flat mount rd1 mouse retinas or on dissociated from C57BL/6J retinas (Pattnaik et al., Reference Pattnaik, Jellali, Sahel, Dreyfus and Picaud2000).
We report here for the first time, in morphologically identified cones on acute mouse retinal slices, the presence of GABA-evoked currents with a GABAA pharmacology. Cone identification was obtained through the inclusion of a morphological dye into the patch pipette, allowing the visualization of the large cone synaptic terminal. Moreover, cones with terminals displayed currents comparable to the calcium-activated chloride currents/glutamate transporter currents detected in cones from other species (Barnes & Hille, Reference Barnes and Hille1989; Szmajda & DeVries, Reference Szmajda and DeVries2011; Verweij et al., Reference Verweij, Hornstein and Schnapf2003). As no synaptic transmission blocker was present in our recording conditions, the GABA-evoked current could correspond to a secondary current following a GABA action on HC, as observed in the rat retina (Liu et al., Reference Liu, Hirano, Sun, Brecha and Barnes2013) rather than a direct effect on GABAA receptors present on cone pedicles. It is, however, unlikely, as the recorded current was reversing close to E Cl with a voltage dependence not compatible with a modulation of the activation curve of cone calcium channels. If that was the case, the maximum effect would have occurred in the −35 to −45 mV range, and minimal effect at potentials below −60 mV or over 0 mV. However, the maximal (absolute) amplitude of the GABA-evoked currents was systematically recorded at the most negative potential tested, which was between −102 and −64 mV, depending on the recording conditions (Fig. 3D–3F). In addition, outward currents could be recorded above 0 mV for many cones. The most likely explanation is thus that functional GABAA (and not GABAC) receptors are expressed in mouse cone pedicles. While such a conclusion would have been expected some decades ago when lateral inhibition was considered to result from a GABAergic inhibition of cones, it is now dissonant with a number of published studies, either on the presence of functional GABA receptors on mammalian cone pedicles or on the indirect response of cones to GABA, mediated by HCs.
The apparent discrepancy between our results and the reported presence of both GABAA and GABAC currents in cultured pig cones (Picaud et al., Reference Picaud, Pattnaik, Hicks, Forster, Fontaine, Sahel and Dreyfus1998) and in mouse cones from flat mount rd1 retinas or freshly dissociated from C57BL/6J retinas (Pattnaik et al., Reference Pattnaik, Jellali, Sahel, Dreyfus and Picaud2000) can be tentatively explained. In the former case, it could come either from a difference between mouse and pig cones or a partial dedifferentiation of pig cones after 2–10 days in culture. In flat mount rd1 retinas, cone identity was deduced from the localization in the thin remaining outer nuclear layer at an age at which most rods have degenerated. The recording of both GABAA and GABAC currents, larger than the GABAA-only current reported here, could thus be due to a partial dedifferentiation of cones or morphological rearrangements occurring during degeneration, with the presence of bipolar cells at the distal surface of the degenerated rd1 retinas. The former hypothesis is supported by transcriptome studies from rd1 cones at more advanced ages (110–220 days), suggesting that the GABAC ρ 1 and ρ 2 subunit mRNAs are expressed by surviving cones (Busskamp et al., Reference Busskamp, Duebel, Balya, Fradot, Viney, Siegert, Groner, Cabuy, Forster, Seeliger, Biel, Humphries, Paques, Mohand-Said, Trono, Deisseroth, Sahel, Picaud and Roska2010; see also GEO Series GSE22338). The latter is consistent with the current–voltage relationships of the recorded cells, reminiscent of those of rod bipolar cells. The four freshly dissociated cells from C57BL/6J retinas considered as cones in the same report may similarly have been bipolar cells with partially damaged/collapsed processes, morphologically close to cones once their pedicle and inner/outer segments have collapsed, which occurs quickly after dissociation—their current–voltage relationships are also matching those from rod bipolar cells, both in kinetics and in amplitude.
Besides these initial reports, more recent studies suggest that mammalian cones do not express GABA receptors. The lack of a systematic GABA response of macaque cones on flat mount retinas (Verweij et al., Reference Verweij, Hornstein and Schnapf2003), seconded by similar results from David Schneeweis obtained on macaque retinal slices (personal communication reported in Verweij et al., Reference Verweij, Hornstein and Schnapf2003), indicates that macaque cones do not consistently respond, directly or indirectly, to GABA applications. Similarly, GABA-evoked currents were not detected in ground squirrel cones, over a large range of potentials (−110 to +40 mV; Sercan Deniz and Steven DeVries, personal communication). In rat (Liu et al., Reference Liu, Hirano, Sun, Brecha and Barnes2013) and mouse (Kemmler et al., Reference Kemmler, Schultz, Dedek, Euler and Schubert2014) retinal slices, the effect of GABA on cone calcium signals is not direct but occurs through HCs. In the macaque retina, as surround antagonism was observed in only 20% of the cones (Verweij et al., Reference Verweij, Hornstein and Schnapf2003), the lack of an indirect action of GABA on cones in macaque (and ground squirrel) could be due to the lability of the secondary mechanism relaying HC membrane potential changes to cones in these species. This mechanism could be more robust in rodent retinas, allowing for a more reliable detection of responses in rat and mouse cones—however, not in our case. Both Liu et al. (Reference Liu, Hirano, Sun, Brecha and Barnes2013) and Kemmler et al. (Reference Kemmler, Schultz, Dedek, Euler and Schubert2014) prepared slices using a tissue chopper, while we used agarose embedding and vibratome sectioning. Even if it is slower and possibly more mechanically demanding on the tissue due to the blade vibrations, it should not weaken the HC to cone contact sufficiently to prevent feedback. Studies that did not detect an indirect GABA effect on mammalian cones (Verweij et al., Reference Verweij, Hornstein and Schnapf2003, David Schneeweiss, Steven DeVries, ours) used patch clamp recordings of cone currents, while those which did (Liu et al., Reference Liu, Hirano, Sun, Brecha and Barnes2013; Kemmler et al., Reference Kemmler, Schultz, Dedek, Euler and Schubert2014) rely on calcium imaging. The indirect effect is expected to be mediated by pH changes in the synaptic cleft (Liu et al., Reference Liu, Hirano, Sun, Brecha and Barnes2013), as well as by hemichannels (Kemmler et al., Reference Kemmler, Schultz, Dedek, Euler and Schubert2014), both resulting in a modulation of the calcium channel activation curve. Whole-cell recordings of cones may perturb this indirect effect due to the rundown of calcium channel currents. However, we recorded some cones using amphotericin (crossed symbols in Fig. 3E) or gramicidin-perforated patch (Fig. 3F), which should better preserve calcium channel activity over the time course of the experiments. Those cones responded to GABA similarly to those recorded in whole-cell configuration, with no sign of a nonlinearity in the potential range affecting calcium channel activation. Another difference between our conditions and those of Liu et al. (Reference Liu, Hirano, Sun, Brecha and Barnes2013) and Kemmler et al. (Reference Kemmler, Schultz, Dedek, Euler and Schubert2014) is that we used fully light-adapted retinas. This could tentatively explain the discrepancy between their results and ours, as lateral inhibition is affected by the ambient light level and the light adaptation state of the retina (reviewed in Thoreson & Mangel, Reference Thoreson and Mangel2012). In Kemmler et al. (Reference Kemmler, Schultz, Dedek, Euler and Schubert2014), the conclusion that “GABA is unlikely acting directly at the [mouse] cone terminal, but instead may modulate cone output by controlling other feedback mechanisms,” was based on (1) the fact that the observed changes in calcium signal evoked by GABA puffs in cone pedicles were in contrast to what is expected from a GABAergic inhibition and (2) the lack of immunostaining for α 1 and ρ 1 subunits. Neither of these arguments can rule out the presence of GABAA receptors on cone pedicles: (1) the direct action of GABA on cones depends on E Cl, which most reports point as close to the dark potential: −34 mV in the salamander (Thoreson & Bryson, Reference Thoreson and Bryson2004), −31 mV in the ground squirrel (Szmajda & DeVries, Reference Szmajda and DeVries2011), −37 mV in the putative mouse cones we recorded in the gramicidin-perforated patch configuration. Only a small change in membrane potential is thus expected from the activation of GABA receptors. Moreover, this effect could be masked by the indirect effect mediated by HCs. (2) The presence of the α 1 subunit is not required to have functional GABAA receptors (reviewed in Olsen & Sieghart, Reference Olsen and Sieghart2008).
The group of Stuart Mangel reported in the recent years an increase in the expression of GABA receptor subunits in rabbit cones during the night (Mangel S. et al., IOVS 2013;54:ARVO E-Abstract 404, Mangel S. et al., IOVS 2015;56:ARVO E-Abstract 1340, Mangel S., IOVS 2016;57:ARVO E-Abstract 588). There was, however, no recording from rabbit cones to demonstrate that this increase is associated with the presence of functional receptors on the cone terminals. While rabbits are endogenously nocturnal animals, they become predominantly diurnal in animal house conditions (Jilge, Reference Jilge1991). Thus, similar circadian changes in receptor expression may explain the absence of GABA-evoked current in macaque and ground squirrel cones during the day. Nocturnal animals such as rats and mice could be expected to have opposed variations, with GABAA receptor expression during the day. Our GABA responses recordings from mouse cones were obtained during the day (12 PM–8 PM), with no evidence of a circadian influence on the current amplitude (Supplementary material Fig. 4). This time period may have been too short to detect it, but it should also be kept in mind that both mouse lines used in this study are melatonin deficient (Ebihara et al., Reference Ebihara, Marks, Hudson and Menaker1986), which may prevent circadian changes in receptor expression.
Since the initial demonstration of HC to cone negative feedback in the vertebrate retina (Baylor et al., Reference Baylor, Fuortes and O’Bryan1971), identifying the underlying mechanism(s) has been an active field of research. There is now growing evidence that lateral inhibition results from the compound action of various pathways modulating the pH in the synaptic cleft (Vroman et al., Reference Vroman, Klaassen, Howlett, Cenedese, Klooster, Sjoerdsma and Kamermans2014; Warren et al., Reference Warren, Hook, Supuran and Thoreson2016a), including HC GABA receptors (Liu et al., Reference Liu, Hirano, Sun, Brecha and Barnes2013), together with an ephaptic mechanism (Kamermans et al., Reference Kamermans, Fahrenfort, Schultz, Janssen-Bienhold, Sjoerdsma and Weiler2001; Kamermans & Fahrenfort, Reference Kamermans and Fahrenfort2004; Warren et al., Reference Warren, Hook, Tranchina and Thoreson2016b; reviewed in Thoreson & Mangel, Reference Thoreson and Mangel2012; Chapot et al., Reference Chapot, Euler and Schubert2017). The causes of many apparent discrepancies have been progressively identified, but many others still have to be understood. Regarding the influence of GABA on cone responses to center-surround illumination, a confounding factor may have been the low capacity of HCs to counteract the GABA loss happening during retinal harvesting for electrophysiology, as described in the mouse retina (Deniz et al., Reference Deniz, Wersinger, Schwab, Mura, Erdelyi, Szabó, Rendon, Sahel, Picaud and Roux2011). This may apply to other species, including those with both a well-established GABAergic nature of HCs and expression of GABA receptors on cone terminals, as the turtle. If a GABA-dependent feedback was detected only in the presence of pentobarbital in slices (Tatsukawa et al., Reference Tatsukawa, Hirasawa, Kaneko and Kaneda2005), it may be occurring more robustly in vivo. Besides discrepancies, it is unclear why a diversity of modulatory mechanisms coexist in the HC to cone synapse, or in other words what is the exact contribution of each mechanism depending on the type of stimuli. It is notably hard to predict the role of cone GABA receptors. As mentioned above, many reports indicate that the cone E Cl is close to the dark potential: opening or closing of GABA receptors in response to changes in the GABA release from HCs should then have little direct effect on the cone membrane potential. This effect will be more substantial when the cone E Cl is more negative than the dark potential, as in the turtle or the goldfish (Kaneko & Tachibana, Reference Kaneko and Tachibana1986; Kraaij et al., Reference Kraaij, Spekreijse and Kamermans2000). As cones are graded potential neurons, even small changes in the membrane potential can change the glutamate release. GABA receptors could also contribute through their influence on the synaptic cleft pH, as proposed for those of HCs (Liu et al., Reference Liu, Hirano, Sun, Brecha and Barnes2013), through their permeability to HCO3−. Changes in intracellular Cl− may also affect the release, either through the modulation of calcium channels (Babai et al., Reference Babai, Kanevsky, Dascal, Rozanski, Singh, Fatma and Thoreson2010; Thoreson et al., Reference Thoreson, Nitzan and Miller2000) or through changes in osmotic tension (Chavas et al., Reference Chavas, Forero, Collin, Llano and Marty2004).
Supplementary material
To view supplementary material for this article, please visit https://doi.org/10.1017/S0952523819000038.
Acknowledgments
This work was supported by Human Frontier Science Program grant RGY0004/2003 to M.J.R., Fédération des Aveugles de France to S.D., Association Française contre les Myopathies SAFM05-002 to E.W., ANR GABARET to S.P., ANR-10-LABX-0030-INRT, a grant from a French State fund managed by the Agence Nationale de la Recherche under the frame program Investissements d’Avenir ANR-10-IDEX-0002-02, CNRS, INSERM, Université Pierre and Marie Curie, Assistance Publique-Hôpitaux de Paris. We thank Dr. Steve DeVries for his comments on the initial version of the manuscript.
Abbreviations
- BBS
Bicarbonate-buffered saline
- DIC
Differential Interference Contrast
- DMSO
Dimethyl sulfoxide
- GABA
γ-amino butyric acid
- GCL
Ganglion cell layer
- HC
Horizontal cell
- INL
Inner nuclear layer
- ONL
Outer nuclear layer
- OPL
Outer plexiform layer
- PBS
Phosphate-buffered saline
- TPMPA
(1,2,5,6-Tetrahydropyridin-4-yl)methylphosphinic acid
- VGAT/VIAAT
Vesicular GABA Transporter / Vesicular Inhibitory Amino Acid Transporter