

Eating with others has been shown to have a powerful effect on the amount of food eaten during a snack or meal(Reference de Castro and Brewer1). For example, it has been reported that people generally eat more in the company of friends and relatives than when alone(Reference de Castro and Brewer1–Reference Redd and de Castro3). On the other hand, eating can be inhibited in the presence of others compared with eating alone if an accompanying diner is of the opposite sex and considered attractive(Reference Mori, Chaiken and Pliner4, Reference Pliner and Chaiken5). For example, women tend to eat less when in the company of a desirable man than when alone(Reference Mori, Chaiken and Pliner4). Also, when an eating partner is consuming a large amount of food, individuals have been shown to model this behaviour and eat a large amount(Reference Herman, Roth and Polivy6).
Social modelling effects on eating have been observed in studies that have employed a confederate as the eating companion (a person known to the experimenter who acts as a participant), as well as studies that have observed eating among natural dyads composed of strangers(Reference Herman, Roth and Polivy6, Reference Rosenthal and Marx7) and friends(Reference Salvy, Jarrin and Paluch8). Others have reported that eating behaviour can be influenced by other people even when those people are not actually present at the eating occasion(Reference Roth, Herman and Polivy9). In this type of study, which has been termed a ‘remote-confederate’ design, participants find out about the amount consumed by prior participants. Participants who are exposed to information that previous participants ate a large amount tend to eat more than participants exposed to information that previous participants ate a small amount(Reference Roth, Herman and Polivy9). The power of social modelling of food intake is further underlined by the finding that individuals will consume small amounts of food in the presence of a companion who eats minimally even when they are food deprived(Reference Goldman, Herman and Polivy10).
Social modelling of food choices, for example choice of ‘healthy’ or low-energy-dense food v. ‘unhealthy’ or high-energy-dense items, has been less thoroughly investigated. For example, if others around us are avoiding ‘unhealthy’ foods and choosing only ‘healthy’ foods, do we model these choices and select more healthy food and less unhealthy food? If such effects exist, they may have significant implications. Even small changes in dietary choices can lead to significant health benefits(Reference Hill, Wyatt and Reed11), thus understanding whether the behaviour of those around us may undermine or encourage healthier or unhealthier food choices is important.
A study by Pliner & Mann(Reference Pliner and Mann12) investigated the effect on cookie choice of providing information about the choices of previous fictitious participants. In this study, three groups of participants each saw a sheet of paper that had details of the choices of previous participants. Participants either saw that most previous participants had chosen an ‘unhealthy’ creamy cookie, a ‘healthy’ light cookie or saw no information. No influence of social information on cookie choice was reported, with almost all participants choosing the ‘unhealthy’ creamy cookie. The authors interpreted these results as suggesting that choices may be less susceptible to social modelling than intake and that this might be because people feel sure of their food likes and dislikes and do not need to look to others to guide these preferences. Hermans et al. (Reference Hermans, Herman and Larsen13) also suggest that intake modelling effects are weaker in contexts in which routines guide eating behaviour. Moreover, Salvy et al. (Reference Salvy, Elmo and Nitecki14) and Clendenen et al. (Reference Clendenen, Herman and Polivy15) have shown that intake from ‘meal foods’ (i.e. sandwiches) is less influenced by who is present during consumption, than intake of snacks. This may be because individuals are more certain of what is and is not appropriate to consume as part of a main meal. As argued by Pliner & Mann(Reference Pliner and Mann12), because social influence may be related to uncertainty about what constitutes appropriate eating in a social context, food choices may be more resistant to social influence than amounts consumed because people know what they do and do not like.
However, the findings from other research have suggested that food choice is subject to social influence. For example, it has been observed that food choices of married couples tend to converge over time(Reference Bove, Sobal and Rauschenbach16), suggesting modelling in couples. Moreover, Croker et al. (Reference Croker, Whittaker and Cooke17) also found that men's intentions to eat fruit and vegetables were influenced by perceived social norms. More recently, habitual consumption of fruit and vegetables by adolescents has been reported to be influenced by perceived social norms(Reference Lally, Bartle and Wardle18). Clendenen et al. (Reference Clendenen, Herman and Polivy15) assessed the influence of the number and familiarity of dining partners on food intake and found that when in the presence of friends, participants tended to choose more cookies than when they were in the presence of strangers(Reference Clendenen, Herman and Polivy15). In addition, the food selection of children and adolescents has been reported to be differentially influenced by the source of social influence and age and sex of the young person(Reference Salvy, Elmo and Nitecki14). Male and female children have been reported to consume less energy from unhealthy snacks when in the presence of their mothers than when in the company of their friends. Conversely, female adolescents consumed less energy from unhealthy snacks and more energy from healthy snacks when they were with their friends than when they were with their mothers(Reference Salvy, Elmo and Nitecki14), further adding to the suggestion that social context may influence types of foods consumed.
In Herman and colleagues'(Reference Herman, Roth and Polivy6) normative framework of social influences on food intake, it has been suggested that impression management is likely to be an important factor influencing eating behaviour in social contexts. Indeed, intake is sometimes inhibited to manage self-image(Reference Mori, Chaiken and Pliner4, Reference Pliner and Chaiken5), presumably to create a desirable impression to eating partners. In addition, Robinson et al. (Reference Robinson, Tobias and Shaw19) have shown that matching of food intake is driven by ingratiation needs and the desire to be socially accepted. Thus, it is conceivable that if those around us are choosing only ‘unhealthy foods’ or ‘healthy foods’, we may model this behaviour and choose similarly, in order to ingratiate.
No study to date has directly manipulated the type of food chosen by one member of an eating pair and then examined whether modelling of those choices occurs in the other member of that pair. Previous studies of social influences on food choice did not use a confederate to manipulate food choice(Reference Salvy, Elmo and Nitecki14, Reference Clendenen, Herman and Polivy15). Pliner & Mann did manipulate the choice (healthy v. unhealthy) of a remote confederate but found no effect on participants' food choice. However, the food selection task in this study was somewhat artificial, requiring participants to choose a food to take home and rate for taste qualities over several days. In addition, shortly before the food selection task, participants had tasted the ‘light’ cookie and taste ratings suggested that it was distinctly unpalatable, which may have influenced the pattern of the results. In more natural settings, using more palatable foods, social influence on food choice may be important, as discussed by Pliner & Mann(Reference Pliner and Mann12).
Thus, the aim of the present study was to examine whether observing someone else making either predominantly ‘unhealthy’ or ‘healthy’ eating choices at a buffet would influence food choice. Under the guise of a study investigating the effects of mood and eating attitudes, participants selected a lunch-time meal from a buffet that consisted of high-energy-dense foods and low-energy-dense foods. Participants either made food choices alone or with a confederate. The confederate either chose predominantly high-energy-dense foods and no low-energy-dense foods (termed the ‘unhealthy’ confederate condition) or predominantly low-energy-dense foods and no high-energy-dense foods (termed the ‘healthy’ confederate condition). In both confederate conditions, the confederate also chose a serving of sandwich alongside either all ‘healthy’ or all ‘unhealthy’ food items. This was so her selection was seen as a relatively normal and a plausible lunch. Due to the accumulation of literature linking social factors to food choice, we hypothesised that participants who chose in the presence of the ‘unhealthy’ confederate would choose more high-energy-dense items and fewer low-energy-dense items than when alone, whereas participants in the ‘healthy’ confederate condition would choose more healthy items and fewer high-energy-dense items than when alone.
Methods
Participant recruitment
A total of 105 female students from the University of Birmingham were recruited (mean age 19·9 (sd 2·6) years). BMI was within the healthy range (mean 21·9 (sd 3·3) kg/m2). To disguise the aims of the study, it was advertised as research examining ‘mood and consumer research on eating attitudes’. Participation was in return for course credit via a scheme in which participants voluntarily sign up for participation in research studies as part of their research training. Advertisement was through an online portal in which participants signed up to time slots in advance of study participation. Participants were instructed to abstain from eating 2 h before the study, to ensure they were not satiated on arrival. Due to the foods in the lunch buffet, vegetarians and participants with food allergies were instructed not to sign up for the study. The present study was conducted according to the guidelines laid down in the Declaration of Helsinki and all procedures involving human participants were approved by the University of Birmingham ethics committee. Written informed consent was obtained from all participants.
Experimental conditions
Participants were randomly assigned to one of three experimental conditions. Participants in the ‘unhealthy’ confederate condition selected food after having viewed a confederate choose a lunch consisting of three sandwich quarters and only high-energy-dense food items; crisps ( × 6 large crisps), cheese and onion pastries ( × 2) and cocktail sausages ( × 4). The energy content of foods selected by the ‘unhealthy’ confederate was 1674 kJ (400 kcal). Participants in the ‘healthy’ confederate condition selected food after having viewed a confederate choose a lunch consisting of three sandwich quarters and only low-energy-dense food items; carrot sticks ( × 8), cherry tomatoes ( × 4) and rice cakes ( × 4). The energy content of foods selected by the ‘healthy’ confederate was 837 kJ (200 kcal).
The numbers of individual food items were selected to ensure that in both conditions the confederate had a similar volume of food on their plate (one plate full), but, importantly, the choices of the confederates were derived from either high- or low-energy-dense items. Regardless of the condition, the confederate selected three sandwich quarters, so that the lunch included a staple food item to ensure that the lunch selections appeared plausible to the participants. The sandwiches used were roast chicken, a food we assumed to be viewed as neither very ‘healthy’ nor ‘unhealthy’ (the energy density of the sandwich was lower than the unhealthy food items and higher than the healthy food items in the buffet). Participants in the ‘choosing-alone’ condition selected food alone.
Confederate
In all experimental sessions, three female undergraduate research students acted as the confederates. They were selected due to their similarity to our sampled population; aged 18–21 years, BMI was within the healthy range (19·2, 19·5 and 21·5 kg/m2). The confederates were instructed to behave similarly for all participants (see the ‘Procedure’ section for instructions concerning conversational style during the sessions) and alternated between playing the ‘unhealthy’ and ‘healthy’ confederate for consecutive participants. During the food choice part of the study, the confederate was instructed to select her food items in clear view of the participant, first selecting the sandwiches, followed by the remaining food items (dependent on the condition). After selecting their foods, the confederate was instructed to stand at the side of the buffet table, ensuring her plate was visible to the participants. All confederates received training and checks by the lead researcher, ensuring that the confederates selected the correct types and amount of foods during the experimental sessions.
Lunch buffet
All food was purchased from a local supermarket (Sainsbury's UK, Birmingham). Food was selected from a buffet cart in a kitchen area of the laboratory. The buffet consisted of seven food items, each food item placed on its own separate plate: roast chicken sandwich cut into quarters, 27·7 g per quarter ( × 8 quarters, 9·2 kJ/g (2·2 kcal/g)); cheese and onion pastries, 15·3 g each ( × 10, 14·2 kJ/g (3·4 kcal/g)); cocktail sausages, 9·8 g each ( × 12, 12·6 kJ/g (3·0 kcal/g)); ready salted crisps, 1·5 g each ( × 17, 21·3 kJ/g (5·1 kcal/g)); carrot sticks, 5·7 g each ( × 20, 1·1 kJ/g (0·26 kcal/g)); cherry tomatoes cut in half, 6·6 g per half ( × 16 halves, 0·71 kJ/g (0·17 kcal/g)); salt and vinegar rice cakes cut into quarters, 2·6 g per quarter ( × 10 quarters, 16·4 kJ/g (3·91 kcal/g)).
Procedure
Sessions took place between 12.00 and 14.00 hours on weekdays. The confederate was instructed to arrive at the study waiting area 5 min before the allotted start time of the session. On arrival of the participant, a researcher greeted both the confederate and the participant (or only the participant in the ‘choosing-alone’ condition). The researcher led both the confederate and the participant to a room furnished to appear similar to a café. To increase plausibility of the confederate being a normal participant in the study, both the confederate and participant were seated at opposite ends of a small table (or alone if in the ‘choosing-alone’ condition) before being asked to complete demographic questionnaires, hunger; ‘how hungry are you right now? (mark with an x)’ using a 10 cm line scale with anchors ‘not at all’ and ‘extremely’, and a dummy personality questionnaire consisting of ten multiple choice questions, to corroborate the cover story.
In the confederate conditions, the confederate was instructed to rate hunger at approximately the midpoint on the scale and provide the same answers for the personality questions for all sessions. It is possible that participants may have noticed the confederate's responses but the responses would have been similar for all conditions. On completion, the experimenter returned and instructed participants that they would be required to select and eat a lunch as part of the study. If at any point participants attempted to make conversation with the confederate, the confederates were instructed to answer politely and ask a similar question back.
The researcher then led the confederate and/or the participant to the buffet area. The experimenter explained that they were free to select whatever they liked. In the confederate conditions, the researcher first passed a plate to the confederate. After the confederate had made their choices (in view of the participant), the confederate waited at the side of the buffet (with their selected lunch in view) and the researcher gave a plate to the participant. The researcher then moved to a different area of the room and told the confederate and participant to let her know when they were ready, so she could explain what to do next. The researcher then returned and sent the participant and the confederate to separate rooms to eat their lunch. In the ‘choosing-alone’ condition, participants were given a plate and selected lunch alone, while the researcher waited in the different area of the laboratory.
After they had finished eating the lunch (participants were not constrained to a set time to eat their selected lunch), participants were instructed to complete a questionnaire that had been left in the testing room. To corroborate the cover story, the first part of the questionnaire asked participants to ‘please rate how enjoyable the food items from lunch were (mark with an x)’. Responses were made on separate rating scales for each food (10 cm line scale, anchors; ‘not at all enjoyable’ and ‘extremely enjoyable’). Participants were instructed not to rate foods they had not eaten. Participants then completed the cognitive restraint scale of the Three-Factor Eating Questionnaire(Reference Stunkard and Messick20).
Once the participant had completed her questionnaires, the researcher returned to the room and informed the participants in the confederate conditions that the ‘other participant’ was still completing her questionnaire, but they did not have to wait to finish the experiment. Participants were then asked to guess what the aims of the study were, before weight and height were measured using a set of digital weighing scales and stadiometer to calculate BMI (kg/m2). To calculate the amount of each food item selected by the participant, buffet plates were reweighed and any food selected but not consumed was also weighed.
Statistical analysis
ANOVA was used to check if the groups were balanced for baseline hunger, restraint, age and BMI. To examine whether eating with an ‘unhealthy’ or ‘healthy’ confederate affected food choice, selected grams of low-energy-dense (carrot sticks, tomatoes and rice cakes combined), high-energy-dense (cocktail sausages, crisps and pastries) foods and sandwiches (staple food item selected by the confederate in both conditions) were subjected to ANOVA. PASW 18© (SPSS, Inc.) was used for data analysis.
Results
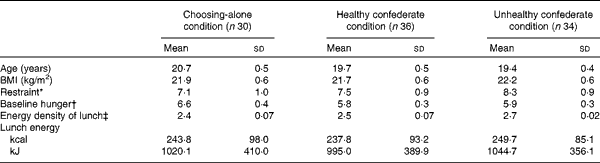
In the present experiment, five participants came close to guessing the aims of the study (e.g. ‘if I choose food differently when I am with someone else’), so were removed from the data analyses. The analysis indicated that the groups did not differ significantly in baseline hunger, restraint, age or BMI (Table 1).
Participant characteristics by condition (Mean values and standard deviations)
* Restraint indicates a score between 0 and 21 (0 = low; 21 = high).
† Measured using a 0–10 cm line scale.
‡ Expressed as g food/kJ.
Taste ratings
All food items were rated as being palatable (mean values); the highest rated, on the 0–10 scale (anchors ‘not at all’ and ‘extremely enjoyable’), were cherry tomatoes (7·2 (sd 2·1)), followed by crisps (6·9 (sd 1·9)), sandwiches (6·8 (sd 2·1)), carrot sticks (6·7 (sd 2·0)), cocktail sausages (6·7 (sd 2·0)), rice cakes (6·3 (sd 2·6)) and savoury pastries (5·9 (sd 2·7)).
Food choice: low-energy-dense foods
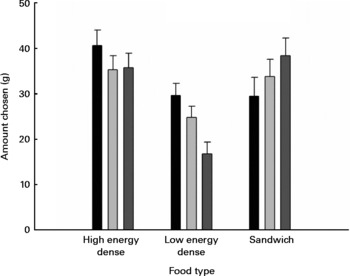
The total number of grams of low-energy-dense foods selected by the participants differed by condition (F (2,97)= 6·4, P= 0·002). Participants in the ‘unhealthy’ confederate condition chose significantly fewer grams of low-energy-dense food than those in the ‘choosing-alone’ condition (P= 0·001) and the ‘healthy’ confederate condition (P= 0·02). No other between-group differences were observed (Fig. 1).
Mean grams of sandwich, high-energy-dense and low-energy-dense foods chosen by condition. Values are mean number of grams of each food type by condition, with standard errors represented by vertical bars. ■, Control;  , healthy;
 , unhealthy.
To further examine low-energy-dense food choice, the frequency of choice of each low-energy-dense food individually was compared across the conditions using the χ2 test. The frequency of participants choosing tomatoes (χ2(2) = 1·6, P= 0·45) and rice cakes (χ2(2) = 1·1, P= 0·56) did not differ across the conditions. The results indicated that only the frequency of selection of carrots differed across the groups (χ2 (2) = 13·3, P= 0·001). Participants in the ‘unhealthy’ confederate condition were significantly less likely to have chosen carrots than those in the ‘choosing-alone’ condition and the ‘healthy’ confederate condition (Table 2).
Percentage of participants choosing food items*

* Values indicate percentage of participants in each condition who selected at least one portion of food type.
Food choice: high-energy-dense foods and sandwiches
The number of grams of high-energy-dense foods selected by the participants did not differ by condition (F (2,97)= 0·78, P= 0·46). Grams of sandwich chosen (staple food chosen by the confederates in both the ‘healthy’ and ‘unhealthy’ conditions) did not differ across the conditions (F (2,97)= 1·27, P= 0·29).
Total energy density of the chosen meal and energy
There was a significant effect of group on energy density (F (2,97)= 3·6, P= 0·03). Participants in the ‘unhealthy’ confederate group chose a meal higher in energy density than both the control group (P< 0·05) and the ‘healthy’ confederate group (P< 0·05). See Table 1 for energy density of meal by condition. The total amount of energy of foods chosen did not differ by condition (F (2,97)= 0·15, P= 0·86). See Table 1 for meal energy by condition.
Intake
Of the participants, 90 % (94/105) consumed all of the food they selected for their lunch. In line with the choice data, a main effect of condition was observed for intake of low-energy-dense foods (F (2,99)= 6·3, P= 0·003), whereby participants in the ‘unhealthy’ confederate condition consumed significantly fewer grams of low-energy-dense food than those in the choosing-alone (P= 0·001) and ‘healthy’ confederate conditions (P= 0·02). No main effects were observed for intake of high-energy-dense foods (F (2,99)= 0·6, P= 0·58) or sandwiches (F (2,99)= 1·0, P= 0·40).
Discussion
We found that the presence of an eating partner affected food choice, but this effect was limited and was not in line with all of our hypotheses. Participants who selected a lunch-time meal in the presence of another person choosing predominantly high-energy-dense foods chose significantly fewer low-energy-dense food items than participants choosing alone, or in the presence of another person choosing predominantly low-energy-dense foods. This effect was due to reduced choice of carrot sticks in the presence of an ‘unhealthy’ confederate. There was no significant effect of condition on the number of sandwiches selected or on total energy selected from the buffet. In addition, no difference was observed for selection of low-energy-dense foods between the eating alone and eating in the presence of another person choosing predominantly low-energy-dense foods. No effect of condition was observed for selection of high-energy-dense foods, with all groups selecting a similar amount of high-energy-dense foods. These data suggest that modelling of food choices is not strong and is in line with the suggestion of Pliner & Mann(Reference Pliner and Mann12) that social modelling of food choice may be limited because people do not need to use other people's choices as a guide for their behaviour.
The reduction in the choice of low-energy-dense foods in the ‘unhealthy’ confederate condition was caused solely by the reduced choice of carrots. We suggest this may be because the other two low-energy-dense foods (cherry tomatoes and rice cakes) may have been viewed as less familiar items to consume as part of a lunch-time meal. In support of this, only around half of the participants in each group chose these items from the buffet. On the other hand, nearly all of the participants in the control group and the ‘healthy’ confederate group chose carrots from the buffet. This is in contrast to the ‘unhealthy’ confederate condition where only just over half the participants chose carrots.
One explanation for the present pattern of results is that in both the ‘choosing-alone’ condition and the ‘healthy’ confederate condition, there was a social norm operating to encourage the choice of at least some low-energy-dense foods from the buffet (i.e. meals should contain at least some healthy items even if these are not well liked). However, this norm may have been undermined in the ‘unhealthy’ confederate condition, leading participants to abandon the ‘healthy’ choice. In line with this, Croker et al. (Reference Croker, Whittaker and Cooke17) have previously reported that intentions to eat fruit and vegetables can be influenced by perceptions of the extent to which others eat fruit and vegetables. Hence, it is possible that the lack of the choice of low-energy-dense foods by the ‘unhealthy’ confederate led to the perception that it was acceptable to choose only high-energy-dense food items from the buffet. This suggests that the presence of an ‘unhealthy’ eating model may undermine attempts to consume some low-energy-dense foods, such as vegetables. These findings may be significant given that consumption of vegetables is known to convey health benefits and many people fail to consume the recommended amounts(Reference Lampe21).
Although participants in the ‘unhealthy’ confederate condition chose a lunch that was slightly higher in energy than the ‘healthy’ confederate and ‘choosing-alone’ conditions, we did not find a significant effect of condition on the total amount of energy chosen from the buffet, despite the fact that in the ‘unhealthy’ confederate condition, participants reduced their intake of carrots. This underlines the fact that, overall, we did not find a strong matching of choice to the confederate. Although we did observe a decrease in the choice of low-energy-dense items in the ‘unhealthy’ confederate condition, the lack of any energy differences suggests that the observed effect in the present study is relatively weak and may support Pliner and Mann's suggestion that food choice is influenced less by modelling than food intake tends to be. In addition, the amount of high-energy-dense foods chosen did not differ across the conditions; in the presence of the ‘healthy’ confederate, participants did not choose fewer high-energy-dense items than when eating alone. A possible reason for this is that participants choose their lunch mainly based on their usual preferences and intake(Reference Hermans, Herman and Larsen13). Hedonics and expected enjoyment of food are thought to be extremely important in food choice(Reference de Graaf, Kramer and Meiselman22). Thus, it may also be that as higher-energy-dense foods are well liked, any effect on choice will be harder to achieve, as individuals value at least part of their meal being hedonically pleasing and therefore less susceptible to the influence of another's choices.
We also found that participants who saw another person choosing predominantly low-energy-dense foods (‘healthy’ confederate condition) did not choose significantly more low-energy-dense foods than those in the choosing-alone condition. Similarly, previous work by Pliner & Mann(Reference Pliner and Mann12) showed that knowing that previous participants had chosen a ‘healthy’ cookie over a ‘creamy’ cookie did not increase choice for the healthy cookie. This raises a question of whether or not healthier food choices can be encouraged as a result of modelling. Although an increase in ‘healthy’ food items was not observed in the present study, modelling of food intake of healthy food items has previously been reported. For example, a confederate eating a large amount of vegetables resulted in participants consuming more vegetables(Reference Hermans, Larsen and Herman23). Children's preferences for vegetables have been shown to be influenced by a peer model(Reference Birch24), and Salvy et al. (Reference Salvy, Kieffer and Epstein25) reported that participants' consumption of healthy food items was predicted by whether the other participant in an eating dyad was also eating healthy snacks. It may be that the design of the present experiment did not facilitate such effects. It is possible that participants viewed the ‘healthy’ confederate's food choices as unusual due to the lack of energy density in the confederate's selected meal and did not model their behaviour. Alternatively, it may be that reducing the choice of low-energy-dense foods is easier than increasing the choice. Further research examining whether modelling could promote the choice of healthy food items is therefore warranted.
Further work examining how the food choice norms of friends, families and colleagues have an impact on attempts to constrain dietary choices to low-energy-dense foods would be of interest. Research has indicated that the type of relationship with an eating partner influences food selection and intake(Reference Salvy, Elmo and Nitecki14, Reference Clendenen, Herman and Polivy15), so it would be informative to examine whether healthy food choices might also be undermined by friends and acquaintances choosing to avoid such food items. It has also been argued that people are generally unaware of how external cues can influence their behaviour(Reference Vartanian, Herman and Wansink26). Thus, raising awareness of the effect others may have on adherence to low-energy-dense food choices and diets may be beneficial.
The present study is not without limitations. Our sample consisted of young women undergraduate students eating in a laboratory setting. Examining whether the present findings can be replicated with a wider age range and in men would be of interest. We also do not know how long the effect might be sustained or if they would occur in more natural settings. Different results might also be obtained depending upon the BMI of the confederate and the participant as has been found for social influences on food intake(Reference Hermans, Larsen and Herman27).
Conclusions
In the present study, we show that the presence of other people can influence food choices, although this effect is limited. Specifically, we provide evidence that an unhealthy eating partner may undermine the choice and consumption of ‘healthier’ low-energy-dense foods.
Acknowledgements
This study was funded by the University of Birmingham. We would like to thank Ruth Thompson, Karys Varker, Naheem Bashir, Beth Lock, Ellis Harris and Kadi Kraman for research assistance. The authors declare that there are no conflicts of interest. E. R. was responsible for the study design, data collection, analysis and preparation of the manuscript. S. H. was responsible for the study design, analysis and preparation of the manuscript.



