I. INTRODUCTION
Several types of transition metal carbides, borides, and nitrides that have melting temperatures exceeding 3000 °C are categorized as ultrahigh temperature ceramics (UHTCs). Reference Upadhya, Yang and Hoffman1–Reference Campbell and Sherwood4 These materials are also characterized with moderate to excellent oxidation resistance, high hardness, as well as a range in mechanical responses dependent upon their stoichiometry and the thermomechanical loading temperature. For example, tantalum carbides have been reported to exhibit ductility up to 33% with the deformation governed by the bonding type within the UHTC. Reference Steinitz5 De Leon et al. Reference De Leon, Wang, Weinberger, Matson and Thompson6 demonstrated how the local bond character within a UHTC unit cell regulates these slip systems that enables significant plasticity even in low symmetry crystals such as trigonal Ta2C. More recent work has shown how the availability of outer shell electrons in equivalent crystal structures modifies the preferred slip planes in determining the energy hierarchy for deformation. Reference De Leon, Yu, Yu, Weinberger and Thompson7
ZrB2 has received considerable attention because of its high hardness, relatively low density, and superior oxidation resistance in extreme environments. Reference Opeka, Talmy, Wuchina, Zaykoski and Causey8 Consequently, this boride has been proposed as a candidate material for cutting tools, Reference Murata9 armor applications, structural materials for hypersonic vehicles, Reference Paul, Jayaseelan, Venugopal, Zapata-Solvas, Binner, Vaidhyanathan, Heaton, Brown and Lee10 and even electrodes. Reference Norasetthekul, Eubank, Bradley, Bozkurt and Stucker11 Its high hardness is likely enhanced by its hexagonal P6/mmm symmetry, which limits the number of independent slip systems, coupled with its strong and directional covalent bonds within the unit cell. Consequently, ZrB2 is often associated with being a very hard but brittle UHTC.
Interestingly, there are reports that ZrB2 can nucleate a number of dislocations at room temperature under confined pressure despite its brittle behavior. Ghosh et al. Reference Ghosh, Subhash and Bourne12 indented polycrystalline ZrB2 and noted a dense network of dislocations under the indent. Three separate slip lines were observed which occurred at 60° angles from each other indicating pyramidal slip. Others have noted changes in ZrB2's mechanical strength with temperature. For example, Neuman et al. Reference Neuman, Hilmas and Fahrenholtz13 reported an approximately 50% decrease in flexural strength near 1200 °C which could be related to residual stress relaxation. Reference Watts, Hilmas, Fahrenholtz, Brown and Clausen14 To date, there has not been a substantial investigation of possible changes in dislocation activity, which could also contribute to this dramatic change in strength, such as a brittle-to-ductile transition with temperature where thermal activation is sufficient to activate bulk plasticity. The competing mechanism to plastic deformation is fracture, which is strongly dependent on the nature and distribution of flaws that can be processed in a material. The relationship between processing, material properties such as fracture toughness and brittle fracture, are important but are beyond the scope of this current investigation, which is to identify the types of dislocations that are active in ZrB2. Since the coupling between bulk plasticity (at elevated temperatures) and fracture ultimately determines the performance of a system, it is critical to also understand when and how bulk plasticity is activated in these materials including the number and type of activated slip systems as a function of temperature.
A review of the literature does suggest some discrepancies in which slip systems dominate in ZrB2. Haggerty and Lee performed conventional dynamical imaging using transmission electron microscopy (TEM) of single crystals of ZrB2 tested in compression at 2125 °C. Reference Haggerty and Lee15 They observed slip lines consistent with basal slip. However, as previously mentioned above, Ghosh et al. Reference Ghosh, Subhash and Bourne12 reported pyramidal slip. Nonetheless, such comparisons are difficult as both the loading stress states and temperature conditions between these two studies are different and confound the conditions for which systems may be activated.
Looking at comparative group IVB transition metal diborides, similar differences in the reported dominant slip system exists. Ramberg and Williams analyzed the fracture surface of TiB2 and concluded that basal and prismatic slip occurred using the von Mises criterion. Reference Ramberg and Williams16 They also believed pyramidal slip could be present but this was not definitively found in their investigation. In contrast, Guo et al. Reference Guo17 noted nonbasal slip in TiB2 subjected to hypervelocity impacts but they did not identify any specific deformation plane. In HfB2, Nakano et al. Reference Nakano, Matsubara and Imura18 reported basal and prismatic slip in their hardness anisotropy tests with Vahldiek and Mersol Reference Vahldiek and Mersol19 noting similar findings using microhardness tests. They concluded that the primary slip mechanism in HfB2 was prismatic with the secondary mechanism being basal. Most recently, Zhang et al. Reference Zhang, Luo, Han, Li and Han20 performed a series of first principle calculations to broadly understand the elasticity and hardness in HfB2 and ZrB2, however no major efforts were made to categorize the energetics of slip.
In the present work, we examine two different ZrB2 bars subjected to flexural testing at 1000 °C and 1500 °C. These two temperatures represent the conditions between the high and low flexural strength noted in the prior Neuman et al. Reference Neuman, Hilmas and Fahrenholtz13 study. The materials studied here were taken from that prior report. Using dynamical imaging TEM methods, we quantify the slip systems to definitely determine the dislocation mechanisms and the primary mode of slip at each temperature to determine if a temperature dependence dislocation behavior could have occurred to account for the change in flexural strength. These findings are then coupled to a generalized stacking fault energy (GSFE) computation study to glean insights into the dominant slip systems found in ZrB2. The results are given to provide more insight in what governs the plasticity mechanisms found in this very hard, brittle ceramic.
II. MATERIALS AND EXPERIMENTAL METHODS
A. Sample fabrication and mechanical testing
Two separate ZrB2 samples were fabricated from commercial, constituent starting powder (Grade B, H.C. Starck, Newtown, MA). The ZrB2 powder was dispersed in hexane by milling for 24 h with WC-Co media. The slurry was then dried by rotary evaporation. Next, phenolic resin (Type GP 2074, Georgia Pacific, Atlanta, GA; char yield 43 wt% carbon) was dissolved in acetone with the milled ZrB2 powder added and dispersed by ultrasonication. The resulting slurry was then again dried by rotary evaporation and subsequently passed through a 50 mesh screen.
Powders were densified by hot pressing (HP50-7010G, Thermal Technology, Santa Rosa, CA) in graphite dies that were lined with graphite paper and coated with BN. The hot press was heated at 5 °C/min to 800 °C under a flowing atmosphere of argon/10% hydrogen. At 800 °C, the furnace chamber was evacuated to ∼15 Pa and heated at 10 °C/min to 1600 °C. During that heating, isothermal holds were used to allow carbon to react with surface oxide impurities and form volatile species. The isothermal holds were two hours at 1250 °C, two hours at 1450 °C, and one hour at 1600 °C. Above 1600 °C, the furnace was backfilled with helium to ambient pressure and a uniaxial load of 32 MPa was applied. The furnace was heated at 20 °C/min to 2150 °C and held for 1 h followed by cooling at ∼20 °C/min. The uniaxial load was removed at about 1600 °C. All of the materials were >99% dense. The sintered samples were then machined into 45 mm × 4 mm × 3 mm test bars for flexural testing.
With the bars prepared, a minimum of five bars were four point flexural tested at each temperature condition using the ASTM C1211-08 standard procedure for testing in an Instron 33R4204 load frame. A graphite furnace was placed on this frame to provide the temperature at the load condition.
Further information on the preparation and testing of the flexural samples can be found in Ref. Reference Neuman, Hilmas and Fahrenholtz13.
B. Materials characterization
TEM foils were taken from each flexural bar by cutting a sectional piece from the mid-point deflection region. This region of interest would contain the highest amount of intrinsic deformation accommodated by the bars during testing. The foils were prepared by ultrasonically cutting 3 mm diameter discs from the sectioned material, grinding the discs to a thickness of approximately 100 µm, dimple polishing the centric region to approximately 10 µm thickness, and then Ar ion polishing using a Gatan Precision Ion Polisher (PIPS; Gatan Inc., Pleasanton, California) until perforation to reveal electron transparent regions around the perforated holes. The TEM foils were then characterized in a FEI Tecnai F20 (S)TEM operated at 200 keV (FEI Company, Eindhoven, Netherlands).
The test bar material was also characterized by scanning electron microscopy (SEM)—electron backscattered diffraction (EBSD) on a JEOL 7000F (JEOL Ltd., Peabody, Massachusetts). The SEM samples were prepared by cutting a small section of the test bar near the centric region which was mounted in conductive Bakelite epoxy and metallographically polished to a 0.05 µm finish. The EBSD confirmed the phase content as well as grain size for each sample.
C. Computational methods and models
The density functional theory (DFT) calculations were carried out by the plane-wave based Vienna ab initio simulation package Reference Kresse and Joubert21,Reference Kresse and Furthmüller22 using the projector augmented wave method Reference Kresse and Joubert21,Reference Blöchl23 and the generalized gradient approximation in the parametrization by Perdew et al. Reference Perdew, Burke and Ernzerhof24 Plane waves were included up to a cutoff energy of 600 eV, which yielded converged results. The convergence accuracy of the total energy was chosen as 10−5 eV in the relaxation of electronic degrees of freedom. The structures of the models were relaxed until the maximum force was less than 0.02 eV/Å. We used the Monkhorst–Pack scheme for k-point sampling. Reference Monkhorst and Pack25 To eliminate the interactions of parallel faults, we introduced a vacuum region of 15 Å to separate the parallel faults.
III. RESULTS AND DISCUSSION
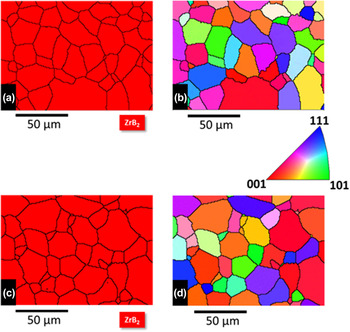
Based on the prior report by Neuman et al., Reference Neuman, Hilmas and Fahrenholtz13 the sample at 1000 °C exhibited a flexural strength near 390 MPa whereas the 1500 °C had a value near 110 MPa. Since mechanical responses can be a function of grain size, texture, and phase, EBSD was done to quantify if one or more of these factors contributed to the change in flexural strength. These results are shown in Fig. 1. The grains were observed to be equiaxed with sizes of 17.1 ± 8.2 µm (1000 °C) and 15.6 ± 9.4 µm (1500 °C). Though the average grain size is slightly smaller for the higher temperature sample, where one could expect some grain growth, each grain size was within the error range of the other indicating no significant deviation. We also note that in prior ZrB2 work, grain coarsening was observed at temperatures greater than approximately 1800 °C, Reference Neuman, Hilmas and Fahrenholtz26,Reference Neuman, Hilmas and Fahrenholtz27 which is higher than the temperatures studied here and would be consistent with those prior findings. Both samples also revealed a random polycrystalline texture orientation within the sample evident by the multiple colors for each grain compared to the inset inverse pole figure. Finally, the ZrB2 phase was found to be the only phase throughout each sample with no macroscopic flaws observed. Collectively, the equal grain size and shape, polycrystalline texture, and equivalent phase indicate that these microstructure factors could not account for the flexural strength differences. This raises the important question of how plasticity contributes to the differences in the deformation and fracture strength of these materials.
EBSD images showing phase content and grain orientation for (a and b) 1000 °C and (c and d) 1500 °C.

To determine the slip systems present in the two different ZrB2 samples tested, dynamical diffraction imaging using a two-beam imaging conditions was used. Reference Williams and Carter28 Figures 2(a) and 2(b) show representative visible and invisible conditions for dislocations in the sample tested at 1000 °C. In general, these dislocations were long and straight suggestive of relatively high lattice resistance, which one expects in a strongly covalently bonded material like ZrB2. A line intercept method Reference Ham29 using Eq. (1) was used to estimate the dislocation density, ρ, in the visible condition.
 $$\rho = {{2N} \over {Lt}}\quad ,$$
where N is the number of random line intersections occurring through length L with t being the thickness of the foil. The 1000 °C test bar had an estimated dislocation density of 1.3 × 10¹³ m−2. In comparison, for highly deformable materials, such as a cold rolled metal, ρ values are ∼1014–15 m−2. Reference Hull, Bacon, Hull and Bacon30 The lower density of dislocations, particularly at the region of most flexural deformation, again suggests limited plasticity and confirms that ZrB2 is a hard and brittle material. In the prior report by Ghosh et al., Reference Ghosh, Subhash and Bourne12 where significant dislocations were observed under the indent, it is indicative that dislocation nucleation in ZrB2 must be highly sensitive to confined deformation where such confined pressure introduced in indentation likely helps suppress fracture and thus enhances plasticity.
TEM images of a dislocation group for test bar at 1000 °C in (a) visible condition at
 $g = \left[ {\bar 1010} \right]$
and (b) invisible condition at
 $g = \left[ {000\bar 1} \right]$
.

Through the use of both dynamical two-beam conditions for either visible or invisible defect imaging, the Burgers' vector and slip plane for the dislocations circled in Fig. 2 were ascertained.
Reference Williams and Carter28
The invisible conditions were observed with diffraction vectors,
 $\vec g{\rm{'s}}$
, of
 $\left[ {000\bar 1} \right]$
,
 $\left[ {0001} \right]$
, and
 $\left[ {1\bar 10\bar 1} \right]$
indicating that the Burgers vector for these dislocations was
 ${1 \mathord{\left/ {\vphantom {1 3}} \right. \kern-\nulldelimiterspace} 3}\left[ {11\bar 20} \right]$
and it was found to reside on the
 $\left( {1\bar 10\bar 1} \right)$
slip plane.
Another set of dislocations in the 1000 °C sample are shown in Fig. 3. These dislocations, which had a similar dislocation density as the previous sample, exhibited a different character than the previously discussed dislocations found in the same grain. These dislocations were only visible when viewed with a
 $\vec g$
 $\left( {000\bar 1} \right)$
, Fig. 3(a), and invisible with
 $\vec g$
 $\left[ {\bar 1010} \right]$
, Fig. 3(b). The Burgers vector was determined to be
 ${1 \mathord{\left/ {\vphantom {1 3}} \right. \kern-\nulldelimiterspace} 3}\left[ {0001} \right]$
on the
 $\left( {\bar 1010} \right)$
plane or these dislocations had prismatic slip. Though prior research has found basal slip in ZrB2,
Reference Haggerty and Lee15
we were unable to identify this slip system in the other dislocations observed within this foil. This does not preclude their presence, but the low dislocation density made further searching for them particularly difficult. The lack of readily observing basal slip is suggestive that it is not the primary slip mechanism at this temperature. The presence of both pyramidal and prismatic slip noted here is in agreement with the prior room temperature indentation studies of Ghosh et al.
Reference Ghosh, Subhash and Bourne12
where these same systems, and an absence of basal slip, were found.
Dislocation group for test bar at 1000 °C in (a) visible condition at
 $g = \left[ {000\bar 1} \right]$
and (b) invisible condition at
 $g = \left[ {\bar 1010} \right]$
.

Figure 4 shows the TEM two-beam imaging conditions for dislocations observed in the 1500 °C sample. Again, the dislocations were long and straight indicating that the increase in temperature appears, at least qualitatively, to provide little to no change in the dislocation shape as compared to the 1000 °C sample. These higher temperature dislocations were visible in the
 $\left[ {10\bar 1\bar 1} \right]$
two beam condition and invisible for the
 $\left[ {1\bar 101} \right]$
,
 $[\bar 1102]$
, and
 $[2\bar 20\bar 1]$
imaging conditions. The identified Burgers vector was
 ${1 \mathord{\left/ {\vphantom {1 3}} \right. \kern-\nulldelimiterspace} 3}\left[ {11\bar 20} \right]$
on the
 $\left( {0001} \right)$
basal plane. Investigation of the other dislocations found in this foil was also indexed to basal slip. Surprisingly, prismatic and/or pyramidal slip was not observed as previously measured in the lower temperature sample. The dislocation density for this foil was found to be approximately 1.0 × 10¹³ m−2. As before, the low dislocation density made searching for other types of dislocations difficult. However, the presence of both prismatic and pyramidal slip at lower temperatures would suggest that they too would be active at elevated temperatures but were simply not found. The now identified presence of basal slip in the higher temperature sample is consistent with Haggerty and Lee's
Reference Haggerty and Lee15
findings where a change in prismatic slip to basal slip occurred with increasing temperature.
Dislocation group for test bar at 1500 °C in (a) visible condition at
 $g = \left[ {10\bar 11} \right]$
and (b) invisible condition at
 $g = \left[ {\bar 1101} \right]$
.

To obtain a better understanding of how temperature may alter slip systems through the energetics of slip, the GSFE curves between different crystallographic planes were computed and compared. Our results, as well as those reported in literature, suggest that different slip systems are potentially active at different temperatures. The GSFE curves should then provide the energetic hierarchy for each of these slip systems. However, it is important to realize that at the atomic level, one has to consider the bonding across specific slip planes in addition to the crystallographic slip planes and directions, as shown in Fig. 5. For example, in the
 $\left\langle {0001} \right\rangle \left\{ {10\bar 10} \right\}$
prismatic plane, Fig. 5(b), one slip plane exists between the Zr–B layers while another exists between the B–B layers. This type of chemical bonding asymmetry has been previously noted in Ta2C,
Reference De Leon, Wang, Weinberger, Matson and Thompson6
in which the reduction in crystallographic symmetry resulted in differences in GSFE surfaces though similar hkl family indices were present. In addition to simple bonding asymmetry, the spacing between asymmetrically bonded planes may also contribute to differences. Figure 5(c) illustrates the different bonding between planes with dramatically different interplanar spacings on the
 $\left( {10\bar 11} \right)$
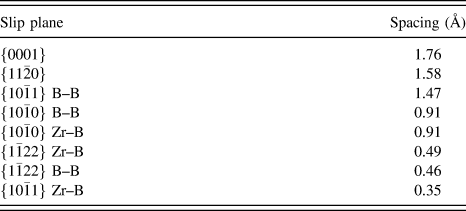
pyramidal planes. Table I is a tabulation of the various interplanar spacings found in this system.
The structure of ZrB2 and the slip planes investigated in this paper. The larger (grey) spheres represent the Zr atoms and the smaller (black) spheres represent B. (a) The hexagonal structure of ZrB2 Illustrating the two types of dislocations considered. The only one not specifically called out is the basal plane and has a spacing of c/2 in the z-direction. (b) The
 $\left\{ {0001} \right\}$
plane projection highlighting the two
 $\left\{ {10\bar 10} \right\}$
type slip planes within the two bonding environments. (c) There is only a single type of
 $\left\{ {11\bar 20} \right\}$
prismatic plane with a single spacing of a/2. (d) The two types of
 $\left\{ {10\bar 11} \right\}$
pyramidal planes in ZrB2, which exhibit strong asymmetry in spacing. The examination of higher order pyramidal planes, e.g.,
 $\{ 11\bar 22\}$
, exhibit much smaller spacing (see Table II).

Interplanar spacing for ZrB2 listed in order of decreasing spacing.
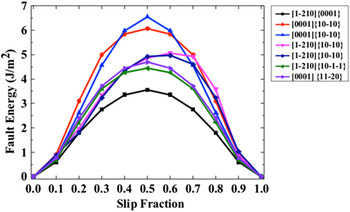
Using these geometric considerations, we now compared them to the GSFE values for perfect slip, as plotted in Fig. 6 for the following four sets of planes: the basal
 $\left\{ {0001} \right\}$
, prismatic
 $\left\{ {10\bar 10} \right\}//\left\{ {11\bar 20} \right\}$
, and pyramidal
 $\left\{ {10\bar 1\bar 1} \right\}$
. Note that all of these are the prior slip planes (except the
 $\left\{ {11\bar 20} \right\}$
) for this system.
The GSFE curves computed from DFT for the different slip systems in ZrB2. The lowest reported slip energy is basal slip followed by pyramidal slip, both in the 〈a〉 direction.

Based on the computational results, Fig. 6, 〈a〉 type basal slip
 $\left\{ {0001} \right\}$
is the easiest a-type slip system to activate energetically followed by the pyramidal
 $\left\langle {1\bar 210} \right\rangle \left\{ {10\bar 1\bar 1} \right\}$
and both the prismatic
 $\left\langle {11\bar 20} \right\rangle \left\{ {10\bar 10} \right\}$
slip systems. In comparison with other work,
Reference De Leon, Wang, Weinberger, Matson and Thompson6
the Ta2C system revealed significant differences between the Ta–C and Ta–Ta bonds in the asymmetric planar configurations. This is contributed to both the interplanar spacing as well as one type being either more covalent or metallic. In ZrB2, the Zr–B and B–B bonds both favor covalence with each species and thus appears not to play a strong role. This is very evident in the GSFE curves of
 $\left\{ {10\bar 10} \right\}$
prismatic slip in which both B–B and Zr–B planes exist with equivalent spacing and nearly identical GSFE curves.
The highest slip energetics calculated in our simulations are associated with 〈c〉 type dislocations on the
 $\left\{ {10\bar 10} \right\}$
prism plane, as could be generally expected. The 〈c〉 type slip is much less energetically favorable but can help in increasing the number of plastic degrees of freedom accommodated by plastic deformation and explain why it readily appeared in these experimental results as well as others.
Reference Ghosh, Subhash and Bourne12,Reference Haggerty and Lee15
What is less obvious is that the
 $\left\{ {10\bar 11} \right\}$
prism plane is the observed c-slip plane while the
 $\left\{ {11\bar 20} \right\}$
plane has a significantly lower GSFE curve and has a much wider interplanar spacing. This suggests that slip will not always simply follow the lowest GSFE curves and that the potential planes on which the dislocations can form is important. It is worth noting that while the
 $\left\{ {10\bar 10} \right\}$
prism plane has a larger energy barrier to slip, it is also the slip plane that contains a
 $\left\langle {11\bar 20} \right\rangle$
type dislocation Burgers' vector and the preference to slip on this plane may be associated with the ability of typical a-type slip on this slip plane. It is also important to add that this type of prism slip is also always associated with
 $\left\{ {10\bar 11} \right\}$
slip, further suggesting that dislocation interactions may be key in understanding the preference of 〈c〉 type slip on prism planes. The asymmetry in spacing between the
 $\left\{ {11\bar 20} \right\}$
and
 $\left\{ {10\bar 10} \right\}$
planes, which creates this quandary, is a direct consequence of the packing of the boron atoms on the basal plane not seen in other hexagonal close packed (HCP) metals. Further work in this area may be able to reveal why slip is preferred on this plane.
While the GSFE curves computed by DFT give an absolute value to the energetics of slip, our understanding can be further enhanced by making connections directly back to geometry. First, we can compare the GSFE with direct geometric calculations of interplanar spacings found in Table I. We note the basal plane has the widest spacing and the lowest GSFE. In fact, in looking at <a> type slip, the closer the planes are spaced, the larger the GSFE value becomes, providing an excellent agreement between DFT and these simple geometric comparisons. Furthermore, the Zr–B
 $\left\{ {10\bar 11} \right\}$
plane is very closely spaced and should not be active for slip. This was similarly noted for the second order pyramidal planes
 $\left\{ {11\bar 22} \right\}$
being closely spaced and thus not be active. These interplanar spacing arguments suggest that we have correctly identified the most widely spaced planes in our simulations as the most likely to slip; all of which matches the experimental observations.
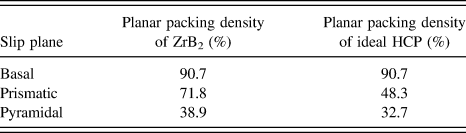
Arguments regarding planar packing density can also be made with the larger packing density being the more favored slip plane as described by the number of representative atoms that lie in the area for that specific plane. Table II is the planar packing density, based on a ZrB2's c/a ratio of 1.11 as compared to the ideal HCP c/a ratio of 1.63, for the three slip planes identified. (Note c and a are the representative lattice parameters.) For the basal plane, the packing density is equivalent, with a relatively small increase for the pyramidal planes. However, the prismatic planes have a nearly 50% increase in packing density from the ideal ratio. In general, dislocations slip in the direction of the shortest Burgers vector to minimize the strain energy on the planes that are the furthest spaced apart. This dramatic increase in pyramidal planar packing densities may also help to explain why nonbasal modes of slip potentially become more favorable at the lower temperatures. The dramatic change in the prismatic packing density would clearly favor such slip as the c-axis is reduced.
Planar packing densities for ZrB2 and ideal HCP along three planes.
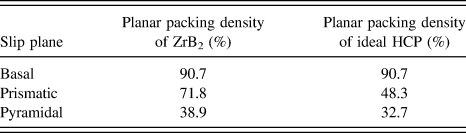
The lack of a significant dislocation density difference between the two temperature regimes, coupled with the highest GSFE barrier slip system in the lowest temperature sample, provide physical mechanism confirmation of the hard and brittle nature of this ceramic. In the prior flexural strength tests of this ceramic, a nearly 50% reduction in strength was noted near 1200 °C. Reference Neuman, Hilmas and Fahrenholtz13 From these experimental results, it is apparent that this decrease cannot be significantly associated with a change in dislocation activity. Rather, the change in flexural stress appears to be dominated by some form of stress relaxation within the material whose mechanism still requires further investigation. Reference Watts, Hilmas, Fahrenholtz, Brown and Clausen14
IV. CONCLUSION
ZrB2 is a UHTC material noted for its high hardness and brittleness. In this study, the slip systems for both 1000 °C and 1500 °C flexural condition were quantified. Former reports have shown a nearly one-half reduction in flexural strength between these two temperatures. However, the dislocation structure (long and straight lines) and density, ∼1013 m−2, were nearly equivalent between both samples indicating that a dislocation based mechanism is not the primary reason for the flexural strength reduction and likely contributed to thermally assisted residual stress relaxation. Also, these features—dislocation shape and density—confirm a material with very low plastic deformation capability consistent with its macroscopic hard and brittle attributes.
The lower temperature sample had both prism slip—
 ${1 \mathord{\left/ {\vphantom {1 3}} \right. \kern-\nulldelimiterspace} 3}\left[ {0001} \right]\left( {\bar 1010} \right)$
—and pyramidal slip—
 ${1 \mathord{\left/ {\vphantom {1 3}} \right. \kern-\nulldelimiterspace} 3}\left[ {11\bar 20} \right]\left( {\bar 1101} \right)$
. The elevated temperature sample revealed basal slip—
 ${1 \mathord{\left/ {\vphantom {1 3}} \right. \kern-\nulldelimiterspace} 3}\left[ {11\bar 20} \right]\left( {0001} \right)$
. The lack of either types of slip at the other temperature does not preclude their existence at those temperatures; however, the low dislocation density made it difficult to find and identify those dislocations. The presence of the prismatic slip, which has the highest GSFE, at the lowest temperature studied is suggestive that the activation barrier is not a hindrance for the temperatures studied and is likely activated to increase the number of plastic degrees of freedom.
The hierarchy of slip was explained by inter-planar spacing, packing densities as well as GSFE computed curves for each slip system. Though the prismatic slip has the largest increase in planar packing by the reduction of the c-axis in ZrB2, the basal packing's absolute value is still larger with the largest inter-planar spacing and lowest GSFE. All of which indicates that basal slip should be dominant. However,
 $\left\{ {10\bar 11} \right\}$
and
 $\left\{ {11\bar 20} \right\}$
slips have similar energies, and not that much higher energy values than basal indicating that grain orientations and deformation paths may be more important for determining the limited slip that occurs in these materials.
ACKNOWLEDGMENTS
BH, XXY, ND, and GBT gratefully acknowledge AFOSR-FA9550-15-1-0095 for support of this work. CRW recognizes AFOSR-FA9550-15-1-0217 for additional support. The specimens were produced through AFOSR contract FA9550-09-1-0168.