1 Introduction
Velocity-space anisotropy-driven instabilities capable of generating strong quasi-static magnetic fields are frequent in many frameworks of plasma physics, ranging from astrophysical plasmas to laboratory laser–plasma interactions. Expressions such as ‘Weibel-type’ or ‘Weibel-like’ are frequently used as generic names for these instabilities. Examples are the pure Weibel instability (WI) driven by a temperature anisotropy (Weibel Reference Weibel1959) or beam–plasma instabilities like the current filamentation instability (CFI), generated by a linear momentum anisotropy (Fried Reference Fried1959). The latter usually requires a perturbation with a wave vector orthogonal to the beams. However, beam–plasma systems, in nature, are more generally destabilised by oblique (with respect to the beams) wave vectors, so that classical Weibel instabilities are often in competition with the electrostatic two-stream instability (TSI) or the oblique instability (Bret, Firpo & Deutsch Reference Bret, Firpo and Deutsch2005; Bret, Gremillet & Dieckmann Reference Bret, Gremillet and Dieckmann2010) depending on the symmetry properties of the beams and on their velocity (relativistic or not). Therefore, the family of Weibel-type instabilities includes also phenomena resulting from the combination of these two types of velocity anisotropies, such as the Weibel–CFI coupled modes or the time-resonant Weibel instability (TRWI). The latter, investigated in Lazar et al. (Reference Lazar, Schlickeiser, Wielebinski and Poedts2009), Lazar, Dieckmann & Poedts (Reference Lazar, Dieckmann and Poedts2010) and Ghorbanalilu et al. (Reference Ghorbanalilu, Sadegzadeh, Ghaderi and Niknam2014), is triggered by an excess of thermal energy perpendicular to the direction of the electron beams and is a time resonant, i.e. propagating instability. At relativistic speeds, the oblique and CFI instabilities are dominant (Bret et al. Reference Bret, Gremillet and Dieckmann2010), whereas in the non-relativistic regime the TRWI grows faster than the TSI (Lazar et al. Reference Lazar, Schlickeiser, Wielebinski and Poedts2009), the oblique and the CFI.
In this article we focus on configurations with perturbations propagating along the beams, so that only the TRWI and the TSI can be excited. This simplification is a preliminary step to next applying the fluid model, including a full pressure tensor dynamics, first investigated by Basu (Reference Basu2002) and Sarrat, Del Sarto & Ghizzo (Reference Sarrat, Del Sarto and Ghizzo2016) for wave vectors perpendicular to the beams, to the case of perturbations with generic oblique propagation. These modes affect the stability and the dynamics of (counterstreaming) electron beams, which in the non-relativistic regimes can be generated, e.g. in the nonlinear stage of three-wave parametric decays, such as Raman-type instabilities in laser–plasma interactions (Masson-Laborde et al.
Reference Masson-Laborde, Rozmus, Peng, Pesme, Hller, Casanova, Bychenkov, Chapman and Loiseau2010). In stimulated Raman scattering as well as in self-focusing processes, indeed, Vlasov (Ghizzo, Huot & Bertrand Reference Ghizzo, Huot and Bertrand2003; Ghizzo et al.
Reference Ghizzo, Del Sarto, Réveillé, Besse and Klein2007) and Particle-In-Cell (PIC) (Denavit Reference Denavit1992; Guérin et al.
Reference Guérin, Mora, Adam, Hron and Laval1996) simulations evidence kinetic heating processes which are anisotropic along or perpendicular to the electromagnetic wave propagation direction. Estimating that relativistic effects become quantitatively important when electron kinetic energy is comparable to (or stronger than) their rest energy
 $mc^{2}\sim 511$
keV,
 $m$
and
 $c$
being respectively the electron mass and the speed of light in the vacuum (see e.g. Lazar et al.
Reference Lazar, Schlickeiser, Wielebinski and Poedts2009), a non-relativistic description of Weibel modes may be, at least qualitatively, of interest even to moderately relativistic interpenetrating intergalactic plasmas. The future extension of this model to relativistic regimes will allow broader applications to both astrophysics and high-intensity laser–plasma interactions (Medvedev & Loeb Reference Medvedev and Loeb1999; Schlickeiser & Shukla Reference Schlickeiser and Shukla2003; Bret et al.
Reference Bret, Stockem, Narayan and Silva2014).
A complete description of these Weibel-type instabilities requires the use of kinetic theory. Nevertheless, fluid model has demonstrated the ability to identify and understand some of their main features. Fried (Reference Fried1959) gave a fluid picture of the pure WI, introducing the concept of CFI: the electron temperature anisotropy is replaced by a momentum anisotropy of two counterstreaming electron beams and the strong anisotropy limit of Weibel’s kinetic dispersion relation is then recovered, setting up an analogy between these two driving mechanisms. This approach opened the way to the use of cold fluid models in order to study the linear phase of the relativistic and non-relativistic CFI (Pegoraro et al. Reference Pegoraro, Bulanov, Califano and Lontano1996), possibly in presence of spatial resonances effects (Califano, Pegoraro & Bulanov Reference Califano, Pegoraro and Bulanov1997; Califano et al. Reference Califano, Prandi, Pegoraro and Bulanov1998), and some features of its nonlinear dynamics such as the onset of secondary magnetic reconnection processes (Califano et al. Reference Califano, Attico, Pegoraro, Bertin and Bulanov2001), or the coupling with the TSI in a three-dimensional, spatially inhomogeneous configuration (Califano, Del Sarto & Pegoraro Reference Califano, Del Sarto and Pegoraro2006).
These cold models are unable to reproduce important results derived from a full kinetic treatment, for example the partially electrostatic behaviour of the CFI when the beams have unequal temperatures (Tzoufras et al. Reference Tzoufras, Ren, Tsung, Tonge, Mori, Fiore, Fonseca and Silva2006; Bret, Gremillet & Bellido Reference Bret, Gremillet and Bellido2007). Reduced kinetic models, instead, such as those based on the evolution of waterbag or multistream distributions (Inglebert et al. Reference Inglebert, Ghizzo, Réveillé, Bertrand and Califano2012), successfully describe these kinetic features. The multistream model, in particular, deals with Fried’s analogy in depth by sampling the distribution function with a bunch of parallel beams, taking advantage of the potential cyclic variables of the problem (Inglebert et al. Reference Inglebert, Ghizzo, Réveillé, Del Sarto, Bertrand and Califano2011; Ghizzo & Bertrand Reference Ghizzo and Bertrand2013; Ghizzo, Sarrat & Del Sarto Reference Ghizzo, Sarrat and Del Sarto2016).
The fluid model we here consider, extended to include the full pressure tensor dynamics, can be compared to a reduced kinetic model. The possibility of using such a model in order to investigate Weibel instabilities was first addressed by Basu (Reference Basu2002), who recovered the hydrodynamic limit of the pure WI kinetic dispersion relation. This description has been recently generalised to the thermal CFI and WI–CFI modes in a system of counterstreaming beams (Sarrat et al. Reference Sarrat, Del Sarto and Ghizzo2016), and it is here applied to study the onset of the TRWI. Besides resulting consistent with the kinetic description, this fluid analysis allows us to characterise the transition between time-resonant and non-time-resonant regimes of the instability and makes possible the identification of a second, although non-dominant, unstable branch. The purpose of this article is to discuss these points by evidencing the consistency between the full kinetic and this extended fluid description, and the usefulness of the latter in highlighting some features otherwise more difficult to recognise in a full kinetic setting.
The paper is structured as follows. In § 2, we present the model equations and the equilibrium configuration. In § 3, we perform a linear analysis for waves propagating along the beams and obtain the corresponding dispersion matrix. In § 4, we identify the hydrodynamic limit for which both the fluid and kinetic approaches are strictly equivalent. In this limit, we put in evidence the TRWI regime. In § 5 we detail the analysis of the fluid dispersion relation and use it to isolate some kinds of behaviour of the TRWI and to characterise the transition between the resonant and the non-resonant regimes.
2 The fluid model
2.1 Model equations
We consider two non-relativistic counterstreaming electron beams (
 $\unicode[STIX]{x1D6FC}=1,2$
) in a hydrogen plasma at time scales
 $\unicode[STIX]{x0394}t\lesssim \unicode[STIX]{x1D714}_{pi}^{-1}$
, where
 $\unicode[STIX]{x1D714}_{pi}$
is the ion plasma frequency. Consequently, the ions form a neutralizing equilibrium background, with a uniform and constant density
 $n_{i}$
, whose dynamics will be neglected in the following. We write the first three moments of Vlasov equation for each beam (see e.g. Del Sarto, Pegoraro & Tenerani Reference Del Sarto, Pegoraro and Tenerani2017):
 $$\begin{eqnarray}\displaystyle & \displaystyle \frac{\unicode[STIX]{x2202}n_{\unicode[STIX]{x1D6FC}}}{\unicode[STIX]{x2202}t}+\unicode[STIX]{x1D735}\boldsymbol{\cdot }(n_{\unicode[STIX]{x1D6FC}}\boldsymbol{u}_{\unicode[STIX]{x1D6FC}})=0, & \displaystyle\end{eqnarray}$$
 $$\begin{eqnarray}\displaystyle & \displaystyle \frac{\unicode[STIX]{x2202}\boldsymbol{u}_{\unicode[STIX]{x1D6FC}}}{\unicode[STIX]{x2202}t}+\boldsymbol{u}_{\unicode[STIX]{x1D6FC}}\boldsymbol{\cdot }\unicode[STIX]{x1D735}\boldsymbol{u}_{\unicode[STIX]{x1D6FC}}=-\frac{e}{m}(\boldsymbol{E}+\boldsymbol{u}_{\unicode[STIX]{x1D6FC}}\times \boldsymbol{B})-\frac{\unicode[STIX]{x1D735}\boldsymbol{\cdot }\unicode[STIX]{x1D72B}_{\unicode[STIX]{x1D6FC}}}{mn_{\unicode[STIX]{x1D6FC}}}, & \displaystyle\end{eqnarray}$$
 $$\begin{eqnarray}\displaystyle & & \displaystyle \frac{\unicode[STIX]{x2202}\unicode[STIX]{x1D72B}_{\unicode[STIX]{x1D6FC}}}{\unicode[STIX]{x2202}t}+\unicode[STIX]{x1D735}\boldsymbol{\cdot }(\boldsymbol{u}_{\unicode[STIX]{x1D6FC}}\unicode[STIX]{x1D72B}_{\unicode[STIX]{x1D6FC}})+\unicode[STIX]{x1D735}\boldsymbol{u}_{\unicode[STIX]{x1D6FC}}\boldsymbol{\cdot }\unicode[STIX]{x1D72B}_{\unicode[STIX]{x1D6FC}}+(\unicode[STIX]{x1D735}\boldsymbol{u}_{\unicode[STIX]{x1D6FC}}\boldsymbol{\cdot }\unicode[STIX]{x1D72B}_{\unicode[STIX]{x1D6FC}})^{\text{T}}\nonumber\\ \displaystyle & & \displaystyle \quad =-\frac{e}{m}(\unicode[STIX]{x1D72B}_{\unicode[STIX]{x1D6FC}}\times \boldsymbol{B}+(\unicode[STIX]{x1D72B}_{\unicode[STIX]{x1D6FC}}\times \boldsymbol{B})^{\text{T}})-\unicode[STIX]{x1D735}\boldsymbol{\cdot }\unicode[STIX]{x1D618}_{\unicode[STIX]{x1D6FC}},\end{eqnarray}$$
where apex ‘T’ expresses matrix transpose. We define the pressure tensor
 $\unicode[STIX]{x1D72B}_{\unicode[STIX]{x1D6FC}}\equiv n_{\unicode[STIX]{x1D6FC}}m(\langle \boldsymbol{v}\boldsymbol{v}\rangle _{\unicode[STIX]{x1D6FC}}-\boldsymbol{u}_{\unicode[STIX]{x1D6FC}}\boldsymbol{u}_{\unicode[STIX]{x1D6FC}})$
and the heat flux tensor
 $\unicode[STIX]{x1D618}_{\unicode[STIX]{x1D6FC}}\equiv mn_{\unicode[STIX]{x1D6FC}}\langle (\boldsymbol{v}-\boldsymbol{u}_{\unicode[STIX]{x1D6FC}})(\boldsymbol{v}-\boldsymbol{u}_{\unicode[STIX]{x1D6FC}})(\boldsymbol{v}-\boldsymbol{u}_{\unicode[STIX]{x1D6FC}})\rangle _{\unicode[STIX]{x1D6FC}}$
. The notation
 $\langle \cdots \rangle _{\unicode[STIX]{x1D6FC}}$
indicates average in the velocity coordinate
 $\boldsymbol{v}$
with respect to the particle distribution function
 $f_{\unicode[STIX]{x1D6FC}}(\boldsymbol{x},\boldsymbol{v})$
.
These equations are coupled to the Maxwell equations:
 $$\begin{eqnarray}\unicode[STIX]{x1D735}\times \boldsymbol{E}+\frac{\unicode[STIX]{x2202}\boldsymbol{B}}{\unicode[STIX]{x2202}t}=0,\quad \unicode[STIX]{x1D735}\times \boldsymbol{B}=\unicode[STIX]{x1D707}_{0}\boldsymbol{J}+\frac{1}{c^{2}}\frac{\unicode[STIX]{x2202}\boldsymbol{E}}{\unicode[STIX]{x2202}t},\end{eqnarray}$$
 $$\begin{eqnarray}\unicode[STIX]{x1D735}\boldsymbol{\cdot }\boldsymbol{B}=0,\quad \unicode[STIX]{x1D735}\boldsymbol{\cdot }\boldsymbol{E}=\frac{\unicode[STIX]{x1D70C}}{\unicode[STIX]{x1D716}_{0}},\end{eqnarray}$$
where
 $\boldsymbol{J}=-e\sum _{\unicode[STIX]{x1D6FC}}n_{\unicode[STIX]{x1D6FC}}\boldsymbol{u}_{\unicode[STIX]{x1D736}}$
is the total electron current density and
 $\unicode[STIX]{x1D70C}$
is the total charge density. The latter is related to the particle densities by
 $\unicode[STIX]{x1D70C}=e(n_{i}-\sum _{\unicode[STIX]{x1D6FC}}n_{\unicode[STIX]{x1D6FC}})$
, where
 $n_{i}$
is the ion density and
 $n_{\unicode[STIX]{x1D6FC}}$
is the
 $\unicode[STIX]{x1D6FC}$
-beam electron density.
Equation (2.3) requires some closure condition on the heat flux, which we choose as
 $\unicode[STIX]{x1D735}\boldsymbol{\cdot }\unicode[STIX]{x1D618}_{\unicode[STIX]{x1D736}}=0$
. The consistency of this choice will be shown next, by comparison with the kinetic results. On the other hand, the negligible character of
 $\unicode[STIX]{x1D735}\boldsymbol{\cdot }\unicode[STIX]{x1D618}_{\unicode[STIX]{x1D736}}$
in the fluid description of the pure WI has already been shown to be accurate for a wide range of wavenumbers (Sarrat et al.
Reference Sarrat, Del Sarto and Ghizzo2016).
2.2 Equilibrium configuration
At equilibrium, we suppose the beams are along the
 $y$
-axis and are represented by their own set of fluid variables: density
 $n_{\unicode[STIX]{x1D6FC}}^{(0)}$
, fluid velocity
 $\boldsymbol{u}_{\unicode[STIX]{x1D6FC}}^{(0)}=u_{y,\unicode[STIX]{x1D6FC}}^{(0)}\boldsymbol{e}_{y}$
and pressure tensor
 $\unicode[STIX]{x1D72B}_{\unicode[STIX]{x1D6FC}}^{(0)}$
. These quantities are potentially different for each beam. Equilibrium velocities and density are constrained in order to avoid equilibrium electromagnetic fields: quasi-neutrality is ensured by
 $\sum _{\unicode[STIX]{x1D6FC}}n_{\unicode[STIX]{x1D6FC}}^{(0)}=n_{i}=n^{(0)}$
and the total electron current is set to zero, that is
 $\sum _{\unicode[STIX]{x1D6FC}}n_{\unicode[STIX]{x1D6FC}}^{(0)}u_{\unicode[STIX]{x1D6FC},y}^{(0)}=0$
. We define the squared plasma frequencies for each beam at equilibrium and for the complete electron system by:
 $$\begin{eqnarray}\unicode[STIX]{x1D714}_{pe,\unicode[STIX]{x1D6FC}}^{2}\equiv \frac{n_{\unicode[STIX]{x1D6FC}}^{(0)}e^{2}}{m\unicode[STIX]{x1D716}_{0}},\quad \unicode[STIX]{x1D714}_{pe}^{2}\equiv \unicode[STIX]{x1D714}_{pe,1}^{2}+\unicode[STIX]{x1D714}_{pe,2}^{2}=\frac{c^{2}}{d_{e}^{2}},\end{eqnarray}$$
with
 $d_{e}$
the electron skin depth.
The initial pressure tensor is assumed to be anisotropic for each beam. Similar anisotropic pressure configurations, although generally non-uniform in space, are evidenced by both direct satellite measurements and kinetic simulations of the solar wind turbulence (see for example Servidio et al. (Reference Servidio, Valentini, Califano and Veltri2012, Reference Servidio, Valentini, Perrone, Greco, Califano, Matthaeus and Veltri2015), Franci et al. (Reference Franci, Hellinger, Matteini, Verdini and Landi2016)) or magnetic reconnection (see for example Scudder & Daughton (Reference Scudder and Daughton2008), Scudder et al. (Reference Scudder, Holdaway, Daughton, Karimabadi, Roytershteyn, Russell and Lopez2012), Scudder (Reference Scudder2016)). Even if the mechanism of temperature anisotropisation in each context is still a matter of investigation, the dynamical action of the fluid strain on the pressure tensor components, recently identified as a possible ab initio source of non-gyrotropic anisotropy (Del Sarto, Pegoraro & Califano Reference Del Sarto, Pegoraro and Califano2016), seems to be a good candidate to explain temperature anisotropies measured, for example, in kinetic turbulence, such as that encountered in the solar wind plasma (Franci et al. Reference Franci, Hellinger, Matteini, Verdini and Landi2016; Parashar & Matthaeus Reference Parashar and Matthaeus2016). Regardless of the mechanism of generation of the initial anisotropy, here we assume an initial anisotropic pressure configuration which is unstable to Weibel-type modes. We make the further simplification of assuming the initial plasma to be homogeneous, in order to neglect spatial resonance effects which are known to determine a localisation of the generated magnetic field (Califano et al. Reference Califano, Pegoraro and Bulanov1997, Reference Califano, Prandi, Pegoraro and Bulanov1998, Reference Califano, Del Sarto and Pegoraro2006). While in the most general configuration we should in principle account for a generic orientation of the principal axes of the pressure tensor with respect to the direction of the beams and of the perturbation wave vector, we restrict ourselves to the particular choice of having one of the principal axes of each pressure tensor aligned to the beam direction,
 $$\begin{eqnarray}\unicode[STIX]{x1D72B}_{\unicode[STIX]{x1D6FC}}^{(0)}=\left[\begin{array}{@{}ccc@{}}\unicode[STIX]{x1D6F1}_{xx,\unicode[STIX]{x1D6FC}}^{(0)} & 0 & 0\\ 0 & \unicode[STIX]{x1D6F1}_{yy,\unicode[STIX]{x1D6FC}}^{(0)} & 0\\ 0 & 0 & \unicode[STIX]{x1D6F1}_{zz,\unicode[STIX]{x1D6FC}}^{(0)}\end{array}\right],\end{eqnarray}$$
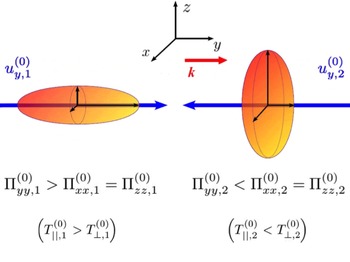
Two asymmetrical and counterstreaming beams perturbed by a wave propagating along them. Each beam presents an initial pressure anisotropy between parallel (
 $\Vert$
) and perpendicular (
 $\bot$
) – to the wave vector – components. In the limit of vanishing initial velocities,
 $u_{y,1}^{(0)}=u_{y,2}^{(0)}=0$
, as the pure WI requires an excess of perpendicular thermal energy, the population (1) would be stable to a pure Weibel Instability whereas the population (2) would be unstable.

and, for notation purposes which will appear more evident later, we introduce the squared velocities:
 $$\begin{eqnarray}c_{x,\unicode[STIX]{x1D6FC}}^{2}\equiv \frac{\unicode[STIX]{x1D6F1}_{xx,\unicode[STIX]{x1D6FC}}^{(0)}}{mn_{\unicode[STIX]{x1D6FC}}^{(0)}},\quad c_{y,\unicode[STIX]{x1D6FC}}^{2}\equiv \frac{\unicode[STIX]{x1D6F1}_{yy,\unicode[STIX]{x1D6FC}}^{(0)}}{mn_{\unicode[STIX]{x1D6FC}}^{(0)}},\quad c_{z,\unicode[STIX]{x1D6FC}}^{2}\equiv \frac{\unicode[STIX]{x1D6F1}_{zz,\unicode[STIX]{x1D6FC}}^{(0)}}{mn_{\unicode[STIX]{x1D6FC}}^{(0)}}.\end{eqnarray}$$
The reason for this geometry choice is that we want to focus here on perturbations propagating along the beams (see figure 1),
 $$\begin{eqnarray}\boldsymbol{k}=k_{y}\boldsymbol{e}_{y},\end{eqnarray}$$
in order to separately describe the TSI and the TRWI (Lazar et al. Reference Lazar, Dieckmann and Poedts2010), which in this configuration are decoupled and linearly evolve independently (cf. comments at the end of § 3.2). From a physical point of view, the configuration (2.7) is representative of the anisotropisation, due to kinetic heating and particle trapping processes, which is observed in kinetic simulations of laser–plasma interactions for Stimulated Raman Scattering (SRS) (Ghizzo et al. Reference Ghizzo, Johnston, Réveillé, Bertrand and Albrecht-Marc2006; Albrecht-Marc et al. Reference Albrecht-Marc, Ghizzo, Johnston, Réveillé, Del Sarto and Bertrand2007; Ghizzo, Del Sarto & Réveillé Reference Ghizzo, Del Sarto and Réveillé2009; Masson-Laborde et al. Reference Masson-Laborde, Rozmus, Peng, Pesme, Hller, Casanova, Bychenkov, Chapman and Loiseau2010) or for self-focussing processes (Ghizzo et al. Reference Ghizzo, Huot and Bertrand2003, Reference Ghizzo, Del Sarto, Réveillé, Besse and Klein2007). In these phenomena the symmetry of the system in both the coordinate and velocity space is essentially determined by the direction of propagation of the incident electromagnetic wave. The latter, indeed, turns out to determine also the orientation of the principal axes of the pressure tensor, as the kinetic heating processes related to particle acceleration and trapping occur differently along or perpendicular to the wave vector direction. For instance, the geometry defined in figure 1 can be relevant to the self-induced transparency scenario of a high-intensity laser pulse, i.e. the laser propagation through an overdense plasma in which the propagation is classically forbidden. A significant fraction of the incident laser energy flux is then converted into electron thermal longitudinal motion during the penetration phase allowed by relativistic effects. Numerical simulations using Vlasov codes in Ghizzo et al. (Reference Ghizzo, Del Sarto, Réveillé, Besse and Klein2007) or PIC codes in Guérin et al. (Reference Guérin, Mora, Adam, Hron and Laval1996) have shown that, during the propagation of the laser pulse, a relativistic Doppler shift takes place at the moving wave front and causes the beating of the incoming pump wave with its reflected Doppler-shifted electromagnetic wave (the wave front playing the role of a propagating mirror). However, in the dense plasma, important shielding effects arise and the hot electron current produced by the beating of electromagnetic waves is neutralised by a cold electron return current, as already indicated in Sentoku et al. (Reference Sentoku, Mima, Kaw and Nishikawa2003) and Zheng, He & Zhu (Reference Zheng, He and Zhu2005). The longitudinal hot electron current is then counteracted significantly by a cold return current in the opposite direction and torn into filaments due to the joint interaction of transverse Weibel-type and filamentary instabilities. Thus, the plasma becomes underdense beyond the wave front and the hot electron current propagating in plasma becomes filamentary, being related to the generation of a strong magnetic field. A similar kinetic heating mechanism can be met also in non-relativistic regimes, such as e.g. in three-wave parametric decays (the SRS example quoted above).
Independently from these applications relevant to laser–plasma experiments, and despite being relatively reductive with respect to the most general case, the beam anisotropy described by (2.7) has been largely studied to address the problem of generation of magnetic fields, e.g. on a cosmological scale due to the collision of counterstreaming intergalactic plasmas, and in this configuration the competition between TSI and CFI or TRWI modes has been discussed in both the non-relativistic and relativistic regimes (Lazar, Schlickeiser & Shukla Reference Lazar, Schlickeiser and Shukla2006; Lazar Reference Lazar2008; Stockem & Lazar Reference Stockem and Lazar2008; Stockem et al.
Reference Stockem, Lazar, Shukla and Smolyakov2008; Lazar et al.
Reference Lazar, Schlickeiser, Wielebinski and Poedts2009, Reference Lazar, Dieckmann and Poedts2010). Moreover, it represents a first generalisation to account for temperature anisotropy effects in the CFI occuring in collisionless shocks like gamma-ray bursts (see, e.g. Medvedev & Loeb Reference Medvedev and Loeb1999). The analysis performed in this configuration is also a first step for the inclusion of a magnetic field along the beam axis, e.g. to study beam instabilities in the solar wind, for which an initial pressure tensor like (2.7) with
 $\unicode[STIX]{x1D6F1}_{xx,\unicode[STIX]{x1D6FC}}^{(0)}=\unicode[STIX]{x1D6F1}_{zz,\unicode[STIX]{x1D6FC}}^{(0)}$
is quite reasonable when the spherical expansion of the solar wind is accounted for in a double-adiabatic framework (Matteini et al.
Reference Matteini, Hellinger, Landi, Trávnícek and Velli2011).
Therefore, leaving to a future work the discussion of the linear coupling between electrostatic and electromagnetic modes that would arise, even for perturbations purely parallel to the beams (2.9), when a generically oriented pressure tensor is considered, we restrict ourselves to analysing in this extended fluid framework the onset of the TRWI under the hypothesis (2.7), which can be related to a three Maxwellian particle distribution with kinetic temperatures
 $k_{_{B}}T_{i,\unicode[STIX]{x1D6FC}}\equiv \unicode[STIX]{x1D6F1}_{ii,\unicode[STIX]{x1D6FC}}^{(0)}/n_{\unicode[STIX]{x1D6FC}}^{(0)}$
for
 $i=x,y,z$
,
 $$\begin{eqnarray}f^{(0)}=n_{0}\mathop{\prod }_{i=x}^{z}\left(\frac{m}{2\unicode[STIX]{x03C0}k_{_{B}}T_{i}}\right)^{1/2}\exp \left(-\frac{mv_{i}^{2}}{2k_{_{B}}T_{i}}\right)=n_{0}\mathop{\prod }_{i=x}^{z}\frac{1}{\sqrt{2\unicode[STIX]{x03C0}}c_{i,\unicode[STIX]{x1D6FC}}}\exp \left(-\frac{v_{i}^{2}}{2c_{i,\unicode[STIX]{x1D6FC}}^{2}}\right).\end{eqnarray}$$
As it is well known, this initial configuration is unstable because of two kinds of anisotropy: one in pressure (
 $\unicode[STIX]{x1D6F1}_{xx,\unicode[STIX]{x1D6FC}}^{(0)}\neq \unicode[STIX]{x1D6F1}_{yy,\unicode[STIX]{x1D6FC}}^{(0)}\neq \unicode[STIX]{x1D6F1}_{zz,\unicode[STIX]{x1D6FC}}^{(0)}$
), the other in momentum (i.e. the counterstreaming beams configuration). The first one triggers the pure WI when the thermal spread transverse to a wave vector
 $\boldsymbol{k}$
is greater than the one in the parallel direction. The second one generates instability whatever the wave vector orientation, due to the natural repulsion between two counterstreaming electric currents. A perturbation orthogonal to the flow triggers the CFI whereas a perturbation along the flow is responsible for the TSI. A slanting perturbation gives birth to the so-called oblique modes. The CFI configuration has been widely examined, in particular the coupling between the CFI and the pure WI modes. This coupling has been investigated from a kinetic point of view by Lazar et al. (Reference Lazar, Schlickeiser and Shukla2006, Reference Lazar, Schlickeiser, Wielebinski and Poedts2009), Stockem & Lazar (Reference Stockem and Lazar2008) in the non-relativistic context, by Bret et al. (Reference Bret, Gremillet and Dieckmann2010) in the relativistic one and using the non-relativistic fluid pressure tensor description by Sarrat et al. (Reference Sarrat, Del Sarto and Ghizzo2016).
3 Dispersion matrix
We perturb the equilibrium with Fourier modes
 $\propto \text{exp}[-\text{i}(\unicode[STIX]{x1D714}t-k_{y}y)]$
, where we define the complex frequency
 $\unicode[STIX]{x1D714}\equiv \unicode[STIX]{x1D714}_{r}+\text{i}\unicode[STIX]{x1D6FE}$
, consisting of a real, propagating part,
 $\unicode[STIX]{x1D714}_{r}$
, and of a growth (or damping) rate,
 $\unicode[STIX]{x1D6FE}$
.
3.1 Linearisation
Starting with the continuity equation (2.1), we write
 $$\begin{eqnarray}n_{\unicode[STIX]{x1D6FC}}^{(1)}=n_{\unicode[STIX]{x1D6FC}}^{(0)}\frac{k_{y}u_{y,\unicode[STIX]{x1D6FC}}^{(1)}}{w_{\unicode[STIX]{x1D6FC}}},\end{eqnarray}$$
where we introduce the notation
 $$\begin{eqnarray}w_{\unicode[STIX]{x1D6FC}}\equiv \unicode[STIX]{x1D714}-\boldsymbol{k}\boldsymbol{\cdot }\boldsymbol{u}_{\unicode[STIX]{x1D6FC}}^{(0)}=\unicode[STIX]{x1D714}-k_{y}u_{y,\unicode[STIX]{x1D6FC}}^{(0)}.\end{eqnarray}$$
In a vector form, the linear momentum balance writes
 $$\begin{eqnarray}\displaystyle & \displaystyle u_{x,\unicode[STIX]{x1D6FC}}^{(1)}=-\frac{\text{i}e}{mw_{\unicode[STIX]{x1D6FC}}}(E_{x}^{(1)}+u_{y,\unicode[STIX]{x1D6FC}}^{(0)}B_{z}^{(1)})+\frac{k_{y}}{w_{\unicode[STIX]{x1D6FC}}}\frac{\unicode[STIX]{x1D6F1}_{xy,\unicode[STIX]{x1D6FC}}^{(1)}}{mn_{\unicode[STIX]{x1D6FC}}^{(0)}}, & \displaystyle\end{eqnarray}$$
 $$\begin{eqnarray}\displaystyle & \displaystyle u_{y,\unicode[STIX]{x1D6FC}}^{(1)}=-\frac{\text{i}e}{mw_{\unicode[STIX]{x1D6FC}}}E_{y}^{(1)}+\frac{k_{y}}{w_{\unicode[STIX]{x1D6FC}}}\frac{\unicode[STIX]{x1D6F1}_{yy,\unicode[STIX]{x1D6FC}}^{(1)}}{mn_{\unicode[STIX]{x1D6FC}}^{(0)}}, & \displaystyle\end{eqnarray}$$
 $$\begin{eqnarray}\displaystyle & \displaystyle u_{z,\unicode[STIX]{x1D6FC}}^{(1)}=-\frac{\text{i}e}{mw_{\unicode[STIX]{x1D6FC}}}(E_{z}^{(1)}-u_{y,\unicode[STIX]{x1D6FC}}^{(0)}B_{x}^{(1)})+\frac{k_{y}}{w_{\unicode[STIX]{x1D6FC}}}\frac{\unicode[STIX]{x1D6F1}_{yz,\unicode[STIX]{x1D6FC}}^{(1)}}{mn_{\unicode[STIX]{x1D6FC}}^{(0)}}, & \displaystyle\end{eqnarray}$$
with the following expressions for the diagonal components of
 $\unicode[STIX]{x1D72B}_{\unicode[STIX]{x1D6FC}}^{(1)}$
(cf. (2.3)),
 $$\begin{eqnarray}\unicode[STIX]{x1D6F1}_{xx,\unicode[STIX]{x1D6FC}}^{(1)}=\frac{k_{y}}{w_{\unicode[STIX]{x1D6FC}}}\unicode[STIX]{x1D6F1}_{xx,\unicode[STIX]{x1D6FC}}^{(0)}u_{y,\unicode[STIX]{x1D6FC}}^{(1)},\quad \unicode[STIX]{x1D6F1}_{zz,\unicode[STIX]{x1D6FC}}^{(1)}=\frac{k_{y}}{w_{\unicode[STIX]{x1D6FC}}}\unicode[STIX]{x1D6F1}_{zz,\unicode[STIX]{x1D6FC}}^{(0)}u_{y,\unicode[STIX]{x1D6FC}}^{(1)},\end{eqnarray}$$
 $$\begin{eqnarray}\unicode[STIX]{x1D6F1}_{yy,\unicode[STIX]{x1D6FC}}^{(1)}=3\frac{k_{y}}{w_{\unicode[STIX]{x1D6FC}}}\unicode[STIX]{x1D6F1}_{yy,\unicode[STIX]{x1D6FC}}^{(0)}u_{y,\unicode[STIX]{x1D6FC}}^{(1)},\end{eqnarray}$$
and for the non-diagonal components,
 $$\begin{eqnarray}\displaystyle & \displaystyle \unicode[STIX]{x1D6F1}_{xz,\unicode[STIX]{x1D6FC}}^{(1)}=0, & \displaystyle\end{eqnarray}$$
 $$\begin{eqnarray}\displaystyle & \displaystyle \unicode[STIX]{x1D6F1}_{xy,\unicode[STIX]{x1D6FC}}^{(1)}=\frac{k_{y}}{w_{\unicode[STIX]{x1D6FC}}}\unicode[STIX]{x1D6F1}_{yy,\unicode[STIX]{x1D6FC}}^{(0)}u_{x,\unicode[STIX]{x1D6FC}}^{(1)}-\frac{\text{i}e}{m}\frac{\unicode[STIX]{x1D6F1}_{yy,\unicode[STIX]{x1D6FC}}^{(0)}-\unicode[STIX]{x1D6F1}_{xx,\unicode[STIX]{x1D6FC}}^{(0)}}{w_{\unicode[STIX]{x1D6FC}}}B_{z}^{(1)}, & \displaystyle\end{eqnarray}$$
 $$\begin{eqnarray}\displaystyle & \displaystyle \unicode[STIX]{x1D6F1}_{yz,\unicode[STIX]{x1D6FC}}^{(1)}=\frac{k_{y}}{w_{\unicode[STIX]{x1D6FC}}}\unicode[STIX]{x1D6F1}_{yy,\unicode[STIX]{x1D6FC}}^{(0)}u_{z,\unicode[STIX]{x1D6FC}}^{(1)}-\frac{\text{i}e}{m}\frac{\unicode[STIX]{x1D6F1}_{zz,\unicode[STIX]{x1D6FC}}^{(0)}-\unicode[STIX]{x1D6F1}_{yy,\unicode[STIX]{x1D6FC}}^{(0)}}{w_{\unicode[STIX]{x1D6FC}}}B_{x}^{(1)}. & \displaystyle\end{eqnarray}$$
The Maxwell–Faraday equation allows us to eliminate the magnetic field:
 $B_{x}^{(1)}=k_{y}E_{z}^{(1)}/\unicode[STIX]{x1D714}$
and
 $B_{z}^{(1)}=-k_{y}E_{x}^{(1)}/\unicode[STIX]{x1D714}$
.
The evolution of
 $u_{y,\unicode[STIX]{x1D6FC}}^{(1)}$
completely determines that of
 $\unicode[STIX]{x1D6F1}_{xx,\unicode[STIX]{x1D6FC}}^{(1)}$
and
 $\unicode[STIX]{x1D6F1}_{zz,\unicode[STIX]{x1D6FC}}^{(1)}$
via plasma compressibility effects, but these
 $\unicode[STIX]{x1D72B}_{\unicode[STIX]{x1D736}}$
components are not linearly involved in the fluid velocity dynamics. In particular, equations (3.6)–(3.7) correspond to polytropic-type equations with indices ‘1’ (3.6) and ‘3’ (3.7) respectively. We emphasise however that, while polytropic closures with the same indices would give an equivalent description of the TSI, whose linear dispersion relation does not depend indeed on the pressure anisotropy (cf. § 4.1), the evolution of the out-of-diagonal components
 $\unicode[STIX]{x1D6F1}_{xy}$
and
 $\unicode[STIX]{x1D6F1}_{yz}$
of the pressure tensor is essential (cf. (3.3), (3.5)) to the fluid description of the TRWI, as already evidenced in the non-resonant limit of the non-relativistic WI (Sarrat et al.
Reference Sarrat, Del Sarto and Ghizzo2016). Notice that the
 $\unicode[STIX]{x1D6F1}_{xz,\unicode[STIX]{x1D6FC}}$
component remains zero during the whole linear evolution and that the two other non-diagonal components can evolve even if the equilibrium pressure is isotropic due to the first term on the right-hand side in equations (3.9) and (3.10). The role of an initial pressure anisotropy on the magnetic field generation clearly appears in the second term on the right-hand side of the two latter equations.
3.2 Dispersion relations
Combining linearised Maxwell and fluid equations leads to the generalised dispersion relation,
 $[\unicode[STIX]{x1D63F}]\boldsymbol{\cdot }\boldsymbol{E}^{(1)}=0$
, with
 $[\unicode[STIX]{x1D63F}]$
the dispersion matrix,
 $$\begin{eqnarray}\unicode[STIX]{x1D63F}=\left[\begin{array}{@{}ccc@{}}\unicode[STIX]{x1D60B}_{xx} & 0 & 0\\ 0 & \unicode[STIX]{x1D60B}_{yy} & 0\\ 0 & 0 & \unicode[STIX]{x1D60B}_{zz}\end{array}\right],\end{eqnarray}$$
whose elements
 $\unicode[STIX]{x1D60B}_{ij}$
are given by
 $$\begin{eqnarray}\displaystyle & \displaystyle \unicode[STIX]{x1D60B}_{xx}=\frac{\unicode[STIX]{x1D714}^{2}}{c^{2}}-k_{y}^{2}-\mathop{\sum }_{\unicode[STIX]{x1D6FC}}\frac{\unicode[STIX]{x1D714}_{pe,\unicode[STIX]{x1D6FC}}^{2}}{c^{2}}\frac{w_{\unicode[STIX]{x1D6FC}}^{2}+k_{y}^{2}(c_{x,\unicode[STIX]{x1D6FC}}^{2}-c_{y,\unicode[STIX]{x1D6FC}}^{2})}{w_{\unicode[STIX]{x1D6FC}}^{2}-k_{y}^{2}c_{y,\unicode[STIX]{x1D6FC}}^{2}}, & \displaystyle\end{eqnarray}$$
 $$\begin{eqnarray}\displaystyle & \displaystyle \unicode[STIX]{x1D60B}_{yy}=\frac{\unicode[STIX]{x1D714}^{2}}{c^{2}}-\frac{\unicode[STIX]{x1D714}^{2}}{c^{2}}\mathop{\sum }_{\unicode[STIX]{x1D6FC}}\frac{\unicode[STIX]{x1D714}_{pe,\unicode[STIX]{x1D6FC}}^{2}}{w_{\unicode[STIX]{x1D6FC}}^{2}-3k_{y}^{2}c_{y,\unicode[STIX]{x1D6FC}}^{2}}, & \displaystyle\end{eqnarray}$$
and
 $$\begin{eqnarray}\unicode[STIX]{x1D60B}_{zz}=\frac{\unicode[STIX]{x1D714}^{2}}{c^{2}}-k_{y}^{2}-\mathop{\sum }_{\unicode[STIX]{x1D6FC}}\frac{\unicode[STIX]{x1D714}_{pe,\unicode[STIX]{x1D6FC}}^{2}}{c^{2}}\frac{w_{\unicode[STIX]{x1D6FC}}^{2}+k_{y}^{2}(c_{z,\unicode[STIX]{x1D6FC}}^{2}-c_{y,\unicode[STIX]{x1D6FC}}^{2})}{w_{\unicode[STIX]{x1D6FC}}^{2}-k_{y}^{2}c_{y,\unicode[STIX]{x1D6FC}}^{2}}.\end{eqnarray}$$
As in the kinetic framework (Lazar et al.
Reference Lazar, Schlickeiser, Wielebinski and Poedts2009), we obtain three decoupled dispersion relations in the linear regime, given by
 $\text{Det}[\unicode[STIX]{x1D63F}]=0$
. The relation
 $\unicode[STIX]{x1D60B}_{yy}=0$
corresponds to plasma oscillations modified by the existence of the beams and damped by thermal effects: this is the fluid TSI dispersion relation. Notice that
 $\unicode[STIX]{x1D60B}_{yy}$
does not depend on the pressure anisotropy, but only on the thermal spread along the beams direction, as in the kinetic framework. The dispersion relations given by
 $\unicode[STIX]{x1D60B}_{xx}=0$
and
 $\unicode[STIX]{x1D60B}_{zz}=0$
are identical after replacing
 $c_{x,\unicode[STIX]{x1D6FC}}^{2}$
by
 $c_{z,\unicode[STIX]{x1D6FC}}^{2}$
and vice versa. The dispersion relation
 $\unicode[STIX]{x1D60B}_{xx}=0$
depends on the pressure anisotropy and describes the time-resonant Weibel-type modes we focus on in the following.
In order to discuss the transition between the non-propagating and the time-resonant character of the Weibel dispersion relation, we make the further simplifying assumption to consider the special case of two symmetrical beams. We then write
 $n_{1}^{(0)}=n_{2}^{(0)}=n^{(0)}/2$
,
 $u_{y,2}^{(0)}=-u_{y,1}^{(0)}=-u_{0}$
,
 $c_{z,\unicode[STIX]{x1D6FC}}=c_{z}$
,
 $c_{y,\unicode[STIX]{x1D6FC}}=c_{y}$
,
 $c_{x,\unicode[STIX]{x1D6FC}}=c_{x}\;\forall \unicode[STIX]{x1D6FC}$
and
 $c_{y}\neq c_{x}\neq c_{z}$
. The (3.12) and (3.13) respectively become
 $$\begin{eqnarray}\frac{\unicode[STIX]{x1D714}^{2}}{c^{2}}-k_{y}^{2}-\frac{\unicode[STIX]{x1D714}_{pe}^{2}}{2c^{2}}\mathop{\sum }_{\unicode[STIX]{x1D6FC}}\frac{\displaystyle 1+\frac{k_{y}^{2}(c_{x}^{2}-c_{y}^{2})}{w_{\unicode[STIX]{x1D6FC}}^{2}}}{\displaystyle 1-\frac{k_{y}^{2}c_{y}^{2}}{w_{\unicode[STIX]{x1D6FC}}^{2}}}=0\end{eqnarray}$$
and
 $$\begin{eqnarray}1-\frac{\unicode[STIX]{x1D714}_{pe}^{2}}{2}\mathop{\sum }_{\unicode[STIX]{x1D6FC}}\frac{1}{w_{\unicode[STIX]{x1D6FC}}^{2}}\frac{1}{\displaystyle 1-\frac{3k_{y}^{2}c_{y}^{2}}{w_{\unicode[STIX]{x1D6FC}}^{2}}}=0.\end{eqnarray}$$
We finally note that, should we have considered an anisotropic pressure configuration with none of the principal axes aligned with the beam and wave vector direction, i.e. with non-null out-of-diagonal equilibrium components of
 $\unicode[STIX]{x1D6F1}_{ij,\unicode[STIX]{x1D6FC}}^{(0)}$
, the dispersion matrix
 $[\unicode[STIX]{x1D63F}]$
would not have been diagonal, thus implying a linear coupling between electrostatic and electromagnetic features which in the case we study here are instead well separated and related to the TSI and TRWI only.
4 The hydrodynamic limit
We introduce the parameter
 $$\begin{eqnarray}\unicode[STIX]{x1D716}_{\unicode[STIX]{x1D6FC}}\equiv \frac{k_{y}c_{y,\unicode[STIX]{x1D6FC}}}{w_{\unicode[STIX]{x1D6FC}}},\end{eqnarray}$$
which satisfies the criterion
 $$\begin{eqnarray}|\unicode[STIX]{x1D716}_{\unicode[STIX]{x1D6FC}}|\ll 1\end{eqnarray}$$
at the hydrodynamic limit. In the case of perpendicular propagation of WI–CFI coupled modes, it becomes the condition
 $k_{y}c_{y,\unicode[STIX]{x1D6FC}}/|\unicode[STIX]{x1D714}|\ll 1$
. Once satisfied for each beam, this latter criterion has been shown to grant an identical description of the linear WI–CFI modes in the kinetic and in the extended fluid models (Sarrat et al.
Reference Sarrat, Del Sarto and Ghizzo2016).
Here we show that, in this limit, the kinetic TSI and the TRWI dispersion relations are correctly described by the extended fluid model.
For the sake of simplicity and in order to allow an analytical treatment of the transition between non-time-resonant and time-resonant Weibel modes discussed in § 5, we restrict the analysis to the case of symmetric beams (3.15)–(3.16). In this case, the hydrodynamic criterion reads
 $$\begin{eqnarray}\unicode[STIX]{x1D716}_{\pm }\equiv \frac{k_{y}c_{y}}{\sqrt{(\unicode[STIX]{x1D714}_{r}\mp k_{y}u_{0})^{2}+\unicode[STIX]{x1D6FE}^{2}}}\ll 1.\end{eqnarray}$$
The equivalence between the kinetic and extended fluid linear analysis in the hydrodynamic limit, discussed in §§ 4.1 and 4.2 below, can be shown to hold also for non-symmetrical beams. In this latter case, it is usually more difficult to fulfil the hydrodynamic criterion simultaneously for the two beams, especially if the temperature asymmetry between the beams is strong.
4.1 Two-stream instability
For the symmetrical TSI, the kinetic dispersion relation
 $\unicode[STIX]{x1D60B}_{yy}=0$
is (Lazar et al.
Reference Lazar, Schlickeiser, Wielebinski and Poedts2009)
 $$\begin{eqnarray}0=1+\frac{\unicode[STIX]{x1D714}_{pe}^{2}}{2}\left(\frac{1+\unicode[STIX]{x1D709}_{+}Z_{+}}{k_{y}^{2}c_{y}^{2}}+\frac{1+\unicode[STIX]{x1D709}_{-}Z_{-}}{k_{y}^{2}c_{y}^{2}}\right),\end{eqnarray}$$
where
 $Z_{\pm }=Z(\unicode[STIX]{x1D709}_{\pm })$
is the plasma dispersion function (Fried & Conte Reference Fried and Conte1961), with
 $\unicode[STIX]{x1D709}_{+}\equiv w_{+}/(\sqrt{2}k_{y}c_{y})=(\unicode[STIX]{x1D714}-k_{y}u_{0})/(\sqrt{2}k_{y}c_{y})$
and
 $\unicode[STIX]{x1D709}_{-}\equiv w_{-}/(\sqrt{2}k_{y}c_{y})=(\unicode[STIX]{x1D714}+k_{y}u_{0})/(\sqrt{2}k_{y}c_{y})$
.
As the symmetrical TSI is a non-propagating instability (
 $\unicode[STIX]{x1D714}_{r}=0$
case in (4.3)),
 $\unicode[STIX]{x1D716}_{+}=\unicode[STIX]{x1D716}_{-}$
and so the hydrodynamic criterion is fulfilled by the two beams. Making the assumption that
 $\unicode[STIX]{x1D709}_{\pm }\gg 1$
, it becomes possible to develop the plasma dispersion function
 $$\begin{eqnarray}Z(\unicode[STIX]{x1D709})\sim -\frac{1}{\unicode[STIX]{x1D709}}\left(1+\frac{1}{2\unicode[STIX]{x1D709}^{2}}+\frac{3}{4\unicode[STIX]{x1D709}^{4}}\right),\end{eqnarray}$$
and, substituting (4.5) in (4.4), we find
 $$\begin{eqnarray}0\sim 1-\frac{\unicode[STIX]{x1D714}_{pe}^{2}}{2}\left[\frac{1}{w_{+}^{2}}\left(1+\frac{3k_{y}^{2}c_{y}^{2}}{w_{+}^{2}}\right)+\frac{1}{w_{-}^{2}}\left(1+\frac{3k_{y}^{2}c_{y}^{2}}{w_{-}^{2}}\right)\right].\end{eqnarray}$$
Such a development is justified because of the behaviour of the TSI: the parallel thermal spread decreases the growth rate of this instability. One has to retain the term of order four in
 $\unicode[STIX]{x1D709}$
in the development of
 $Z$
to preserve some thermal effects in the dispersion relation. The final contribution of this term is only of order
 $\unicode[STIX]{x1D709}^{-2}$
.
If we perform a Taylor expansion of the fluid dispersion relation (3.16) for
 $\unicode[STIX]{x1D716}_{\unicode[STIX]{x1D6FC}}\ll 1$
, we recover (4.6) implying the equivalence of the fluid and the kinetic descriptions when
 $\unicode[STIX]{x1D716}_{\unicode[STIX]{x1D6FC}}\ll 1$
simultaneously for the two beams.
4.2 Weibel-like modes
The kinetic dispersion relation
 $\unicode[STIX]{x1D60B}_{xx}=0$
(or
 $\unicode[STIX]{x1D60B}_{zz}=0$
) for the symmetrical Weibel-like modes is (Lazar et al.
Reference Lazar, Schlickeiser, Wielebinski and Poedts2009)
 $$\begin{eqnarray}\frac{k_{y}^{2}c^{2}}{\unicode[STIX]{x1D714}^{2}}=1+\frac{\unicode[STIX]{x1D714}_{pe}^{2}}{\unicode[STIX]{x1D714}^{2}}\left(A+\frac{A}{2}(\unicode[STIX]{x1D709}_{+}Z_{+}+\unicode[STIX]{x1D709}_{-}Z_{-})-1\right),\end{eqnarray}$$
where we define the anisotropy parameter
 $A\equiv c_{x}^{2}/c_{y}^{2}$
.
Again we assume
 $\unicode[STIX]{x1D709}_{\pm }\gg 1$
and obtain the hydrodynamic dispersion relation
 $$\begin{eqnarray}\frac{k_{y}^{2}c^{2}}{\unicode[STIX]{x1D714}^{2}}\simeq 1-\frac{\unicode[STIX]{x1D714}_{pe}^{2}}{\unicode[STIX]{x1D714}^{2}}\left[1+\frac{A}{2}\left(\frac{k_{y}^{2}c_{y}^{2}}{w_{+}^{2}}+\frac{k_{y}^{2}c_{y}^{2}}{w_{-}^{2}}\right)\right].\end{eqnarray}$$
We have neglected all the terms greater than
 $\unicode[STIX]{x1D716}_{\pm }^{2}$
. This dispersion relation coincides with the corresponding limit taken for the fluid dispersion relation (3.15).
5 Time-resonant Weibel instability
From now on we focus on the dispersion relation of Weibel-like modes,
 $\unicode[STIX]{x1D60B}_{xx}=0$
. The numerical analysis of the kinetic dispersion relation performed by Lazar et al. (Reference Lazar, Dieckmann and Poedts2010) already evidenced the existence of a critical wavenumber
 $k_{_{SB}}$
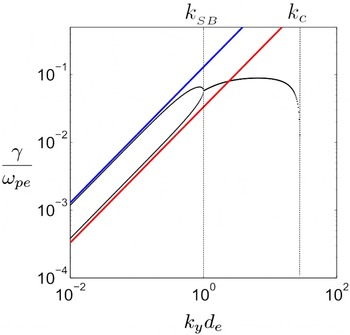
, at which a ‘slope breaking’ of the growth rate occurs (cf. figure 2), and the non-propagating nature of the most unstable mode that exists for
 $k_{y}<k_{_{SB}}$
. Here we show that the extended fluid approach allows an accurate description of such a transition and, moreover, makes it possible to identify the features of six roots of the dispersion relation and in particular of the second non-propagating mode met for
 $k_{y}<k_{_{SB}}$
: the slope breaking is then found to correspond to a bifurcation point, at which the two couples of non-propagating unstable modes existing for
 $k_{y}<k_{_{SB}}$
merge into the four time-resonant growing and decaying modes found for
 $k_{y}>k_{_{SB}}$
. The two growing modes – and also the two decaying ones – propagate in opposite directions (figure 3).
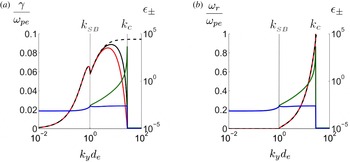
Comparison between kinetic (red line) and fluid (black line) growth rates (a) and corresponding frequencies (b) of the most unstable modes. The black dotted line corresponds to the values of
 $\unicode[STIX]{x1D714}_{r}$
and
 $\unicode[STIX]{x1D6FE}$
obtained with (4.8), i.e. by applying the hydrodynamic limit. Differences between fluid and kinetic models are more important for the growth rate than for the frequency of the more unstable solution. In (b), the three curves overlap. Blue and green lines correspond to the value of
 $\unicode[STIX]{x1D716}_{\pm }$
, computed with the kinetic value of
 $\unicode[STIX]{x1D714}$
for the two beams (the green curve being for
 $\unicode[STIX]{x1D716}_{-}$
, cf. (4.3)). Physical parameters:
 $u_{0}=1/30$
,
 $c_{x}=u_{0}+0.1$
and
 $c_{y}=u_{0}/10$
.

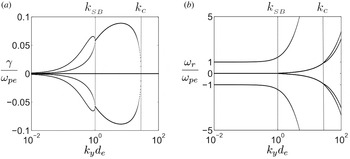
Roots of (5.1): growth rates (a), frequencies (b). The two panels display, for any value of
 $k_{y}$
, the behaviour of a total of six modes. The slope breaking observed in figure 2 for the growth rate corresponds to a merging of two unstable modes. Two other modes (characterised by
 $\unicode[STIX]{x1D714}_{r}\geqslant \unicode[STIX]{x1D714}_{pe}$
) are stable for any value of
 $k_{y}$
. Physical parameters:
 $u_{0}=1/30$
,
 $c_{x}=u_{0}+0.1$
and
 $c_{y}=u_{0}/10$
.

A second bifurcation point is found at the critical wavenumber
 $k_{y}=k_{c}$
at which the growth rate of the unstable modes becomes zero (figure 3): for
 $k_{y}>k_{c}$
, all modes have now become purely propagating. Two former unstable modes propagate in each direction, with different values of
 $\unicode[STIX]{x1D714}_{r}$
.
In order to show this, let us first discuss the accuracy of the fluid description in reproducing the known kinetic results (§ 5.1). Then we will focus on the resolution of the fluid dispersion relation, which allows an analytic solution from which these results can be deduced (§ 5.2). Then, in § 5.3 we comment on the validity of these results in the kinetic regime.
5.1 Transition to the time-resonant WI in the fluid and kinetic description
Figure 2(a) displays a comparison between the maximal growth rates obtained by integrating the fluid model, the kinetic model (both with no approximation) and the hydrodynamic limit of the two. The corresponding real frequencies, numerically obtained from (3.15) and (4.7), are sketched in figure 2(b). We used for this a set of non-relativistic parameters:
 $u_{0}=1/30$
,
 $c_{x}=u_{0}+0.1$
and
 $c_{y}=u_{0}/10$
. Two points shall be highlighted.
Regarding the discrepancies between the fluid and kinetic descriptions, one remarks a very good agreement between fluid and kinetic values of
 $\unicode[STIX]{x1D714}_{r}$
: differences between the two models and their hydrodynamic limit are negligible, even when
 $\unicode[STIX]{x1D716}_{\pm }$
is not. This is not the case of the growth rate, for which discrepancies between fluid and kinetic values increase with the wavenumber. However, they tend to coincide again at the cutoff value
 $k_{c}$
, which is almost identical in the fluid and kinetic models, next to which the hydrodynamic limit fails (the cutoff wavenumber disappears, instead, in the hydrodynamic limit (4.8)). The same kind of behaviour was remarked for the pure WI and for the WI–CFI coupled modes (Sarrat et al.
Reference Sarrat, Del Sarto and Ghizzo2016).
Concerning instead the dependence of
 $\unicode[STIX]{x1D714}_{r}$
and
 $\unicode[STIX]{x1D6FE}$
on the wavenumber
 $k_{y}$
, for the set of parameters of figure 2(b) one remarks the increase of
 $\unicode[STIX]{x1D714}_{r}$
between
 $k_{_{SB}}d_{e}\sim 1$
and
 $k_{c}d_{e}\sim 30$
. As evidenced by Lazar et al. (Reference Lazar, Dieckmann and Poedts2010), this behaviour is characteristic of the time-resonant WI, whose transition at
 $k_{_{SB}}d_{e}\sim 1$
occurs in figure 2 in the ‘hydrodynamic’ regime (both beams have
 $|\unicode[STIX]{x1D716}_{\pm }|\ll 1$
around
 $k_{y}=k_{_{SB}}$
). The curves of the three growth rates exhibit the same slope breaking at
 $k_{_{SB}}$
, indicating that for these parameters the pressure tensor based model gives an accurate description of the transition.
Therefore, besides being accurate for values of
 $k_{y}$
smaller than
 $k_{c}$
, yet comparable to or larger than
 $k_{_{SB}}$
, the results of the linear analysis in the extended fluid model are reliable also outside the hydrodynamic limit, although with some quantitative differences with respect to the kinetic result. To study the behaviour of the modes given by the roots of (4.7), we then rely on the fluid dispersion relation (3.15), which has the advantage of allowing a simpler analytical treatment due to its polynomial form in
 $\unicode[STIX]{x1D714}$
and in
 $k_{y}$
.
5.2 Discussion of the fluid dispersion relation
The fluid dispersion relation (3.15) gives a polynomial of degree three in
 $\unicode[STIX]{x1D714}^{2}$
,
 $$\begin{eqnarray}\displaystyle 0 & = & \displaystyle \unicode[STIX]{x1D714}^{6}-\unicode[STIX]{x1D714}^{4}[\unicode[STIX]{x1D714}_{pe}^{2}+k_{y}^{2}c^{2}+2k_{y}^{2}(u_{0}^{2}+c_{y}^{2})]\nonumber\\ \displaystyle & & \displaystyle +\,\unicode[STIX]{x1D714}^{2}[k_{y}^{4}(u_{0}^{2}-c_{y}^{2})^{2}+2k_{y}^{2}(u_{0}^{2}+c_{y}^{2})(\unicode[STIX]{x1D714}_{pe}^{2}+k_{y}^{2}c^{2})-\unicode[STIX]{x1D714}_{pe}^{2}k_{y}^{2}c_{x}^{2}]\nonumber\\ \displaystyle & & \displaystyle -\,k_{y}^{4}(c_{y}^{2}-u_{0}^{2})[k_{y}^{2}c^{2}(c_{y}^{2}-u_{0}^{2})-\unicode[STIX]{x1D714}_{pe}^{2}(u_{0}^{2}+c_{x}^{2}-c_{y}^{2})].\end{eqnarray}$$
which implies the existence of three couples of complex roots. These roots are evidenced in figure 3, where a numerical solution of (5.1) is provided for the same parameters of figure 2.
Although it is in principle possible to write the explicit general form of the roots of (5.1), for the purpose to identify the propagating or unstable behaviour of the modes in the intervals
 $k_{y}\leqslant k_{_{SB}}$
,
 $k_{_{SB}}\leqslant k_{y}\leqslant k_{c}$
and
 $k_{y}>k_{c}$
, it is sufficient to discuss the existence of the real and imaginary parts of the
 $\unicode[STIX]{x1D714}^{2}$
solutions. Rewriting (5.1) in a more compact form,
 $$\begin{eqnarray}W^{3}+a_{2}W^{2}+a_{1}W+a_{0}=0,\end{eqnarray}$$
with
 $W\equiv \unicode[STIX]{x1D714}^{2}$
, we look at the sign of (Abramovitz Reference Abramovitz, Abramovitz and Stegun1965)
 $$\begin{eqnarray}\unicode[STIX]{x1D6E5}\equiv q^{3}+r^{2},\end{eqnarray}$$
where
 $$\begin{eqnarray}q={\textstyle \frac{1}{3}}a_{1}-{\textstyle \frac{1}{9}}a_{2}^{2},\quad r={\textstyle \frac{1}{6}}(a_{1}a_{2}-3a_{0})-{\textstyle \frac{1}{27}}a_{2}^{3}.\end{eqnarray}$$
When
 $\unicode[STIX]{x1D6E5}>0$
, one root is real and two are complex conjugate. In the opposite case
 $\unicode[STIX]{x1D6E5}<0$
, the irreducible case, there are three different real solutions, while if
 $\unicode[STIX]{x1D6E5}=0$
, all the roots are real and at least two of them coincide.
The most general expressions for the three solutions in
 $\unicode[STIX]{x1D714}^{2}$
read
 $$\begin{eqnarray}\unicode[STIX]{x1D714}_{0}^{2}=\underbrace{[r+\unicode[STIX]{x1D6E5}^{1/2}]^{1/3}}_{s_{+}}+\underbrace{[r-\unicode[STIX]{x1D6E5}^{1/2}]^{1/3}}_{s_{-}}-\frac{a_{2}}{3}\end{eqnarray}$$
and
 $$\begin{eqnarray}\unicode[STIX]{x1D714}_{\pm }^{2}=-\frac{1}{2}(s_{+}+s_{-})-\frac{a_{2}}{3}\pm \frac{\text{i}\sqrt{3}}{2}(s_{+}-s_{-}).\end{eqnarray}$$
As
 $W=\unicode[STIX]{x1D714}^{2}=\unicode[STIX]{x1D714}_{r}^{2}-\unicode[STIX]{x1D6FE}^{2}+\text{i}2\unicode[STIX]{x1D714}_{r}\unicode[STIX]{x1D6FE}$
, the only possibility of obtaining a real
 $\unicode[STIX]{x1D714}^{2}$
is
 $\unicode[STIX]{x1D714}_{r}=0$
or
 $\unicode[STIX]{x1D6FE}=0$
, that is, to have purely propagating or purely unstable modes, whereas an unstable propagating mode corresponds to a complex value of
 $\unicode[STIX]{x1D714}^{2}$
. This allows us to characterise, in terms of the sign of
 $\unicode[STIX]{x1D6E5}$
, the three regions in the
 $k_{y}$
parameter space identified above and evidenced in the example of figure 3. Moreover, as the discriminant
 $\unicode[STIX]{x1D6E5}$
is a continuous function of
 $k_{y}$
, the slope breaking
 $k_{_{SB}}$
and the cutoff wavenumber
 $k_{c}$
correspond to the roots of the equation
 $\unicode[STIX]{x1D6E5}(k_{y})=0$
. This gives a criterion to determine a priori whether the WI is time resonant or strictly growing – or damped. Let us discuss under this light the three regions of figure 3.
 $k_{y}<k_{_{SB}}$
region: here the discriminant
 $\unicode[STIX]{x1D6E5}$
is negative, ensuring three strictly different real values for
 $\unicode[STIX]{x1D714}^{2}$
, either purely propagating of purely unstable. The two stable modes propagating in opposite directions and characterised by
 $|\unicode[STIX]{x1D714}_{r}|\geqslant \unicode[STIX]{x1D714}_{pe}$
correspond to linearly polarised electromagnetic waves. The four other modes consist of two non-propagating and growing Weibel-type modes and of their two damped counterparts, which evolve on long time scales with respect to the inverse electron oscillation time,
 $\unicode[STIX]{x1D6FE}\ll \unicode[STIX]{x1D714}_{pe}$
. For the set of parameters of figure 3, a local maximum in the growth rates can be identified around
 $k_{y}d_{e}\sim 0.8$
.
 $k_{y}=k_{_{SB}}\sim d_{e}^{-1}$
represents a ‘double’ bifurcation point in the
 $(k_{y},\unicode[STIX]{x1D714})$
space, which solves
 $\unicode[STIX]{x1D6E5}(k_{y})=0$
. At the slope breaking of
 $\unicode[STIX]{x1D6FE}$
, first observed by Lazar et al. (Reference Lazar, Dieckmann and Poedts2010), the two purely growing (damped) roots, distinct for
 $k_{y}<k_{_{SB}}$
, acquire the same growth rate and a propagating character, pairwise, in opposite directions.
 $k_{_{SB}}<k_{y}<k_{c}$
region: here, where time-resonant unstable modes are encountered,
 $\unicode[STIX]{x1D6E5}>0$
. The time-resonant Weibel modes, propagating in opposite directions (same
 $\unicode[STIX]{x1D6FE}$
and opposite
 $\unicode[STIX]{x1D714}_{r}$
), are described by the roots
 $\unicode[STIX]{x1D714}_{+}^{2}$
and
 $\unicode[STIX]{x1D714}_{-}^{2}$
(5.6). Moreover, the damped and growing modes are complex conjugates. The stable electromagnetic waves already encountered for
 $k_{y}<k_{_{SB}}$
are given by the only real root
 $W=\unicode[STIX]{x1D714}_{0}^{2}$
(5.5).
 $k_{y}=k_{c}$
is the point at which the unstable part of the solutions vanish. It corresponds again to a ‘double’ bifurcation in the
 $(k_{y},\unicode[STIX]{x1D714})$
space, once more given by
 $\unicode[STIX]{x1D6E5}(k_{c})=0$
.
In the
 $k_{y}>k_{c}$
region, where
 $\unicode[STIX]{x1D6E5}<0$
again, all modes maintain their propagating character with two different couples of values of
 $\unicode[STIX]{x1D714}_{r}$
, pairwise opposite in sign. All modes propagating above this critical wavenumber are stable, linearly polarised electromagnetic waves.
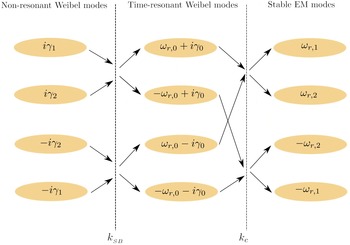
The nature of the six fluid modes in these three regions of the wavenumber space is summarised in figure 4.
Complex general expression of the four unstable modes as a function of the wavenumber. Black arrows indicate a merging or a breaking of degeneracy of two modes at a bifurcation. The bifurcations, at
 $k_{y}=k_{_{SB}}$
and
 $k_{y}=k_{c}$
, are indicated by the dashed vertical lines. Here, subscripts
 $\unicode[STIX]{x1D6FC}=1,2$
generically label different values for
 $\unicode[STIX]{x1D6FE}$
and
 $\unicode[STIX]{x1D714}_{r}$
.

5.2.1 Low-frequency approximation
Further insight on the behaviour of the unstable modes comes from the restriction to low frequencies
 $|\unicode[STIX]{x1D714}|\ll \unicode[STIX]{x1D714}_{pe}$
, which implies the exclusion of the stable solutions and thus the reduction of (5.1) to a polynomial of degree two in
 $\unicode[STIX]{x1D714}^{2}$
:
 $$\begin{eqnarray}\displaystyle 0 & = & \displaystyle \unicode[STIX]{x1D714}^{4}[\unicode[STIX]{x1D714}_{pe}^{2}+k_{y}^{2}c^{2}]-\unicode[STIX]{x1D714}^{2}[2k_{y}^{2}(u_{0}^{2}+c_{y}^{2})(\unicode[STIX]{x1D714}_{pe}^{2}+k_{y}^{2}c^{2})-\unicode[STIX]{x1D714}_{pe}^{2}k_{y}^{2}c_{x}^{2}]\nonumber\\ \displaystyle & & \displaystyle +\,k_{y}^{4}(c_{y}^{2}-u_{0}^{2})[k_{y}^{2}c^{2}(c_{y}^{2}-u_{0}^{2})-\unicode[STIX]{x1D714}_{pe}^{2}(u_{0}^{2}+c_{x}^{2}-c_{y}^{2})].\end{eqnarray}$$
It turns out that the growth rate and the real frequency of the four modes remain practically unchanged under this approximation. For example, for the parameters used in figure 2, the maximal growth rate in the non-resonant and in the time-resonant regime undergo a variation of
 ${\sim}0.1\,\%$
, whereas
 $k_{c}$
and
 $k_{_{SB}}$
vary less than 0.1 %.
With similar arguments to those previously developed to analyse the roots of (5.1), we obtain quite accurate analytical estimations of the slope-breaking and cutoff wavenumbers. We thus look for the roots of
 $\unicode[STIX]{x1D6E5}_{\ast }(k_{y})=0$
, where
 $\unicode[STIX]{x1D6E5}_{\ast }$
is the discriminant of (5.7), which reads
 $$\begin{eqnarray}\unicode[STIX]{x1D6E5}_{\ast }=k_{y}^{4}\{[16u_{0}^{2}c_{y}^{2}c^{4}]k_{y}^{4}+8\unicode[STIX]{x1D714}_{pe}^{2}u_{0}^{2}c^{2}[4c_{y}^{2}-c_{x}^{2}]k_{y}^{2}+\unicode[STIX]{x1D714}_{pe}^{4}[c_{x}^{4}+8u_{0}^{2}(2c_{y}^{2}-c_{x}^{2})]\}.\end{eqnarray}$$
The roots of the above polynomial correspond to real values of
 $k_{y}^{2}$
when
 $c_{y}^{2}<u_{0}^{2}$
(condition met for the set of parameters of figure 3). Under this hypothesis, the slope-breaking and the cutoff wavenumbers respectively read:
 $$\begin{eqnarray}k_{_{SB}}^{2}d_{e}^{2}=\frac{1}{4}\left[\frac{c_{x}^{2}}{c_{y}^{2}}\left(1-\sqrt{1-\frac{c_{y}^{2}}{u_{0}^{2}}}\right)-4\right],\quad k_{c}^{2}d_{e}^{2}=\frac{1}{4}\left[\frac{c_{x}^{2}}{c_{y}^{2}}\left(1+\sqrt{1-\frac{c_{y}^{2}}{u_{0}^{2}}}\right)-4\right].\end{eqnarray}$$
For the parameters of figure 3, for example, the values
 $k_{_{SB}}=1.0025$
and
 $k_{c}=28.2311$
are obtained, in good agreement with the numerical solution of (5.1).
The analytical estimation of
 $k_{_{SB}}$
given by Lazar et al. (Reference Lazar, Dieckmann and Poedts2010) in the hydrodynamic regime is recovered by taking the further limit
 $c_{y}\ll u_{0}$
, for which (5.9) becomes:
 $$\begin{eqnarray}k_{_{SB}}d_{e}\simeq \sqrt{\frac{c_{x}^{2}}{8u_{0}^{2}}-1};\quad k_{_{c}}d_{e}\simeq \frac{c_{x}}{\sqrt{2}c_{y}}.\end{eqnarray}$$
The limit case
 $u_{0}=c_{y}$
is particularly interesting as it implies the absence of the time-resonant solutions due to the superposition of the roots
 $$\begin{eqnarray}k_{_{SB}}d_{e}=k_{_{c}}d_{e}=\sqrt{\frac{c_{x}^{2}}{4c_{y}^{2}}-1}.\end{eqnarray}$$
Only the non-propagating Weibel modes remain. One remarks the strong similarity between (5.11) and the cutoff wavenumber of the pure WI modes,
 $k_{c}^{WI}=\sqrt{c_{x}^{2}/c_{y}^{2}-1}$
, as for
 $c_{y}=u_{0}$
the sixth-order polynomial dispersion relation (5.1) becomes
 $$\begin{eqnarray}0=\unicode[STIX]{x1D714}^{4}-\unicode[STIX]{x1D714}^{2}[\unicode[STIX]{x1D714}_{pe}^{2}+k_{y}^{2}(c^{2}+4c_{y}^{2})]+k_{y}^{2}[k_{y}^{2}c^{2}4c_{y}^{2}-\unicode[STIX]{x1D714}_{pe}^{2}(c_{x}^{2}-4c_{y}^{2})].\end{eqnarray}$$
This represents, indeed, the pure WI dispersion relation as obtained in the fluid framework (cf. (22) of Sarrat et al.
Reference Sarrat, Del Sarto and Ghizzo2016), with an effective squared ‘thermal’ velocity defined as
 $\tilde{c}_{y}^{2}=4c_{y}^{2}$
. This specific point can be understood considering each beam as represented by a bi-Maxwellian distribution function, whose standard deviations in the velocity space are
 $\unicode[STIX]{x1D70E}_{i}=c_{i}$
, with
 $i=x,y$
: when
 $c_{y}=u_{0}$
, the two Maxwellian are so close that they shape one single Maxwellian with standard deviation
 $\widetilde{\unicode[STIX]{x1D70E}}_{i}=2\unicode[STIX]{x1D70E}_{i}$
.
If
 $c_{y}>u_{0}$
the two distribution functions overlap and a part of the information contained in each of them is lost. We can then expect that these non-resonant Weibel modes will persist in the fluid description until
 $\widetilde{c}_{y}$
becomes comparable to
 $c_{x}$
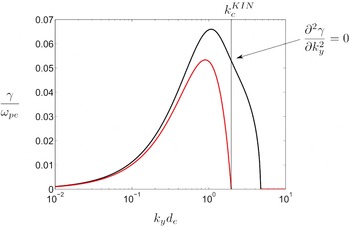
. A comparison between fluid and kinetic solutions (figure 5) shows that both descriptions lead to a non-resonant instability. However, the fluid growth rate exhibits an inflection point around the kinetic cutoff which does not exist in the kinetic description: once more, this suggests that close to the kinetic cutoff wavenumber, the inclusion of higher-order velocity moments in the fluid model becomes necessary.
Comparison between fluid (black) and kinetic (red) growth rates for
 $u_{0}=1/30$
,
 $c_{y}=u_{0}+0.01$
and
 $c_{x}=u_{0}+0.1$
. The spurious inflection point on the fluid growth rate is observed when
 $k_{y}$
is close to the kinetic cutoff
 $k_{c}^{KIN}$
.

5.2.2 Low-frequency, small-wavenumber limit
A simplified analytical expression for the growth rates of the non-resonant Weibel modes existing for
 $k_{y}<k_{_{SB}}$
can be obtained by further considering the
 $k_{y}d_{e}\ll 1$
limit of (5.7):
 $$\begin{eqnarray}\unicode[STIX]{x1D714}^{4}-\unicode[STIX]{x1D714}^{2}[2k_{y}^{2}(u_{0}^{2}+c_{y}^{2})-k_{y}^{2}c_{x}^{2}]+k_{y}^{4}(c_{y}^{2}-u_{0}^{2})(c_{y}^{2}-u_{0}^{2}-c_{x}^{2})=0.\end{eqnarray}$$
Its discriminant reads:
 $$\begin{eqnarray}\unicode[STIX]{x1D6E5}_{\ast \ast }=k_{y}^{4}c_{x}^{4}\left[1+\frac{8u_{0}^{2}}{c_{x}^{2}}\left(\frac{2c_{y}^{2}}{c_{x}^{2}}-1\right)\right]=k_{y}^{4}[c_{x}^{4}+8u_{0}^{2}(2c_{y}^{2}-c_{x}^{2})]\end{eqnarray}$$
and its sign does not depends on the value of
 $k_{y}$
. Consequently the bifurcations disappear.
Consider now the strong anisotropy limit expressed by
 $c_{y}\ll u_{0}\ll c_{x}$
, which is, for example, the one represented in figures 2 and 3 (with
 $\unicode[STIX]{x1D6E5}_{\ast \ast }$
scaling as
 $10^{-4}k_{y}^{4}$
). This corresponds to the case
 $\unicode[STIX]{x1D6E5}_{\ast \ast }>0$
. This assumption leads us to the following asymptotic estimates for the two solutions in
 $\unicode[STIX]{x1D714}^{2}$
and for the corresponding growth and damping rates (figure 6),
 $$\begin{eqnarray}\unicode[STIX]{x1D714}^{2}\simeq -k_{y}^{2}(u_{0}^{2}-c_{y}^{2}),\quad \unicode[STIX]{x1D6FE}\simeq \pm k_{y}u_{0}\sqrt{1-\frac{c_{y}^{2}}{u_{0}^{2}}}\quad \text{(least unstable mode),}\end{eqnarray}$$
 $$\begin{eqnarray}\unicode[STIX]{x1D714}^{2}\simeq -k_{y}^{2}(c_{x}^{2}-3u_{0}^{2}),\quad \unicode[STIX]{x1D6FE}\simeq \pm k_{y}c_{x}\sqrt{1-\frac{3u_{0}^{2}}{c_{x}^{2}}}\quad \text{(most unstable mode),}\end{eqnarray}$$
which, as expected, are non-propagating.


Two time-resonant unstable modes can be obtained instead for
 $\unicode[STIX]{x1D6E5}_{\ast \ast }<0$
. Since the discriminant of
 $\unicode[STIX]{x1D6E5}_{\ast \ast }(c_{x}^{2})=0$
is
 $64u_{0}^{2}(u_{0}^{2}-c_{y}^{2})$
, we deduce that in this case
 $\unicode[STIX]{x1D6E5}_{\ast \ast }<0$
if
 $c_{x-}^{2}<c_{x}^{2}<c_{x+}^{2}$
, with
 $$\begin{eqnarray}c_{x,\pm }^{2}=4u_{0}^{2}\left(1\pm \sqrt{1-\frac{c_{y}^{2}}{u_{0}^{2}}}\right).\end{eqnarray}$$
Assuming in particular, with no loss of generality,
 $c_{y}\ll u_{0}$
then
 $c_{x,+}\simeq \sqrt{2(4u_{0}^{2}-c_{y}^{2})}$
 $\simeq 2\sqrt{2}u_{0}$
and
 $c_{x,-}\simeq \sqrt{2}c_{y}$
. This result agrees with (5.10) for the slope breaking: for
 $c_{y}\ll u_{0}$
, when
 $c_{x}<2\sqrt{2}u_{0}$
the Weibel instability is always propagating.
To illustrate this point, let us consider a numerical example for parameters fitting in the upper bound of the interval
 $\unicode[STIX]{x1D6E5}_{\ast \ast }<0$
: choosing
 $u_{0}=1/30$
,
 $c_{y}=u_{0}/10$
, which fulfil the conditions
 $c_{y}\ll u_{0}$
and
 $c_{x}=\sqrt{2}u_{0}\lesssim c_{x,+}$
, then
 $\unicode[STIX]{x1D6E5}_{\ast \ast }\simeq -1$
,
 $5\times 10^{-5}k_{y}^{4}$
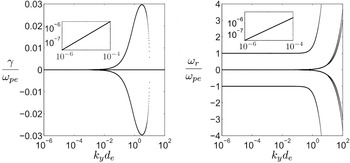
. The solutions of the exact fluid dispersion relation (5.1) are displayed in figure 7. Note that, because of this, the assumptions
 $k_{y}d_{e}\ll 1$
and
 $|\unicode[STIX]{x1D714}|\ll \unicode[STIX]{x1D714}_{pe}$
do not intervene in this result. Looking at the sign of the discriminant
 $\unicode[STIX]{x1D6E5}$
of the exact fluid dispersion relation (5.1), the represented curve is recognised to correspond to the TRWI, with a value of
 $k_{c}$
which is well approximated by the corresponding estimation of (5.10):
 $\unicode[STIX]{x1D6E5}$
is positive for
 $k_{y}<k_{c}\sim 10d_{e}^{-1}$
, zero at
 $k_{y}=k_{c}$
and negative for
 $k_{y}>k_{c}$
.
Numerical solution of the fluid dispersion relation (5.1) for
 $u_{0}=1/30$
,
 $c_{y}=u_{0}/10$
and
 $c_{x}=\sqrt{2}u_{0}$
(then
 $\unicode[STIX]{x1D6E5}_{\ast \ast }\simeq -1$
,
 $5\times 10^{-5}k_{y}^{4}$
).

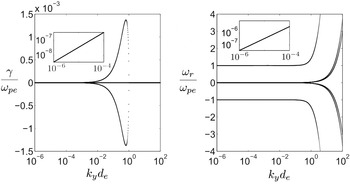
Numerical solution of the fluid dispersion relation (5.1) for
 $u_{0}=1/30$
,
 $c_{y}=u_{0}/10$
and
 $c_{x}=2c_{y}$
(then
 $\unicode[STIX]{x1D6E5}_{\ast \ast }\simeq -2\times 10^{-7}k_{y}^{4}$
).

Let us focus now on the lower bound of the
 $\unicode[STIX]{x1D6E5}_{\ast \ast }<0$
interval, by choosing
 $u_{0}=1/30$
,
 $c_{y}=u_{0}/10$
and
 $c_{x}=2c_{y}$
, so that
 $\unicode[STIX]{x1D6E5}_{\ast \ast }\simeq -2\times 10^{-7}k_{y}^{4}$
. Results are shown in figure 8. As expected, due to the smaller thermal anisotropy, the growth rate is smaller than the one considered in figure 7, but the qualitative behaviour is the same.
Finally,
 $\unicode[STIX]{x1D6E5}_{\ast \ast }>0$
and there are no more unstable modes when
 $c_{x}\lesssim c_{x,-}$
because the transverse thermal energy is not sufficient anymore to drive the Weibel-type mode.
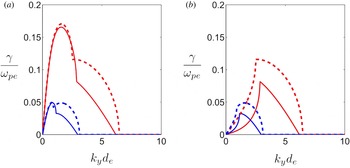
Comparison between fluid (dashed lines) and kinetic (solid lines) growth rates corresponding to the upper (a) and to the lower (b) unstable branches of the Weibel instability. Blue curves are obtained for
 $u_{0}=1/30$
,
 $c_{y}=u_{0}/\sqrt{2}$
and
 $c_{x}=10c_{y}$
. Red curves are obtained for
 $u_{0}=1/30$
,
 $c_{y}=u_{0}/\sqrt{2}$
and
 $c_{x}=5c_{y}$
. A direct comparison with figure 1 in Lazar et al. (Reference Lazar, Dieckmann and Poedts2010) can be made.

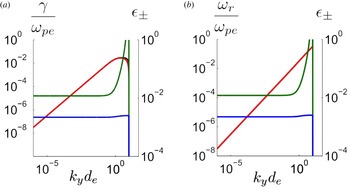
Comparison between kinetic (red line) and fluid (black line) maximal growth rates (a) and corresponding frequencies (b). Blue and green lines corresponds to the hydrodynamic criterion
 $\unicode[STIX]{x1D716}_{\unicode[STIX]{x1D6FC}}=k_{y}c_{y}/\unicode[STIX]{x1D6FA}_{\unicode[STIX]{x1D6FC}}$
values for the two beams, computed with the kinetic value of
 $\unicode[STIX]{x1D714}$
. The physical parameters are the same than for figure 7:
 $u_{0}=1/30$
,
 $c_{x}=\sqrt{2}u_{0}$
and
 $c_{y}=u_{0}/10$
. Differences between the two models appear only near of the cutoff.

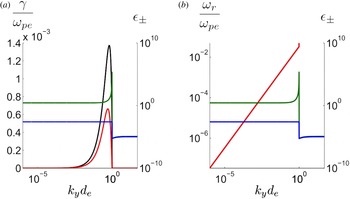
Comparison between kinetic (red line) and fluid (black line) maximal growth rates (a) and corresponding frequencies (b). Blue and green lines corresponds to the value of the hydrodynamic criterion
 $\unicode[STIX]{x1D716}_{\unicode[STIX]{x1D6FC}}$
for the two beams. The physical parameters are the same than for figure 8:
 $u_{0}=1/30$
,
 $c_{y}=u_{0}/10$
and
 $c_{x}=2c_{y}$
. The hydrodynamic limit is never reached, but the two models predict a Resonant Weibel regime whatever
 $k_{y}$
. If the differences between the growth rate values are substantial, the agreement between the two descriptions for the real frequency is very good.

5.3 Full kinetic description
Although with some quantitative differences in the numerical estimations of the growth rates and critical wavenumbers, the existence and characterisation of the sixth roots of the fluid dispersion relation (5.1) in the three intervals of the wavenumber space,
 $k_{y}<k_{_{SB}}$
,
 $k_{_{SB}}<k_{y}<k_{c}$
and
 $k_{c}<k_{y}$
, are confirmed in a full kinetic description, even when the hydrodynamic limit is not satisfied. In particular, the second unstable mode evidenced in figure 3 can be generally identified also in the kinetic framework (we note in passing the usefulness of the fluid solution as an initial seed for the numerical kinetic solver).
An example of this solution is shown in figure 9, where the growth rate of the lower non-resonant Weibel unstable branch is represented as a function of the wavenumber, for parameters which do not satisfy the hydrodynamic criterion. The fluid model overestimates the kinetic growth rate, but
 $k_{_{SB}}$
is approximately the same. Note that due to the lower value of
 $|\unicode[STIX]{x1D714}|$
, the hydrodynamic criterion is harder to achieve for the lower branch than for the upper branch.
The role of thermal effects on the transition to the TRWI, characterised in terms of the fluid analysis in § 5.2.2, is also recovered in the kinetic framework. As an example, in figures 10 and 11 we show a comparison of the fluid and kinetic growth rates and real frequencies for the most unstable mode analysed in figures 7 and 8 respectively.
For the case of figure 10 the agreement is excellent, consistent with the fulfilment of the hydrodynamic criterion for this set of parameters. We can expect, also in the kinetic case, the disappearance of the non-resonant instability in favour of the time-resonant one, when the condition
 $c_{x-}^{2}<c_{x}^{2}<c_{x+}^{2}$
is fulfilled, as the behaviour observed for
 $k_{y}d_{e}\sim 10^{-6}$
is the same to that observed at arbitrarily smaller wavenumber. Indeed, the terms
 ${\sim}k_{y}^{8}$
and
 ${\sim}k_{y}^{6}$
in (5.8) are dominated by those proportional to
 $k_{y}^{4}$
.
Nevertheless, the qualitative agreement is excellent also for the case of figure 11, which is largely outside the hydrodynamic regime, though quantitative differences are important here: the fluid model largely overestimates the kinetic value of the maximal growth rate. It remains however correctly smaller than the fluid one displayed on figure 10, as expected due to the relatively smaller initial anisotropy. Remarkably, the fluid and kinetic estimations of
 $k_{c}$
and of
 $\unicode[STIX]{x1D714}_{r}$
for the TRWI appear to be in excellent quantitative agreement also in this case.
6 Conclusion
In this work we have shown that an extended fluid description which takes into account the full pressure tensor dynamics makes it possible to reproduce important features of Weibel-type instabilities excited by perturbations parallel to two counterstreaming beams, such as the existence of time-resonant (propagating) modes. By restricting ourselves to the case of symmetric beams, we have evidenced an excellent quantitative agreement between the fluid and kinetic linear description of both the TSI and the Weibel-like modes in the hydrodynamic limit (§ 4). We have then shown how the behaviour of the fluid modes agrees qualitatively and, partially, quantitatively, with the kinetic description also outside of this hydrodynamic regime (§ 5).
We have shown that this fluid description makes possible an analytical identification of various features of these Weibel-like modes in the parameter space. For example, this approach has allowed us to evidence a second purely unstable mode in the non-resonant regime, whose existence is attested also in the kinetic framework even when the hydrodynamic assumption is not satisfied. The slope breaking in the growth rate, first observed by Lazar et al. (Reference Lazar, Dieckmann and Poedts2010), is then found to correspond to a bifurcation point of two unstable non-resonant modes, which completely disappears for a sufficiently small initial anisotropy (a condition which leads, instead, to a purely TRWI – § 5.2.2).
Future numerical investigations will tell whether the fluid description of these Weibel-type modes remains consistent also during their nonlinear evolution, a possibility which would imply a remarkable gain in terms of the computational cost of nonlinear simulations. In this regard we remark the interest of this analysis also as a further step towards the fluid modelling of more general two-dimensional anisotropic configurations. The ‘macroscopic’ insight allowed by this fluid description will hopefully help to better identify the characteristics of the so-called oblique Weibel-type instabilities occurring in this configuration, in which the features of Weibel, CFI and TSI modes are coupled.