I. INTRODUCTION
Zirconium and its alloys are often specified for cladding and structural materials in the core of nuclear reactors because of their low thermal neutron capture cross-section, adequate mechanical properties, and good corrosion resistance compared to other commercially available structural materials. Reference Peng, Bai, Chen, Zhou, Liu and Yu1 The desired increase in fuel burn-up in modern reactors leads to more severe radiation damage to core components, including the fuel channels, resulting in irradiation growth, as well as the degradation of mechanical properties and corrosion resistance. Reference Idrees, Yao, Kirk and Daymond2,Reference Azevedo3 Given the hostile environment of a nuclear reactor core, the material selection for the pressure tube of the generation-IV reactor CANDU-SCWR (supercritical water cooled reactor) design is guided by the requirements of excellent mechanical properties, corrosion resistance, and low neutron capture cross-section with the goals of extended service life and higher efficiency compared to conventional CANDU reactors. Reference Chow and Khartabil4 The high strength creep resistant zirconium alloy Excel developed by Chalk River Laboratory in 1970 has been specified as a candidate pressure tube material for the high efficiency fuel channel (HEC) and re-entrant fuel channel (REC) designs in the CANDU-SCWR. Reference Ibrahim, Price and Wysiekiersky5–Reference Cheadle, Holt, Fidleris, Causey, Urbanic and Franklin7
The microstructure of Excel alloy (Zr–3.5 wt% Sn–0.8Nb–0.8Mo–0.2Fe) differs from the more common Zr alloys such as Zircaloy-2, Zircaloy-4, and Zr–2.5% Nb due to its different chemical composition. However, similarities can be found between Zircaloy-2, Zircaloy-4, and the α phase of Excel, as they contain Sn as a solute. On the other hand, under operating conditions, Excel has in common with Zr–2.5Nb a dual phase microstructure and the presence of Nb in the β phase. Reference Griffiths8 Detailed properties of Excel can be found elsewhere Reference Chow, Khartabil and Bushby9 and the strength differential between Excel and Zr–2.5% Nb is discussed in Ref. Reference Salinas-Rodriguez, Akben, Jonas and Ibrahim10.
Due to their strong crystallographic texture, zirconium alloy tubes are prone to irradiation induced growth, a dimensional change in the absence of an applied stress, due to the separation of vacancies and interstitials to various anisotropic sinks,
Reference Holt and Gilbert11
leading to expansion along the a-axis and contraction along the c-axis of the hexagonal close packed (HCP) unit cell.
Reference Fidleris, Tucker, Adamson, Adamson and Van Swam12
Irradiation growth accelerates at higher neutron fluences (above approximately 4 × 1025 n/m2),
Reference Rogerson and Murgatroyd13
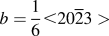
as the faulted, vacancy type, basal plane dislocation loops, with a Burgers vector of
 $b = {1 \over 6} \lt 20\overline 2 3 >$
, nucleate and grow after an incubation period [later denoted as the Threshold Incubation Dose (TID)].
Reference Griffiths8,Reference Jostsons, Kelly, Blake, Farrel, Sprague and Kramer14,Reference Griffiths and Gilbert15
In earlier studies, no <c>-component dislocations have been observed in annealed Zircaloy irradiated at 247–397 °C at fluences below 3 × 1025 n/m2 (E > 1 MeV).
Reference Northwood, Gilbert, Bahen, Kelly, Blake, Jostsons, Madden, Faulkner, Bell and Adamson16
Later, <c>-component dislocations generated by neutron irradiation were observed in several Zr based materials, with <c>-component loops nucleating at higher fluences which varied with temperature.
Reference Griffiths8
For example, <c>-component loops are found in high purity zirconium at 500 °C after a neutron fluence of 1.3 × 1025 n/m2 (E > 1 MeV) but not at lower temperatures,
Reference Jostsons, Blake, Napier, Kelly and Farrell17
and in Zircaloy-2 at 417 °C after 6.3 × 1025 n/m2 (E > 1 MeV).
Reference Holt and Gilbert18
Similarly, Holt and Gilbert
Reference Holt and Gilbert11
reported the formation of <c>-component loops in Zircaloy-2 and Zircaloy-4 at 287 °C irradiated above 3 × 1025 n/m2 (E >1 MeV) but that the loops were absent below this fluence; the density of these loops was found to be higher in the vicinity of secondary phase precipitates (SPPs). There are numerous neutron and electron irradiation studies on the formation and stability of <c>-component dislocation loops in Zr based alloys, as reviewed in detail by Griffiths.
Reference Griffiths8
The formation and stability of these loops depend on many factors, including dose/fluence, temperature, and presence of alloying elements. It has been reported by Jostsons et al.
Reference Jostsons, Kelly, Blake, Farrel, Sprague and Kramer14
that <c>-component loops nucleate at a fluence of 0.1 × 1025 n/m2 (E > 1 MeV) at 462 °C, in Zr with a high interstitial impurity content. The reason behind the incubation dose was proposed to be the stresses generated by solute dissolution and precipitate formation at grain boundaries or as a result of irradiation growth itself.
Reference Griffiths8,Reference Herring, Loretto, French and Phillips19,Reference Yang20
Different incubation fluences are reported for the formation of <c>-component loops in different zirconium alloys, for example in Zircaloy-2 and Zircaloy-4 at or above 287 °C, there are no <c>-component defects following irradiation to low fluences ∼1 × 1025 n/m2 (E > 1 MeV) but there are <c>-component defects at high fluences (∼8 × 1025 n/m2).
Reference Griffiths and Gilbert15
In contrast, at 427 °C, the <c>-component defects were present at 1.3 × 1025 n/m2.
Reference Griffiths and Gilbert15
In cold worked Zr–2.5% Nb and sponge Zr, the <c>-component loops are formed at fluences ≥5 × 1025 n/m2, whereas in annealed Excel they have been observed at lower fluences (∼0.1 × 1025 n/m2).
Reference Griffiths8
In most of the cases, the reason behind the incubation period has been thought to be the time required for dissolution of alloying elements from second phase particles and/or irradiation induced redistribution from the matrix Reference Griffiths8 ; differences between alloys can then be directly expected due to the presence of different alloying elements. The main alloying element which has been considered to affect the formation of <c>-component loops is Fe, which is a fast interstitial diffuser. The effect of alloying elements, irradiation temperature, and fluence on the formation of <c>-component defects in neutron irradiated Zircaloy-2 and Zircaloy-4 was studied in detail by Griffiths and Gilbert. Reference Griffiths and Gilbert15 It was reported that for temperatures between 287 and 307 °C, and at fluences greater than 5 × 1025 n/m2, vacancy type <c>-component loops are higher in number density near intermetallic precipitates, which was attributed to the increase in the solute volume around the intermetallic precipitates due to irradiation induced dissolution of precipitates. An effect of temperature has been reported, as at 77 °C there is no evidence for dissolution of precipitates and <c>-component loops, whereas they are observed readily at 427 °C. Here a correlation was found between the appearances of <c>-component loops and radiation induced redistribution of Fe. Enhanced nucleation of <c>-component loops in the presence of Fe has also been confirmed by a high voltage electron microscope (HVEM) study of Fe doped zirconium by De Carlan et al. Reference De Carlan, Régnard, Griffiths, Gilbon, Bradley and Sabol21 Griffiths Reference Griffiths8 points out that there might be other factors affecting the formation of <c>-component loops, since they have also been observed in Zr based materials at fluences lower than that associated with a significant radiation-induced increase in the interstitial solute of the matrix. The presence of <c>-component loops in neutron irradiated high purity Zr, after a fluence of 1.3 × 1025 n/m2 (E > 1 MeV), at relatively higher temperature (500 °C) while not at lower temperature further raises questions as to the solute assisted nucleation mechanism and the role of irradiation temperature. Temperature is one of the most significant factors affecting the formation of <c>-component loops, as microstructural evolution is assisted by several thermally activated processes related to the diffusion, dissolution, redistribution of alloying elements, and of the reduction of the stacking fault energy of Zr.
The effect of temperature has been studied on solute Fe, Cr, and Ni, as they are the major alloying elements present in Zircaloy-2 and Zircaloy-4, Reference Griffiths8 however, substitutional alloying elements such as Nb, Mo elements present in other Zr alloys, e.g., Excel, and Zr–2.5Nb, have not been fully explored and discussed yet. Lee et al. Reference Lee, Hwang, Yasuda and Kinoshita22 have attempted to investigate the effect of Mo on radiation damage of Zr–1 wt% Nb–1% Sn–0.1% Fe alloy. It has been reported that the addition of 0.5 wt% Mo decreased the initial defect nucleation rate and suppressed the growth rate of defects, which was attributed to a retardation of point defect diffusion by Mo. No other experimental evidence of Mo effect on point defect diffusion which can significantly modify the microstructural evolution based on the mechanism suggested by Lee et al. Reference Lee, Hwang, Yasuda and Kinoshita22 is present.
The dependence of incubation period for the nucleation of <c>-component loops has not been studied in detail as a function of neutron dose, temperature, and microchemistry. Furthermore, only post irradiation analysis has been conducted in the above mentioned neutron irradiation studies, which while it provides a picture of the final microstructure after a given neutron fluence, leaves the dose–impurity–temperature relation unclear.
In situ ion irradiation techniques have been successfully used as analogues to neutron irradiation, to study the formation of <c>-component loops in Zr based alloys confirming that the formation of <c>-component loops occurs after an incubation period. Reference Idrees, Yao, Sattari, Kirk and Daymond23,Reference Hengstler-Eger, Baldo, Beck, Dorner, Ertl, Hoffmann, Hugenschmidt, Kirk, Petry, Pikart and Rempel24 This incubation period was attributed to the dissolution and redistribution of the solute content of the system, which hence strongly depends on both the material microchemistry and the irradiation conditions. While nucleation of <c>-component loops is dependent on a number of factors including dose, dose rate, temperature, stress, and alloying elements present, Reference Griffiths8,Reference Griffiths, Bruce and Magnus25 it appears that dose and temperature are the primary factors governing the nucleation of <c>-component loops and hence irradiation growth. Reference Griffiths and Gilbert15 At low temperatures (∼77 °C), both the formation of <c>-component loops and breakaway growth have not been observed for fluences up to 1.5 × 1026 n/m2. Reference Griffiths and Gilbert15 With increasing irradiation temperature, accelerated growth and <c>-component loops have been observed at lower fluences confirming a temperature dependence in the formation of <c>-component loops. Reference Griffiths and Gilbert15,Reference Carpenter and Watters26 In an experimental study, Tucker et al. Reference Tucker, Fidleris, Adamson, Franklin and Adamson27 have shown that the irradiation growth in Excel is both fluence and temperature dependent. At high neutron fluences (5–15 × 1025 n/m2) and temperatures above 376 °C, the Excel alloy experiences higher growth strains than other Zr based alloys under similar irradiation conditions. However, at lower temperatures, the growth rate in Excel was found to be comparable to that of Zircaloy-4. This variation in the growth strains between Excel and other Zr based alloys was attributed to the differing starting microstructures and their evolution during irradiation. Reference Tucker, Fidleris, Adamson, Franklin and Adamson27 In a comparative study of irradiation growth in pure Zr and different Zr alloys, irradiation growth was attributed to the formation of vacancy <c>-component loops in the basal plane, Reference Murgatroyd and Rogerson28 and it was found that in Zr alloys containing Sn, irradiation growth saturates or attenuates, which has been attributed to the trapping of vacancies on solute atoms. The effect of Sn on nucleation and growth of <c>-component loops remains unclear due to a lack of microstructural evidence. Sn, which is the major alloying element in Zircaloys and Excel, has been found to undergo irradiation induced precipitation which in turn results in the reduction of Sn supersaturation as a solute. Sn precipitation might have a two-fold effect on the formation of <c>-component loops. Reduction in Sn supersaturation results in a change in the c/a ratio; this has not previously been explored in detail, due to the small change in the c/a ratio (0.06%) associated with the small concentration of Sn in Zircaloys. Reference Griffiths and Gilbert15 In the case of Excel where the Sn concentration is higher (3.5 wt%) as compared to Zircaloy-2 and Zircaloy-4 (1.5%), however, this change may be more significant at lower doses, potentially affecting the nucleation and stability of <c>-component loops. The vacancy trapping effects of Sn on irradiation growth observed by Rogerson, Reference Rogerson29 and then discussed in detail by Hood, Reference Hood30 and Griffiths, Reference Griffiths8 remain to be explored experimentally. The effect of Sn which is present in the solid solution in the α phase of Zircaloy-2, Zircaloy-4, and Zr Excel alloys on the irradiation growth in Zr–(0.1–0.5%) Sn and Zircaloy-2 at 80–280 °C has been reported by Rogerson. Reference Rogerson29 The rapid attenuation of growth observed in Zr–1.5% Sn and Zircaloy-2 at 80 °C after an initial rapid positive growth transient was attributed to the enhanced point defect recombination caused by trapping of vacancies at solute Sn atoms. This vacancy trapping mechanism has been further explained in detail by Hood Reference Hood30 in terms of microstructure. Sn in the form of small clusters, as opposed to individual Sn atoms, may act as preferential trapping sites for the vacancies and hence may affect the vacancy dislocation loop formation and growth. Observation of <c>-component loops in relatively pure Zr, Reference Griffiths and Gilbert15 demonstrates that Sn cannot solely be responsible for irradiation growth, but it is clear that the presence of Sn is one of the factors significantly affecting irradiation growth.
It should be noted that <c>-component loops are observed even at low fluences (0.1 × 1025 n/m2, E > 1 MeV), in annealed Zr Excel and Zircaloy-2, which have nearly constant strain rates with increasing fluence. Reference Griffiths8 The higher growth exhibited by the Excel alloy compared with Zircaloy-2 has been attributed to differences in texture and the smaller grain size of Excel. Reference Griffiths8 For Zircaloy-2, the formation of <c>-component loops has been studied and correlated with the irradiation enhanced redistribution of Fe, and dissolution of secondary phase particles. Reference Griffiths8 In the case of Excel, however, the chemistry of the α phase is significantly different from that in Zircaloy-2, due to the higher amount of Sn in the former. Additionally, the alloying elements present in the β phase of Excel might have played a role, resulting in the different irradiation behavior of Excel, which has yet to be studied.
Hence while some understanding of the factors influencing <c>-component loops does exist, extensive experimental microstructural studies are still required to improve our understanding of the complex relationship between the formation of <c>-component loops and the intrinsic properties of Zr alloys, irradiation variables, and microstructural evolution.
The irradiation behavior of materials can be modified by adding alloying elements in the form of solutes, which may reduce the mobility of defects, and hence enhance the recombination possibilities for vacancy/interstitial defects. Reference Lee, Hwang, Yasuda and Kinoshita22 The state of the alloying elements in an alloy can strongly influence the behavior of irradiation induced point defects, such as their migration characteristics, their interactions with one another and also with extended defects such as dislocations, grain boundaries, and precipitates. Reference Lee, Hwang, Yasuda and Kinoshita22 In irradiated materials, the point defect concentrations and their diffusion are of prime importance in determining the fitness of materials for specific applications in the irradiation environment. Reference Hood30 It is therefore important to know and understand the effects of alloying element distribution either in the form of solutes or as SPPs. Zr alloy Excel is different in chemistry from other Zr based alloys, and no such study has been conducted so far where Nb, Mo, and Fe rich precipitates were all present and studied under irradiation.
Recently, Sattari et al. Reference Sattari, Holt and Daymond31 has conducted a series of experiments to study the mechanical properties of several different heat treated Excel microstructures under nonirradiation conditions. Several starting microstructures were investigated in terms of mechanical properties. An optimized microstructure of Excel in terms of best strength and hardness has been achieved through 2 h solution treatment at 890 °C followed by one hour aging at 450 °C. SPPs grown in Excel after a long term aging treatment can be expected to have significant effects on the microstructural evolution of Excel and formation of <c>-component loops under irradiation, as discussed in the previous paragraph.
In the present study, two microstructures have been selected to investigate microstructural stability under irradiation at service temperatures representative of both REC (∼400 °C) and HEC (∼80 °C) applications within a future SCWR design. Reference Chow and Khartabil4 In situ heavy ion irradiation has been used to simulate neutron damage effects in Excel. Our aim is to study the effect of the initial state of alloying elements, whether in the form of solid solution, or concentrated in SPPs, on the formation of <c>-component loops. Nucleation of <c>-component loops and their relationship to the parent microstructure has been recorded by in situ transmission electron microscopy (TEM) under heavy ion irradiation which has been subsequently correlated with the irradiation induced microchemical changes measured by ex situ EDS mapping. The microstructural controlling factors are highlighted by making comparisons between the two microstructures of the same base alloy with different distributions of alloying elements. The discussion will be mainly focused on the role of alloying elements, and their relation to the formation of <c>-component loops, as a function of irradiation temperature.
II. MATERIALS AND METHODS
Under as-received conditions, Excel is a dual phase alloy 87% α hcp and 13% β body-centered cubic (bcc). Reference Sattari, Holt and Daymond32 Samples with the dimensions of 10 mm × 5 mm × 5 mm were cut from a pressure tube for subsequent solution and aging heat treatments. Heat treatment experiments were performed in flushing argon atmosphere with 99.999% purity inside a quartz tube in a LINDBERG/BLUE Mini-Mite™ tube furnace. The temperature of the samples was measured using an Inconel sheathed K-type thermocouple inserted into the sample. The samples were first solution treated for two hours at 890 °C followed by water quenching. The resulting microstructure from this heat treatment is comprised of about 29% primary α-Zr and 71% acicular martensitically formed secondary α′. Details of phase fraction calculations and solution treatment can be found elsewhere. Reference Sattari, Holt and Daymond32 One set of the solution treated samples was then aged for one hour at 450 °C [hereafter called water quenched (WQ) samples], whereas the second set of samples was aged at 500 °C for 550 h [hereafter called over aged (OA) samples]. Thin foils were sectioned from both of the heat-treated samples in the axial-transverse direction which were then ground down to 80 micrometers thickness. Standard 3 mm TEM disc samples were punched and electropolished at −40 °C in a Tenupol-5 in electrolyte of 10% perchloric acid and 90% methanol. In addition, STEM imaging and EDS spectrum mapping were carried out on both the irradiated and nonirradiated WQ samples using an aberration-corrected field-emission gun (scanning) transmission electron microscope (FEI Titan G2 S/TEM “ChemiSTEM,” Hillsboro, OR) at the University of Manchester. EDS analysis on the OA samples was conducted using a 300 keV high resolution TEM/STEM FEI Titan 80-300 LB at the Canadian Center for Electron Microscopy (CCEM).
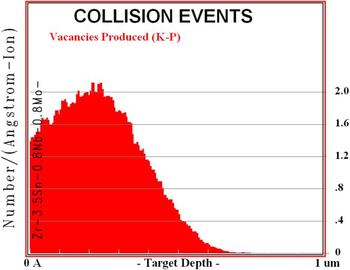
Damage calculations were carried out using the Monte Carlo simulation code named Stopping and Range of Ions (SRIM) 2008, Reference Ziegler, Biersack and Littmark33 using a displacement energy of 40 eV as specified for Zr. Reference Was34 The Kinchin–Pease option of SRIM was used to determine the damage in terms of displacement per atom (dpa) as suggested by Stoller et al. Reference Stoller, Toloczko, Was, Certain, Dwaraknath and Garner35 The SRIM damage profiles are shown in Fig. 1. Damage level can be calculated in terms of dpa using the following formula: Reference Li, Kirk, Baldo, Xu and Wirth36
 $${{{\rm{dpa}} = \varphi \times {{10}^8} \times {\rm{Damage}} - {\rm{rate}}} \over N}\quad ,$$
where
 $\varphi$
is the fluence in ions/cm2, the damage rate is in vacancies/ion/Å obtained with SRIM, and N is the atomic number density in atoms/cm3.
Damage profile of 1 MeV Kr++ ions in Zr, taken by SRIM 2008, used for the damage calculation.

In situ heavy ion irradiation experiments were conducted at the IVEM-Tandem Facility at Argonne National Laboratory. The facility includes a Hitachi H-9000NAR transmission electron microscope interfaced to a 2 MV tandem ion accelerator. TEM samples were mounted in a double tilt heating holder and irradiated at 100, 300, and 400 °C with 1 MeV Kr2+ ions to a maximum total dose of 10 dpa. All in situ dynamic TEM observations of damage evolution were performed at a 300 kV operating voltage. Irradiation was paused at different dose levels to characterize the damaged microstructure. During the in situ TEM analysis, great care was taken to maintain consistent imaging conditions to allow comparisons of the damage structures of one specimen with another at similar dose levels or of one area at different dose levels.
Ex situ characterization of the mean loop size and density was performed on a Philips CM 20 electron microscope at an operating voltage of 200 kV. Areal loop density (number of defects per unit area) and mean loop size were measured three times in each micrograph and mean loop size was calculated. The error bars in the plot represent the mean standard deviation in the measurements.
III. RESULTS
A. Preirradiation microstructures
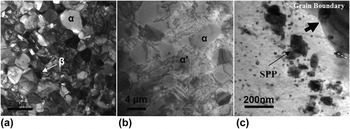
The as-received Zr-Excel consists of a dual phase microstructure, with mainly 87% α phase and 13% β phase, as shown in Fig. 2(a). After solution and aging treatment, the microstructure comprised mainly three constituents as shown in Fig. 2(b): (i) α phase, (ii) martensitically formed secondary α′, and (iii) β phase ligaments present at the α grain boundaries. The ratio of the volume fraction of α phase martensitically formed secondary α′ is approximately 29 and 71%. Reference Sattari, Holt and Daymond32
Preirradiation microstructure of Excel. (a) As-received Excel, (b) Excel after two hours of solution treatment at 890 °C followed by water quenching and one hour aging at 450 °C showing α and martensitically formed secondary α′ phases, and (c) larger SPP formed after being solution treated and aged for 550 h at 500 °C.

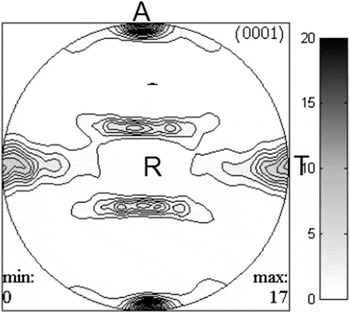
The (0001) pole figure determined by neutron diffraction texture measurement is shown in Fig. 3. Note the texture of the foil exhibits a high density of 0001 poles close to the axial and transverse direction of the foil.
The 0001 pole figure of Excel in axial-transverse direction, after two hours solution treatment at 890 °C followed by water quenching and one hour aging at 450 °C.

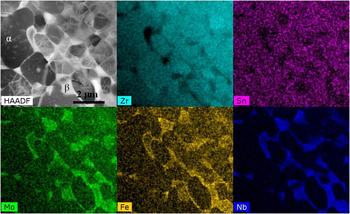
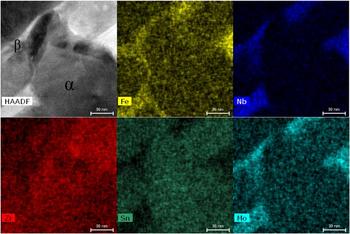
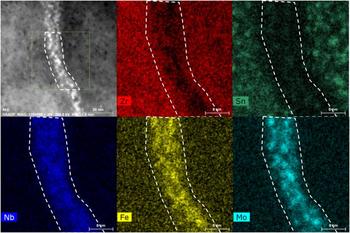
The results of the EDS mapping on as-received and WQ Excel prior to irradiation are presented in Fig. 4 and Fig. 5, respectively, which show the distribution of the alloying elements in the three constituents. It is evident from the EDS spectrum images that Sn is the major alloying element distributed uniformly in primary and secondary α phase (α′) while it is absent in the β ligaments; this uniform distribution suggests that it is in solute form. The β ligaments are instead rich in Nb, Mo, and Fe, again distributed uniformly.
EDS mapping on both α and β phases in as-received Excel, showing the distribution of alloying elements. The β phase is Fe, Mo, and Nb enriched, whereas the α phase is rich in Sn only.

EDS mapping on both α and β phases in WQ sample, showing the distribution of alloying elements before irradiation. The β phase is Fe, Mo, and Nb enriched, whereas the α phase is rich in Sn only.

Martensitic phase transformations in Zr–n% Nb alloys have been studied upon quenching from the β phase. Reference Banerjee and Krishnan37–Reference Banerjee and Krishnan39 For example, Banerjee and Krishnan Reference Banerjee and Krishnan37 report the formation of acicular martensite with a HCP crystal structure after quenching Zr–n% Nb alloys from the β phase. It was shown that the morphology of the martensite phase strongly depends on the concentration of β stabilizing elements (Nb) in Zr. In the present study, however, the samples have been aged for one hour at 450 °C after quenching. Aging studies in Ti and Ti alloys show that both HCP martensite (α′) and orthorhombic martensite (α″) phases decompose into α phase and a solute rich β phase due to partitioning of the alloying elements during the aging process. Reference Sato, Matsumoto, Kodaira, Konno and Chiba40,Reference Mantani, Takemoto, Hida, Sakakibara and Tajima41 In the present study, however, no change in martensite morphology or β phase precipitation was observed after aging at 450 °C for one hour. We therefore assume that the martensitically formed secondary α′ with HCP structure is still present after aging at 450 °C; this assumption does not impact the results presented in this paper. The transformation behavior of Zr based alloys strongly depends in particular on the presence of alloying elements; the combination of slow diffusing alloying elements (Nb, Mo, and Sn) present in Excel means that a detailed study on the phase transformation kinetics after quenching from the β phase would be required to address this issue.
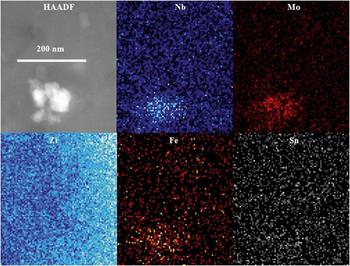
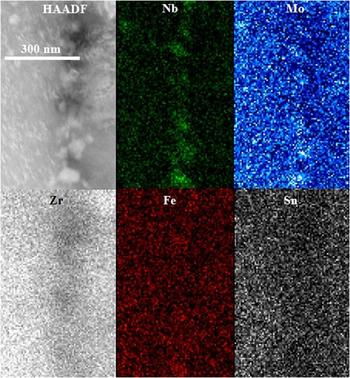
The aging at 500 °C for 550 h results in the precipitation and growth of large SPPs in both the α phase and martensitically formed secondary α′, as shown in Fig. 2(c). In the α phase, these precipitates are distributed mainly near the α/martensite grain boundaries, with a smaller size in the interior of the grain (∼10–20 nm) and larger precipitates present in the vicinity of grain boundaries (100–200 nm). The preferential precipitation of SPPs near grain boundaries arises due to the transport of solute from grain boundary β phase, which contains most of the solute element concentration prior to the aging heat treatment. STEM mapping on these precipitates in OA samples is shown in Fig. 6; these precipitates are Nb, Mo, and Fe rich, and slightly depleted in Sn. The chemical composition of these precipitates has been calculated as Zr–29 at.% Mo–25 at.% Nb–3 at.% Fe, which is consistent with previous findings presented elsewhere. Reference Sattari, Holt and Daymond31 The atomic percent composition of these precipitates suggests a stoichiometry of Zr3(Mo,Nb,Fe)4 with a hexagonal crystal structure. Reference Sattari, Holt and Daymond31 Lee et al. Reference Lee, Hwang, Yasuda and Kinoshita22 have reported the formation of hexagonal Mo rich precipitates in Zr–1 wt% Nb–1Sn–0.1Fe–0.5Mo alloy, after annealing at 600 °C for 8 h.
EDS mapping on the SPP in OA sample before irradiation. Elements are mentioned in each map.

B. Irradiation temperature (T irr) = 400 °C
To observe the nucleation and growth of <c>-component loops, bright field micrographs were taken close to two beam kinematical conditions at different dose steps from 0 to 10 dpa, with g ∼ 0002. Under this type of diffraction condition, only <c>-component dislocation loops are visible. When calculating the defect densities under bright field imaging conditions, some black dots are also visible as seen in Fig. 7. These dots are not considered as dislocation loops, as <c>-component loops show a distinct alignment parallel to the trace of basal plane of HCP crystal. Only the elongated defect features in the form of line segments parallel to the trace of the basal plane are considered as dislocation loops.
Series of BF micrographs taken during irradiation at 400 °C in WQ sample, showing the formation of <c>-component loops. g ∼ 0002.
 $B \sim \left[ {01\overline 1 0} \right]$
.

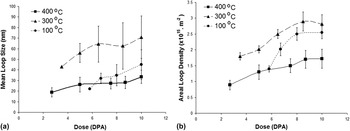
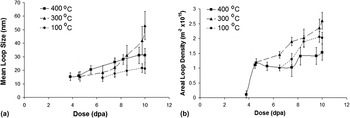
Figure 7 shows the series of bright field (BF) micrographs taken during irradiation at 400 °C in WQ samples. Before irradiation, the microstructure shows a clean and resolvable defect/dislocation and hydride free surface. As the irradiation starts, the microstructure remains unaltered until a dose of 2.7 dpa. After 2.7 dpa <c>-component dislocation loops start to appear in the form of small line segments aligned with the trace of basal plane. The TID was established based on when the <c>-component loops start to be visible in TEM bright field images. The nucleation of <c>-component loops was confirmed in neighboring grains (4–5 grains on average) with similar diffraction g = 0002 to the grain under in situ observation. After nucleation, the observable mean diameter (later called loop size) of these loops was ∼18 nm. As irradiation continues to 10 dpa, the mean size and density of these loops continue to increase. The final mean loop size was recorded as 33 nm at 10 dpa. Mean loop size and areal defect density of these loops have been plotted as a function of dose for WQ samples and are shown in Figs. 8(a) and 8(b), respectively.
(a) Mean loop size plotted as a function of dose for each irradiation temperature for WQ samples. (b) Areal defect density plotted as a function of dose at each irradiation temperature for WQ samples.

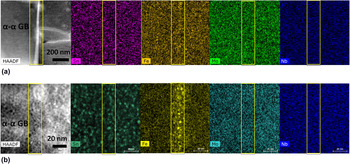
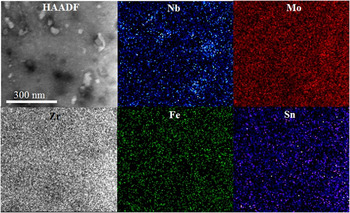
To study any microchemical changes in the WQ sample irradiated to 10 dpa at 400 °C, both α and β phases were analyzed after irradiation. EDS mapping of a primary α grain shows that there are clusters of Sn formed during irradiation, as shown in Fig. 9, whereas, at α–α grain boundaries, where β phase ligaments were absent before irradiation, small Fe rich clusters (∼3 nm in size) have been observed.
EDS mapping on an α–α grain boundary where the β phase is absent, in WQ sample, showing segregation of Fe clusters along the grain boundary after irradiation to 10 dpa at 400 °C, and formation of small Sn clusters in the α phase after irradiation to 10 dpa at 400 °C.

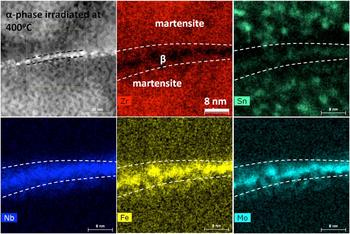
Grain boundaries (α–β) in the WQ sample are solute rich (Mo, Nb, and Fe) due to the presence of the β phase on the boundaries. After irradiation to 10 dpa at 400 °C, Fe and Mo were seen to form clusters, whereas Nb stays uniformly distributed as shown in the STEM-EDS images in Fig. 10.
STEM mapping showing irradiation induced changes in the grain boundary β phase at 400 °C after 10 dpa in WQ sample. Mo and Fe segregate to small clusters whereas Nb remains uniformly distributed. Sn rich clusters are also visible in the secondary α phase.

The in situ irradiation experiment on the OA sample at 400 °C shows the formation of <c>-component loops which have been recorded with g = 0002, as presented in Fig. 11. It is evident from the micrographs that <c>-component loops nucleate at 3.8 dpa. At the time of appearance, the mean size (diameter) of these loops was measured as 15 nm. The mean loop size after 10 dpa was 31 nm which is slightly smaller than those observed in the WQ samples. The mean size and areal defect density of these loops have been plotted as a function of dose as shown in Figs. 12(a) and 12(b), respectively.
Series of bright field micrographs showing the formation of <c>-component loops in OA sample at 400 °C under g = 0002,
 $B = \left[ {11\overline 2 0} \right]$
.

(a) Mean loop size plotted as a function of dose for OA samples. (b) Areal defect density plotted as a function of dose at all irradiation temperatures for OA samples.

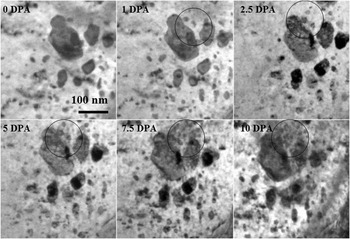
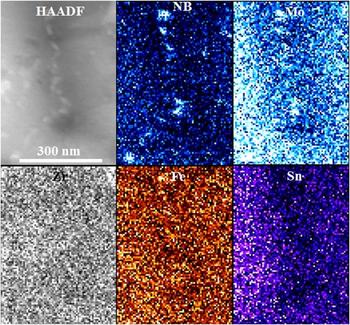
In the case of the OA samples, irradiation induced secondary phase precipitation has been observed starting from 1 dpa, as shown in Fig. 13. These small precipitates nucleate in the close vicinity of pre-existing large precipitates. The size and number of SPPs increase as the irradiation continues. STEM mapping for each alloying element in the OA sample irradiated at 400 °C is presented in Fig. 14; it shows that all alloying elements have left the SPPs due to irradiation induced dissolution, except Nb which may have undergone partial dissolution.
A series of BF micrographs taken during irradiation at 400 °C of OA material. Areas in the circles show the nucleation and growth of irradiation induced SPP in the vicinity of a pre-existing larger SPP.

STEM mapping showing the distribution of alloying elements in SPP after irradiation of OA sample to 10 dpa at 400 °C. All the alloying elements undergo irradiation induced dissolution except Nb.

C. Irradiation temperature (T irr) = 300 °C
Results of the in situ irradiation experiment conducted at 300 °C on WQ samples are presented in Fig. 15. At 300 °C, the <c>-component loops nucleate and become visible after 3.5 dpa. The initial mean loop size recorded at 3.5 dpa was ∼42 nm, which increases to 71 nm at the final dose of 10 dpa as shown in Fig. 8.
Series of BF micrographs showing the formation of <c>-component loops in WQ sample at 300 °C, g = 0002,
 $B = \left[ {01\overline 1 0} \right]$
.

At 300 °C, small Sn rich SPPs with a size of ∼5 nm were observed in the α phase of WQ sample after irradiation to 10 dpa. EDS mapping on the β phase reveals that the Nb distribution does not change significantly during irradiation at 300 °C. However, Fe and Mo appear to form clusters, similar to those observed after irradiation at 400 °C. The depletion of Sn in the β phase spreads to the neighboring α grain during irradiation resulting in a Sn denuded zone along the grain boundary (Fig. 16).
EDS mapping showing the distribution of alloying elements in both α and β phases of WQ sample after irradiation to 10 dpa at 300 °C. Elements have been labeled in each map.

A series of micrographs presented in Fig. 17 shows the nucleation and growth of <c>-component loops in the OA sample during the irradiation experiment at 300 °C. In this case, the TID for <c>-component loop increases to 4.6 dpa. The mean loop size measured after nucleation at 4.6 dpa was ∼15 nm which increases to 53 nm at 10 dpa. Contrary to the results at 400 °C, secondary phase precipitation (which was perhaps induced by irradiation) was not observed at 300 °C, however, it is evident from the STEM mapping shown in Fig. 18 that Fe does partially leave the SPP and is transported into the matrix during the irradiation.
Bright field micrographs with g = 0002,
 $B = \left[ {11\overline 2 0} \right]$
, showing the formation of <c>-component loops in OA sample at 300 °C.

STEM-EDS mapping on OA sample after irradiation at 300 °C shows the presence of Mo and Nb in the SPP whereas Fe is dissolving out of the SPP during irradiation.

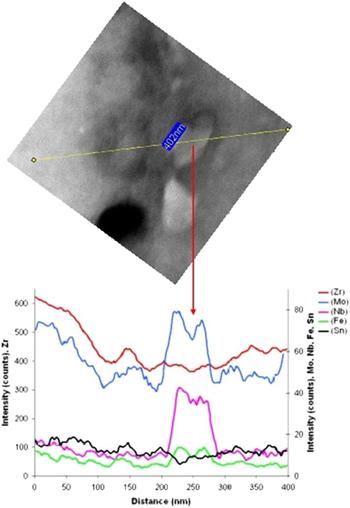
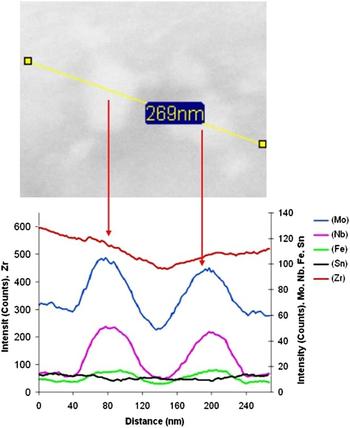
An EDS line scan analysis (Fig. 19) was carried out on the SPPs in OA samples irradiated at 300 °C, which shows a drop of the intensity in the center of the elliptical precipitate for all the alloying elements. The intensity drop in the line scan plot indicates that significant irradiation induced dissolution has occurred. The EDS line scan done on the SPP in unirradiated OA samples gives a uniform distribution of all alloying elements, as shown in Fig. 20.
EDS line scan over a SPP in OA material irradiated to 10 dpa at 300 °C. Dissolution of Nb, Mo, and Fe from the SPP is evident from the line scan plots.


D. Irradiation temperature (T irr) = 100 °C
Figure 21 shows a series of BF micrographs taken during the in situ irradiation experiment conducted on WQ samples at 100 °C. At 100 °C, the TID for the nucleation of <c>-component loops was recorded as 5.8 dpa, which is significantly higher than at 300 and 400 °C. The mean size of these loops was measured as 22 nm at 5.8 dpa, which increases to 45 nm as the irradiation continues to 10 dpa.
Series of BF micrographs showing the formation of <c>-component loops in WQ sample at 100 °C, g ∼ 0002,
 $B = \left[ {01\overline 1 0} \right]$
.

Other than the formation of <c>-component loops in the α phase, a few <c>-component loops have been observed to form and grow around 3 dpa at the pre-existing <c>-component dislocations, as shown in Fig. 22.
BF micrograph showing the formation of <c>-component loops on the pre-existing <c>-component dislocations at 100 °C and 3 dpa, g ∼ 0002,
 $B = \left[ {01\overline 1 0} \right]$
.

EDS mapping on WQ samples irradiated at 100 °C was not successful due to poor sample quality and an oxide layer that had formed during the irradiation experiment and sample handling.
In the in situ irradiation experiment on OA samples at 100 °C, the TID for the nucleation of <c>-component loops increases to 6.5 dpa as shown in Fig. 23. These loops appear as black dots first, and then develop into typical large <c>-component loops in the form of thin dislocation segments perpendicular to the basal plane. The mean size of these loops was recorded as 14 nm at 6.5 dpa which increases to 21 nm with an increment of dose to 10 dpa. No secondary phase precipitation was observed during irradiation. EDS mapping on OA samples (Fig. 24) irradiated at 100 °C shows that all alloying elements seem to stay in the SPPs. Even though no evidence of extensive irradiation induced dissolution was found, partial dissolution of Fe cannot be ruled out because it is an undersized solute and ultrafast diffuser. Reference Griffiths8
Series of bright field micrographs showing the formation of <c>-component loops during irradiation in OA samples at 100 °C. Micrographs were taken with g = 0002,
 $B = \left[ {11\overline 2 0} \right]$
.

STEM mapping showing the presence of all major alloying elements in the SPP after irradiation of OA material at 100 °C. No major chemical change is evident from the micrographs compared to the pre-irradiated sample. Note the asymmetric distribution of Sn due to thickness differences in different areas.

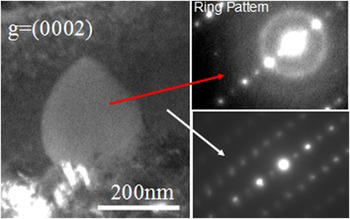
The SPPs present in OA samples behave in a different way under irradiation at 100 °C, as compared to the other irradiation temperatures. STEM mapping shows that there is no significant irradiation induced dissolution at this irradiation temperature. However, selected area electron diffraction pattern (SAEDP) analysis carried out on the SPPs shows a bright diffuse ring, as shown in Fig. 25, in contrast to the sharp diffraction pattern apparent from SPPs prior to irradiation; this suggests the occurrence of irradiation induced amorphization of the SPPs at 100 °C. SAEDP was taken on several SPPs in the 100 °C irradiated OA sample; all showed this amorphous ring. It could, however, be argued that this amorphous ring is a characteristic of oxidation on the sample surface. To overcome this potential ambiguity, diffraction patterns were taken on both the SPP and the Zr matrix; the latter shows no such diffuse ring pattern, confirming that the ring pattern does not arise due to oxidation of the sample. Hence it can be confirmed (i) that the diffraction ring in the SAEDP does come from amorphization, while (ii) STEM mapping shows the presence of all elements still in the SPPs.
DF micrographs showing a large SPP after 10 dpa at 100 °C. The diffraction pattern taken on the SPP shows a typical diffuse ring, characteristic of amorphous SPP. In contrast to the matrix, the ring is absent ruling out the ring arising due to oxidation.

IV. DISCUSSION
A. Formation of <c>-component loops and threshold incubation dose (TID)
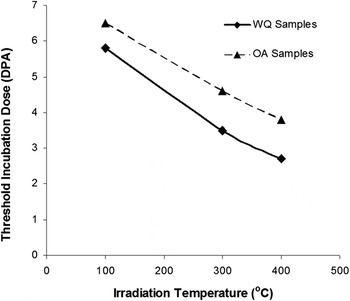
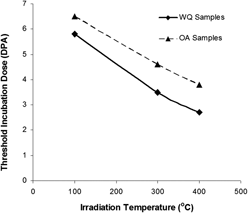
The TID for the formation of <c>-component loops is plotted as a function of irradiation temperature for both WQ and OA samples in Fig. 26, which shows that the incubation dose is strongly temperature and initial microstructure dependent. Furthermore, TID decreases with an increase of temperature.
TID for the formation of <c>-component loops plotted as a function of temperature for both WQ and OA samples. A difference in TID can be seen for the two different starting microstructures.

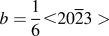
It is well established now that the <c>-component loops are faulted vacancy loops and lie in the basal plane with a Burgers vector of
 $b = {1 \over 6} \lt 20\overline 2 3 >$
and form after an incubation dose.
Reference Griffiths8,Reference Griffiths and Gilbert15
Formation of these loops and the corresponding TID depend on several factors such as the presence of alloying elements, the generation of point defects and their diffusion due to both irradiation and thermal contributions.
Reference Griffiths8,Reference De Carlan, Régnard, Griffiths, Gilbon, Bradley and Sabol21,Reference Griffiths, Loretto and Smallman42,Reference Gilbon, Simonot, Garde and Bradley43
The increase in TID with decrease of temperature can be attributed to the diffusion of alloying elements, which is decreased or even arrested at lower temperature. Interstitial solutes such as Fe play an important role by locally decreasing the stacking fault energy of Zr, which would assist the nucleation of <c>-component loops. Reference Griffiths8 The incubation period before the appearance of <c>-component loops has been linked to a critical interstitial solute concentration by Griffiths et al. Reference Griffiths, Gilbert, Fidleris, Van Swam and Eucken44 The volume of interstitial impurity concentration increases by radiation induced dissolution of alloying elements, either from intermetallic particles or from the β phase. Reference Griffiths8,Reference Griffiths, Gilbert, Fidleris, Van Swam and Eucken44 The WQ microstructure does not contain intermetallic precipitates before irradiation, but Fe is predominantly found in the β phase present along α grain boundaries. From the β phase, Fe is dispersed into the α phase during irradiation, which has been reported to occur in Excel after neutron irradiation. Reference Griffiths8 Assuming that the lowering of stacking fault energy is the mechanism of <c>-component loop nucleation, an early dissolution and redistribution of alloying elements will result in an earlier nucleation of <c>-component loops and hence in a lower TID. Other than SPP, an effect of temperature has been observed on TID.
A variation in the TID for the formation of <c>-component loops has been due to the presence of SPPs in the initial microstructure. The differences seen between OA and WQ samples as shown in Fig. 27 can be explained in terms of the dissolution and redistribution of alloying elements out of the SPPs and into the Zr matrix. In the case of OA samples, alloying elements are concentrated within the α phase in the form of SPPs, whereas in the case of WQ samples, these elements are mostly concentrated in the grain boundary β phase. The presence of alloying elements in the form of solid solution causes a decrease in the stacking fault energy, hence assisting the formation and stability of <c>-component loops. Reference Griffiths8 During irradiation, the pre-existing SPPs undergo radiation induced dissolution and the alloying elements (Nb, Mo, and Fe) are redistributed into the matrix. This redistribution of alloying elements into the matrix has been confirmed after 1 dpa at 400 °C, where irradiation induced reprecipitation of SPPs occurs, as shown in Fig. 13. As the alloying elements are redistributed into the matrix, the stacking fault energy decreases and hence <c>-component loops start to nucleate in the presence of an appropriate vacancy concentration. The dissolution of SPPs can be well explained by the model developed by Nelson et al., Reference Nelson, Hudson and Mazey45 which is based on two facts, Reference Nelson, Hudson and Mazey45 (i) irradiation can enhance solute diffusion within the host matrix and (ii) irradiation can destroy (dissolve) the precipitates.
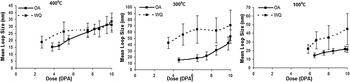
Comparison of mean loop size plotted as a function of dose at all irradiation temperatures in both OA and WQ samples.

The TID for nucleation of <c>-component loop observed in this study is consistent with previous studies of neutron and ion irradiation, where it is attributed to the dissolution and redistribution of alloying elements into the matrix. Reference Griffiths46 The point defects generated as a result of cascade collapse behave in different manners, depending on the initial microstructural environment. Dissolution of alloying elements is a thermally assisted phenomenon and occurs more readily at higher temperatures (400 °C) than at lower irradiation temperatures (100 °C). STEM mappings on OA sample at 400 and 300 °C show that Fe undergoes irradiation induced dissolution and redistribution. At 400 °C, it is reasonable to assume that Fe leaves the SPPs at a lower dose than at 300 °C, resulting in a lower TID. At 100 °C, there is no, or perhaps rather, limited dissolution and redistribution of Fe, which is reflected in the higher TID for the formation of <c>-component loops.
The results of EDS mapping are consistent with the loop nucleation observations in the OA samples irradiated at 400 and 300 °C. The EDS mapping on a SPP shows a reduction in Fe and Mo in the pre-existing SPP, compared to that found in the preirradiation SPP. Fe seems to play the most important role in the nucleation of <c>-component loops, as it dissolves into the matrix at both 400 and 300 °C. Since it is an interstitial diffuser, compared to the substitutional diffusers Nb and Mo, it is reasonable to conclude that Fe will diffuse into the matrix more rapidly at lower doses, compared to the slow diffusing elements Mo and Nb. Reference Griffiths8,Reference Hood30
The present results show the low temperature formation of <c>-component loops in Excel alloy, which are usually observed only at relatively high temperatures (>300 °C). Reference Griffiths8 Low temperature (100 °C) formation of <c>-component loops has previously been observed in Zr-Excel alloy with a different microstructure (∼60% α and 40% β, solution treated at 855 °C followed by water quenching), which was attributed to the dissolution of SPPs in the α phase and the higher solute content of Excel which stabilized <c>-component loops at 100 °C. Reference Idrees, Yao, Sattari, Kirk and Daymond23 However, the microstructure studied here does not contain such second phase particles. It is difficult to determine why <c>-component loops formed during the irradiation at such a low temperature in the present study, as no EDS microanalysis could be carried out on these samples. It is speculated, however, that Sn, which is present in the form of solid solution, may assist the formation of <c>-component loops, as has been suggested by Griffiths and Gilbert. Reference Griffiths and Gilbert15
Preferential nucleation of <c>-component loops at the pre-existing <c>-component dislocation structures is observed here and has been reported previously for Zr alloys. Reference Holt, Causey, Christodoulou, Griffiths, Ho, Woo, Bradly and Sabol47,Reference Griffiths, Gilbon, Regnard and Lemaignan48 The <c>-component loops spread out in the basal plane and their multiplication occurs primarily by the helical climb of pre-existing <c>-type dislocations. The acceleration of the elongation rate of Zr pressure tube components with increasing fluence has been attributed to an increase in the density of <c>-component dislocations, mainly by a helical climb multiplication mechanism. Griffiths et al. Reference Griffiths, Holt and Rogerson49 have also linked the accelerated breakaway irradiation growth to the increase in the <c>-component loop density by the helical climb multiplication phenomenon.
B. Mean loop size and defect density
Figures 8(a) and 8(b) show the variation of loop size and areal density as a function of both dose and temperature in WQ samples, respectively. The smallest observed loop size occurs at 400 °C, which is perhaps rather strange. The loop size at 400 °C can be attributed to several factors, however, it is hard to establish a clear conclusion as to the primary contribution. Smaller loop sizes at higher temperature (400 °C) in the WQ sample can be explained by a Sn-cluster to vacancy interaction mechanism. From Figs. 9 and 10, it is evident that Sn undergoes significant radiation induced redistribution, leading to cluster formation at both 400 and 300 °C in WQ samples. Sn forms tiny clusters in the α phase as it diffuses away from the grain boundary, leaving an extended denuded zone on the α–β grain boundary, where <c>-component loops both nucleate and grow. Sn cluster formation shows a significant effect on the growth and morphology of <c>-component loops. It has been explained by Hood Reference Hood30 that the effects of individual Sn atoms present as solute and Sn clusters are opposite to each other. Sn clusters act as preferential trapping and recombination sites for vacancies, lowering the vacancy concentration of the matrix. As the Sn clusters were not observed in preirradiated microstructures, the probability of vacancy trapping or recombination is low at relatively lower doses where <c>-component loops nucleate and grow. In the current study, however, the exact dose at which the Sn forms these clusters is not known. The formation of Sn rich clusters occurs due to irradiation enhanced diffusion and generation of a high density of point defects. Since this is a thermally assisted mechanism, it is reasonable to assume that these clusters will form at a relatively lower dose at higher temperature of 400 °C, as compared to 300 °C. At higher doses where the Sn clustering occurs, vacancies may be trapped on these clusters reducing the vacancy concentration of the matrix, as observed by Buckley and Manthorpe. Reference Buckley and Manthorpe50 Trapping and recombination of vacancies by Sn clusters hence result in decreased loop growth rates and therefore a smaller defect size. In the present case, irradiation induced clustering of Sn is more obvious at 400 °C (Figs. 9 and 10), than at 300 °C (Fig. 16). These tiny clusters of Sn act as strong trapping sites for irradiation induced vacancies, lowering the vacancy concentration. The limited supply of the vacancies to <c>-component loops results in a smaller loop size at 300 °C compared to that seen at 400 °C.
In addition, enhanced vacancy mobility at higher temperatures can play an important role in <c>-component loop morphology, where vacancies are mobile enough to move across larger distances. The annihilation of vacancies can then occur at alternative sinks such as grain boundaries, impeding the loop growth. Jostsons et al. Reference Jostsons, Kelly, Blake, Farrel, Sprague and Kramer14 have discussed the stability of vacancy loops in Zr by the mechanism of thermal emission of vacancies. It has been pointed out that the vacancy loops shrink in size and even can be eliminated after nucleation in the cascade collapse due to vacancy thermal emission at higher irradiation temperatures. The vacancy thermal emission mechanism might have occurred at the early stages of nucleation of loops causing elimination of vacancy type loops after nucleation resulting in lower defect density at 400 °C.
Similarly, Dubinko and Klepikov Reference Dubinko and Klepikov51 have proposed that vacancies can be emitted from defects (vacancy dislocation loops, voids, etc) by the occurrence of collision events in the vicinity of defects; subsequent diffusion (a thermally activated process) of the ejected vacancies under certain conditions (dose, dose rate, temperature, etc) may then result in annihilation of vacancy dislocation loops or voids. Reference Dubinko and Klepikov51 This may explain the limited stability of vacancy type <c>-component dislocation loops at 400 °C.
The large mean loop size at 300 °C and the small loop size at 100 °C can be explained in terms of thermal and irradiation enhanced diffusion of irradiation induced point defects (both vacancy and self-interstitial atoms). Cascade collapse results in the bulk creation of Frenkel pairs of freely migrating point defects and point defect clusters. Reference Dubinko and Klepikov51 The behavior of these point defects depends on their environment, such as temperature, impurities, and extended defects (i.e., point defect sinks such as dislocations and grain boundaries). Reference Azevedo3 At 300 °C, the mobility of point defects is higher than at 100 °C, leading to a large mean free path of point defects. These point defects migrate across large distances in the lattice and consequently annihilate rapidly on sinks such as small point defect clusters, the sample surface, grain boundaries, and dislocations. At 100 °C, however, the mobility of point defects is reduced so that the elimination rate on sinks such as already formed small point defect clusters is decreased. This leads to a higher concentration of point defects in the material; and hence to a high nucleation rate of point defect clusters, which then leads to the higher density of loops at lower temperatures. In the present case, however, there are anomalies in the defect size and density behavior; the general trend in metals and alloys, that loop size increases with an increase of temperature and loop density decreases with an increase in temperature, has not been observed here.
Figure 12 shows the variation of loop size with both dose and temperature in OA samples; a trend of increase in loop size with increase of temperature and dose is seen. Loop size increases with dose increment at all irradiation temperatures. Cascade collapse results in the bulk creation of Frenkel pairs of freely migrating point defects (V/SIA) and point defect clusters. Reference Dubinko and Klepikov51 The subsequent evolution of the microstructure is considered to be dictated by thermally activated processes such as point defect diffusion, Reference Dubinko and Klepikov51 which as noted depends on the microstructure (temperature, impurities, and extended defects, i.e., point defect sinks such as dislocation and grain boundaries). At higher temperatures, the mobility of these point defects is high, leading to a larger mean free path. Hence point defects migrate across large distances and consequently annihilate at sinks, such as previously formed small point defect clusters, the sample surface, grain boundaries, and dislocations; this last sink then leads to a higher growth rate of dislocation loops at higher temperatures. At lower temperatures, however, the mobility of point defects is reduced so that the elimination rate to sinks is decreased. This leads to a slower growth rate of loops and to a higher concentration of point defects in the material. This high concentration of point defects in turn induces a high nucleation rate of point defect clusters, leading to a higher density of loops at lower temperatures.
The lower defect densities at 400 °C as compared to 300 and 100 °C in the OA sample can be attributed to the presence of Mo in the solid solution. The contribution of Mo to the behavior of Zr alloys is not well understood. Reference Williams, Ells and Dixon52,Reference Carpenter and Walters53 Mo rich SPPs in Zr based alloys are thought to be beneficial in improving the corrosion resistance of Zr alloys, and coarsening of these SPPs may weaken corrosion resistance, however, Mo in solid solution, on the contrary, counter-balances the kinetics of microstructural coarsening by diminishing the diffusivity. Lee et al. Reference Lee, Hwang, Yasuda and Kinoshita22 reported that the addition of 0.5 wt% Mo to Zr–1 wt% Nb–1% Sn–0.1% Fe decreased the initial defect nucleation rate and suppressed the growth rate of defects. These observations were attributed to retardation of diffusion by Mo. In our observations, at 400 °C, Mo dissolved completely from the SPPs into the matrix. The dissolved Mo seems to retard the loop nucleation rate, which is reflected in the density data at 400 °C. At lower temperatures, however, Mo does not dissolve completely from the SPPs into the matrix, hence defect densities are found to be higher than at 400 °C.
There is a significant difference in the defect size of <c>-component loops between the WQ and OA samples (Fig. 27), which shows the potential effects of lattice chemistry and distribution of alloying elements. The presence of alloying elements in the form of SPP results in smaller loop sizes. In the case of the OA sample, the radiation damage first dissolves and then redistributes the alloying elements from the SPPs. At 400 °C, there is thermally assisted precipitate dissolution, causing a higher solute concentration in the matrix. Mo reduces the defect nucleation and growth rate of irradiation induced defects in Zr. Also, very fine Sn rich clusters may act as preferential trapping and recombination sites for vacancies, as observed in the WQ samples. An increase in defect density and decrease in loop size by the addition of Nb in Zr have been reported by Buckley and Manthorpe. Reference Buckley and Manthorpe50 It has been reported that due to the addition of substitutional solutes in Zr, the loop growth rate is decreased significantly, which was attributed to the change in the point defect mobility and enhanced vacancy–interstitial recombination due to the presence of Sn, as suggested by Hood. Reference Hood30 In the case of the WQ sample, Sn undergoes irradiation induced precipitation, whereas Mo and Nb remain concentrated in the β phase. On the other hand, in the OA sample, Mo undergoes irradiation induced dissolution from the SPPs into the α phase matrix. As Sn is present in the α phase in both of the microstructures, it is Mo which must create the difference in the loop size between OA and WQ samples.
C. Irradiation induced clustering of alloying elements
STEM-EDS mapping on WQ samples shows the formation of Sn rich clusters at 400 and 300 °C, which was uniformly distributed in the form of solute in the α phase before irradiation.
Abriata et al. Reference Abriata, Bolcich and Arias54 have reported that the Zr–Sn binary system with the Zr4Sn + βZr → αZr peritectoid reaction at 962 °C has the potential for precipitation of Zr4Sn intermetallic phase at room temperature for Sn concentrations above 3 wt%. In a recent reassessment of the Zr–Sn binary system, Toffolon-Masclet et al. Reference Toffolon, Brachet, Servant, Legras, Charquet, Barberis and Mardon55 reported the solubility of Sn in α-Zr as 8.2 and 6.9% at 900 and 600 °C, respectively. Similarly, Carpenter and Walters Reference Carpenter and Walters53 showed that precipitation does not occur in binary Zr–Sn alloys with less than 9% Sn. This implies that Sn precipitation would not occur before irradiation in Excel (3.5 wt% Sn). However, during irradiation, the substitutional Sn diffuses in Zr by a vacancy driven mechanism Reference Hood and Schultz56 ; radiation induced diffusion may cause a supersaturation of Sn in localized areas, resulting in cluster formation.
Radiation induced precipitation of Sn has been reported in other Zr alloys after neutron irradiation. Reference Griffiths8,Reference Woo and Carpenter57 For example, Griffiths Reference Griffiths8 has reported the formation of ZrSn(Fe) precipitates in Excel alloys due to the supply of Fe from the β phase following neutron irradiation at about 416 °C. Similarly, the Fe content in the β phase might have increased in localized areas resulting in weak segregation to clusters. Extended Sn denuded zones at the grain boundary observed at 400 and 300 °C (Figs. 10 and 16) are presumably related to the extensive Sn precipitation in the interior of the α grains.
Nb precipitation was not observed either in α or β phases, rather it stays uniformly distributed in the form of solute in the β phase, despite being a substitutional element like Sn and Mo.
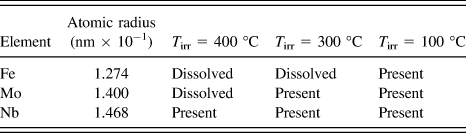
In the β phase, the Mo seems to form small clusters after irradiation at 300 °C. The difference in the clustering behavior of Nb and Mo can be related to their atomic radii, Table I. Although, Nb and Mo are both substitutional elements in Zr, due to the smaller atomic radius of Mo compared to Nb, Mo will have a higher diffusion rate in Zr, resulting here in the formation of clusters. The only possible Mo based intermetallic phase in β Zr is ZrMo2, according to the phase diagram of Zinkevich and Mattern, Reference Zinkevich and Mattern58 however, in the present study, the crystal structure of these clusters could not be determined.
Summary of EDS data indicating status of element within the SPP. Atomic radii values adapted from Ref. Reference Hood30.

D. Irradiation induced destabilization of SPP
SPPs which are stable under purely thermal conditions can be destabilized under irradiation. In the current study, three types of irradiation effects have been observed on the SPPs as a function of temperature: (i) irradiation induced dissolution, (ii) irradiation induced precipitation, and (iii) irradiation induced amorphization. STEM-EDS results show that the large pre-existing precipitates undergo irradiation induced dissolution at 400 and 300 °C, whereas irradiation induced amorphization occurs at 100 °C. Irradiation induced precipitate dissolution can be explained by two mechanisms: (i) recoil dissolution and (ii) enhanced defect concentrations in SPPs or matrix under irradiation. Recoil dissolution is caused by the ejection of atoms in the core of the cascade, from a SPP into the matrix, resulting in the mixing of the precipitate and matrix atoms close to the SPP–matrix interface. This process strongly depends on the displacement rate and temperature. Thermodynamically, solute atoms tend to cluster themselves in the SPP, however, if the rate of ejection is higher than the rate of reclustering, the SPP undergoes irradiation induced dissolution. If the atomic flux crossing out of the precipitate is higher than the flux crossing into the precipitate, the precipitate dissolves, if the other way around, it grows. The dissolution rate is directly proportional to the displacement rate, which is higher in the case of ion irradiation (∼10−3 dpa/s) than neutron irradiation. Reference Nelson, Hudson and Mazey45,Reference Russell59
An EDS line scan in the sample irradiated at 400 °C shows that the SPP underwent irradiation induced dissolution. Although the exact change in the composition of the SPP with irradiation is not known, from the STEM mapping on the SPP it is evident that Fe and Mo leave the SPP preferentially, whereas there is still an elevated concentration of Nb present in the SPP. In contrast, at 300 °C, Fe is fully redistributed out from the SPP, whereas Mo and Nb are only partially dissolved from the SPP into the α matrix, as shown in Fig. 18. These observations suggest that there is a difference in elemental dissolution rates. The atomic flux ejected out from a precipitate during the recoil dissolution will depend not only on the displacement rate and temperature, but also on the nature of alloying element itself. The differences between the response of Fe, Mo, and Nb could perhaps arise due to differences in their atomic size. The STEM mapping results and the atomic radii Reference Hood30 of major alloying elements are summarized in Table I. The absence of Fe/Mo and the presence of Nb in the irradiated precipitates as shown in Figs. 14 and 18 can also be attributed to the difference in diffusion rates between Fe, Mo, and Nb in a Zr matrix. Reference Doriot, Gilbon, Bechade, Mathon, Legras and Mardon60 Fe has a small atomic radius and is a fast diffuser, present in the interstitial state in irradiated Zr alloys and hence may diffuse out of intermetallic precipitates during irradiation. Reference Griffiths, Gilbert and Carpenter61
At high temperature (400 °C), the SPPs dissolve and elements diffuse into the surrounding matrix by irradiation enhanced thermal diffusion of point defects. Reference Doriot, Gilbon, Bechade, Mathon, Legras and Mardon60 Eventually, a supersaturation of solute occurs, resulting in irradiation induced precipitation of SPPs elsewhere. The dose required for solute supersaturation has been recorded as 1 dpa, based on when irradiation induced SPPs are first observed (Fig. 13). Supersaturation of solute occurs in the close vicinity of pre-existing SPPs that are undergoing irradiation induced dissolution. It should be noted that the dose rate seen here is high compared to that seen during typical neutron irradiation. There is thus a strong supply of solute atoms from the SPPs into the matrix and little time for diffusion of solutes further into the grain, which thus causes an early supersaturation of solute near the pre-existing SPPs, compared to other parts of grains. In a detailed study of impurity diffusion in α-Zr, Hood Reference Hood30 demonstrated that smaller atoms diffuse faster as compared to larger atoms, hence the ready dissolution of Fe from the SPPs.
A wealth of literature is present on the behavior of Nb rich SPPs in Zr alloys. A coarsening of Nb rich SPPs in Zr–2.5Nb alloy has been reported by Nuttal and Faulkner Reference Nuttall and Faulkner62 after electron irradiation, which was attributed to the thermally driven coarsening mechanism assisted by irradiation enhanced diffusion. Our observations, however, show dissolution rather than coarsening and can be explained with the theoretical treatment for irradiation stability of solute rich precipitates at equilibrium in a substitutional binary alloy proposed by Russel. Reference Russell59 According to Russel's model, in the presence of excess vacancies produced by irradiation, precipitate growth is encouraged when the atomic volume of the precipitate exceeds that of the matrix, and conversely, dissolution is favored when the precipitate atomic volume is less than the matrix. Reference Russell59,Reference Nuttall and Faulkner62 Kruger and Adamson Reference Kruger and Adamson63 have investigated SPP behavior in several Zr based alloys including an alloy similar to Zr-Excel (named XLL) irradiated to fluences of (0.85–1.5) × 1025 n/m2 (E > 1 MeV) at ∼286 °C. Before irradiation, XLL contained spherical, intragranular precipitates that contained Mo, Nb, Fe, and Zr. These SPPs were identified as Mo2Zr laves phase with a considerable concentration of Nb and Fe. Depletion and diffusion of Fe into the matrix were reported, however, the Nb and Mo concentration ratio remained unchanged. The appearance of precipitates was not appreciably changed by irradiation, making it difficult to determine the dissolution. Reference Kruger and Adamson63 These observations are somewhat consistent with our results, as our TEM analysis did not show significant alteration in the appearance of the SPPs and that the Fe leaves the SPPs at 400 and 300 °C. In regards to Nb and Mo, our observations differ from those reported by Krugar and Adamson, Reference Kruger and Adamson63 since STEM mapping and line scan analysis provide strong evidence of Nb and Mo dissolution. However, Mo seems to diffuse at a faster rate than Nb, which is feasible since it is unlikely that Mo and Nb diffuse at an identical rate Reference Kruger and Adamson63 (experimental data are not available). The compositional gradient observed within the irradiated precipitates, and the reprecipitation of SPPs, makes the dissolution process obvious at 400 °C. In the current investigation, there was no direct evidence on Nb dissolution/redistribution at 300 °C, but minor dissolution of Nb has been inferred in the Zr–2.5Nb alloy after irradiation at 295 °C, Reference Kruger and Adamson63 making it conceivable that dissolution of Nb may have occurred in Excel at 300 °C as well.
At 300 °C after 10 dpa, all of the alloying elements seem to still be present in the precipitates, with the exception of Fe. There may be limited irradiation induced dissolution of precipitates at 300 °C, but due to the relatively low temperature, significant changes in the composition of the precipitates are not seen. Irradiation induced dissolution, diffusion, and reprecipitation are thermally activated processes which are enhanced by irradiation, resulting in the differences between 400 and 300 °C. Hence it is reasonable to assume that at 300 °C, radiation induced dissolution occurs, but not to an extent to cause significant departure of the elements from the SPPs, as evident from the STEM mapping. The rate of dissolution may be slower than at 400 °C due to the more limited diffusion of point defects, which is also consistent with the appearance of <c>-component loops at a higher dose at 300 °C than at 400 °C.
E. Irradiation induced amorphization
In the present study, it is clear that SPPs remain crystalline at intermediate and higher temperature, due to a competition between the irradiation induced disordering and thermally driven reordering of the structure. At higher temperatures, thermal reordering is rapid enough to overcome radiation induced disordering; the SPP remains crystalline, however, the microchemistry changes due to dissolution effects. At lower temperatures, a ballistic interchange of alloying elements and Zr across the SPP–matrix interface may cause the stoichiometry changes in the SPP resulting in amorphization. Reference Onimus, Béchade and Konings64
Irradiation induced amorphization is dependent on several factors including but not limited to temperature, dose and dose rate, and irradiating ion species. Reference Motta65 In ion irradiation, a high density of energy is deposited on collision cascades accumulating damage that is difficult to anneal with the available thermal assistance. Dose rates in ion irradiation are typically several orders higher than that during neutron irradiation, so annealing through thermal diffusion occurs with difficulty, causing easier amorphization under ion irradiation than under neutron irradiation. The ratio of collisional displacement to thermal jump is the most important factor in controlling the amorphization process. In the present case, ion irradiation at a high dose rate (∼10−3 dpa/s) and at a low irradiation temperature (100 °C) causes a significant increase in the ratio of collisional displacements to thermal jumps, making crystalline SPPs thermodynamically less favorable than the amorphous phase. Any deviation from the stoichiometry, the presence of extended defects such as dislocations, and stacking faults can all cause a large increase in free energy which facilitates the crystalline to amorphous transformation. Reference Motta and Olander66
Irradiation induced amorphization of different types of SPPs has been reported for neutron irradiation cases. Reference Griffiths46,Reference Griffiths, Gilbert and Carpenter61,Reference Yang67,Reference Etoh and Shimada68 Intermetallic particles of Zr(Fe, Cr)2 and Zr2(Fe, Ni) in Zircaloy-2 and Zircaloy-4 undergo irradiation induced dissolution at higher temperatures (366–435 °C), and irradiation induced amorphization at low temperatures (<77 °C) during neutron irradiation. Reference Griffiths, Gilbert and Carpenter61 In the present case, however, the SPPs have a different chemical composition compared to previously reported irradiation induced amorphization. Complete amorphization of Fe and Nb rich SPPs at ∼278 °C has been reported by Kruger and Adamson Reference Kruger and Adamson63 in neutron irradiated Zr based alloys. These SPPs were reported to be smaller than the initially existing precipitates and to be partially depleted in Fe, indicating that dissolution and amorphization were occurring simultaneously.
V. SUMMARY AND CONCLUSION
The current study conducted on two types of Zr alloy Excel microstructures serves to assess and understand the irradiation behavior of optimized Zr Excel alloy for its possible use in generation-IV CANDU-SCWR. The results can be summarized as follows:
-
(1) Formation of <c>-component loops occurs after a TID in the optimized microstructure of Zr Excel alloy at 100, 300, and 400 °C. The TID has been found to be temperature and initial microstructure dependent. The <c>-component loops nucleate at lower doses at higher temperatures. The state of alloying elements in the form of SPPs increases the TID in the OA samples as compared to WQ samples where alloying elements are either in the solid solution or in the β phase.
-
(2) Size and loop density are dependent on the irradiation temperature, but not in the way expected from earlier results. Both the lowest density and lowest size of <c>-component loops were observed at the highest irradiation temperature (400 °C). The largest <c>-component loops with highest number density were found after irradiation at 300 °C.
-
(3) Sn in the form of solid solution in the α phase plays an important role in radiation induced evolution of the microstructure, undergoing radiation induced redistribution away from the α–β grain boundaries and segregating in the form of small clusters. Mo and Fe segregate to small clusters in the β phase, whereas the Nb distribution remains unchanged during irradiation.
-
(4) Formation of <c>-component loops at even low temperature shows a vulnerability of Zr Excel alloy toward irradiation growth. Formation of <c>-component loops is not only dose and temperature dependent but is also affected by the presence of alloying elements, either in the form of solid solution or concentrated in the form of SPP/β phase. Fe and Sn in particular play an important role in the irradiation induced microstructural evolution.
-
(5) SPP and solute rich β phase behave in different manners under irradiation. The high concentration alloying elements in the β phase redistribute within the β phase to form small SPP, except for Nb. Fe redistributes itself from the β phase into the α phase and segregates to the α–α grain boundaries. Sn segregates into small clusters away from grain boundaries within α phase.
-
(6) Pre-existing SPP in OA samples undergoes irradiation induced dissolution and reprecipitation at 400 °C, dissolution only at 300 °C, and irradiation induced amorphization at 100 °C.
-
(7) An increase in the TID for the formation of <c>-component loops indicates that OA Excel seems to be more stable as compared to the WQ samples in terms of irradiation growth.
ACKNOWLEDGMENTS
This work is sponsored by NSERC, UNENE, and Nu-Tech Precision Metals under the Industrial Research Chair Program in Nuclear Materials at Queen's University. Electron microscopy was accomplished at the Electron Microscopy Center for Materials Research at Argonne National Laboratory, a US Department of Energy Office of Science Laboratory operated under Contract No. DE-AC02-06CH11357 by UChicago Argonne, LLC. The EDS mapping in Manchester was supported by an EPSRC Leadership Fellowship grant (EP/I005420/1). Funding from BIS and NWDA for the microscope in Manchester is also acknowledged. We acknowledge Rick Holt of Queen's university for his valuable advice and Malcolm Griffiths of Chalk River laboratories for fruitful discussion. We thank Pete Baldo and E.A. Ryan of Argonne National Lab for their help on the ion beam facility.