INTRODUCTION
Accurate radiocarbon dating of the remains of European elk (or moose, Alces alces, in the following called “elk”) is important for prehistoric archaeology as this species was an important resource throughout prehistory. In Northern Europe, the Baltic region and Northern Russia, elk were a common game animal, especially during the Late Palaeolithic/Allerød. Elk seem to disappear during the Younger Dryas but reinvade with the beginning of the Holocene (Degerbøl Reference Degerbøl1939, Reference Degerbøl1964; Bokelmann Reference Bokelmann1978; Terberger Reference Terberger, Møller Hansen and Buck Pedersen2006; Aaris-Sørensen Reference Aaris-Sørensen2009; Riede et al. Reference Riede, Grimm, Weber and Fahlke2010; Larsson Reference Larsson, Sázelová, Novák and Mizerová2015). Elk remains dominated the fauna assemblages in some regions, especially in northeast Europe (e.g. Degerbøl Reference Degerbøl1964; Gumiński Reference Gumiński, Zvelebil, Dennell and Domanska1998; Timofeev Reference Timofeev, Zvelebil, Dennell and Domanska1998; Zhilin Reference Zhilin2006). In other regions, they were less numerous, but still present (Richter Reference Richter and Rasmussen1991). Elk bones and antlers were often used to produce tools (e.g. Gramsch Reference Gramsch and Kozłowski1973 and references therein; Møller Hansen and Buck Pedersen Reference Møller Hansen, Buck Pedersen, Møller Hansen and Buck Pedersen2006; Larsson Reference Larsson, Sázelová, Novák and Mizerová2015). However, elk were not only important for economic reasons. They are often represented in Northern European Late Palaeolithic/Mesolithic art (e.g. Zaliznyak Reference Zaliznyak, Zvelebil, Dennell and Domanska1998; Kabaciński et al. Reference Kabaciński, Hartz and Terberger2011). Even at sites where elk bones do not dominate the animal remains, depictions such as figurines have been found (e.g. Iršėnas Reference Iršėnas2000). The significance of elk therefore exceeds the purely economic needs.
In the North European Plain and the Western Baltic, the elk was a key element in Late Palaeolithic/Early Mesolithic art and rituals (Mathiassen Reference Mathiassen1953; Sørensen Reference Sørensen1978; Møller Hansen and Buck Pedersen Reference Møller Hansen, Buck Pedersen, Møller Hansen and Buck Pedersen2006; Terberger Reference Terberger, Møller Hansen and Buck Pedersen2006; Kabaciński et al. Reference Kabaciński, Hartz and Terberger2011; Veil et al. Reference Veil, Breest, Grootes, Nadeau and Hüls2012; Jessen et al. Reference Jessen, Pedersen, Christensen, Olsen, Mortensen and Hansen2015). With the development of dense forests, elk populations declined in parts of that region and the elk lost first its economic and later its symbolic significance (Andersen et al. Reference Andersen, Bietti, Bonsall, Broadbent, Clark, Gramsch, Jacobi, Larsson, Morrison, Newell, Rozoy, Straus, Woodman, Vermeersch and Van Peer1990; Kabaciński et al. Reference Kabaciński, Hartz and Terberger2011). Further to the north and east, however, elk populations continued to exist, and so did the economic and symbolic importance of the elk.
In Fennoscandia and Eastern Europe to the Eastern Urals, elk and especially elk head depictions are common from the 6th millennium BC until about 1000 BC (Carpelan Reference Carpelan1975; Iršėnas Reference Iršėnas2000; Bradley et al. Reference Bradley, Chippindale, Helskog and Whitley2001; Zhulnikov and Koshina Reference Zhulnikov and Koshina2010). Elk representations are made from a wide variety of materials and occur on staffs, boat prows, skis, axes, knives and spoons, as figurines and pendants and in rock art (Carpelan Reference Carpelan1975; Singleton Reference Singleton1989, 1998; Iršėnas Reference Iršėnas2000; Loze Reference Loze2010; Kashina and Zhulnikov Reference Kashina and Zhulnikov2011). The importance of the elk is further illustrated by artifacts and grave goods made of elk teeth, antler and bone (e.g. Butrimas and Jankauskas Reference Butrimas, Jankauskas, Zvelebil, Dennell and Domanska1998; Zhilin Reference Zhilin, Legrand-Pineau, Sidéra, Buc, David and Scheinsohn2010; Płonka et al. Reference Płonka, Kowalski, Malkiewicz, Kuryszko, Socha and Stefaniak2011). For example, these were imported to the island of Zealand, Denmark, even after elk had become extinct there (Aaris-Sørensen Reference Aaris-Sørensen and Skaarup1985; Schmölcke and Zachos Reference Schmölcke and Zachos2005). Accurate radiocarbon dating of elk remains is thus crucial as they represent an important part of prehistoric economy and symbolism.
Many depictions show elk in combination with water. For example, boats with elk heads are common in Scandinavian rock art (e.g. Singleton Reference Singleton1989, 1998; Helskog Reference Helskog2014; Sapwell Reference Sapwell, Ginn, Enlander and Crozier2014). At Lehtajärvi, northwest of Rovaniemi in Finnish Lapland, an elk head carved in pine had been found. It is 14C-dated to about 5800 BC and “appears to be the prow of a boat” (Singleton Reference Singleton1989, 1998). It is suggested that the elk, similar to seals or boats, can be regarded as a liminal agent, at home both in the water and on land (Helskog Reference Helskog, Chippindale and Nash2004; Westerdahl Reference Westerdahl2005). Today, it is impossible to tell whether boats with elk heads show actual boats, either decorated or camouflaged for elk hunting, or whether they are pictorial transitions between elks and boats (Westerdahl Reference Westerdahl2005). In any case, observations of elks swimming in the water must have been common in prehistory (Westerdahl Reference Westerdahl2005), as supported by modern studies of elk behavior.
During summer, elk spend a lot of time in or near the water (Peterson Reference Peterson1955; Corbet Reference Corbet1966; Lenarz et al. Reference Lenarz, Wright, Schrage and Edwards2011). Numerous reasons have been proposed: elk need to cool down during hot summer days; they can escape biting flies in the water; and they consume aquatic plants (Peek Reference Peek, Franzmann and Schwartz1998). The latter has been suggested to be the most important reason for the elk spending so much time in the water, e.g., because of the high sodium content of the aquatic plants (Runtz Reference Runtz1991; Peek Reference Peek, Franzmann and Schwartz1998). This is supported by the fact that aquatic feeding begins before the appearance of large flies and that moose observed in water were feeding or standing with parts of their body exposed to insect attack (Peek Reference Peek, Franzmann and Schwartz1998). Elk are not limited to floating or emerging plants, as they have been reported to uproot plants from water depths of up to five metres and consume them while totally submerged (Runtz Reference Runtz1991; Geist Reference Geist1999). In general, a wide variety of aquatic species is targeted by elk, including Nymphaeaceae, Potamogetonaceae and Typhaeceae (Renecker and Schwartz Reference Renecker, Schwartz, Franzmann and Schwartz1998: 418–419, tab. 36). The higher contents of crude protein and gross energy in aquatic plants, when adjusted for digestibility, outweigh the increased energy cost of locomotion in water and ingestion of water during feeding (Peek Reference Peek, Franzmann and Schwartz1998). Even if this had not been the case, the cooling effect of the water could outweigh a lower energy return from aquatic plants (Renecker and Schwartz Reference Renecker, Schwartz, Franzmann and Schwartz1998). It has been suggested that during summer, up to 50 % of the elk’s diet consist of aquatic plants (Burton Reference Burton1998). However, this study and other quantitative investigations conclude that this might be overestimated in many cases (see the Discussion section).
The potentially high proportion of aquatic diet is a concern for radiocarbon dating. The freshwater reservoir effect can be very high and variable (Keaveney and Reimer Reference Keaveney and Reimer2012; Philippsen Reference Philippsen2013; Philippsen and Heinemeier Reference Philippsen and Heinemeier2013) and can thus be a significant source of error when radiocarbon dating elk remains.
This project presented here is a pilot study, based on funding for only 20 radiocarbon dates. With the limited amount of samples that were possible to date in this study, I tried to cover as many different approaches as possible. I aim at using the information gained from this study in later projects with greater numbers of samples. In this study, I radiocarbon date different elk remains with known age or associated terrestrial samples. Antler and skull bone of the same individual are dated, as antlers form during summer, when the proportion of aquatic diet is assumed to be largest. The antler would thus have a higher reservoir age than the bone.
SITES AND SAMPLES
Samples of elk bone and antler with known age or other forms of independent age control were chosen. Three historical elks were obtained from Norway, while most samples derive from Early Holocene archaeological contexts across Eurasia.
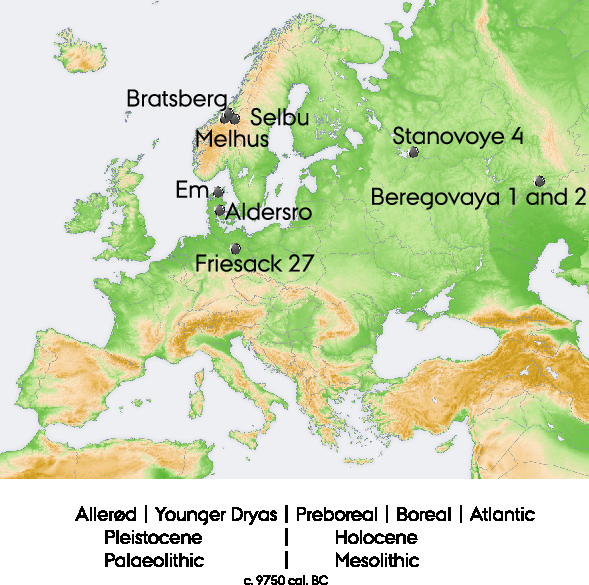
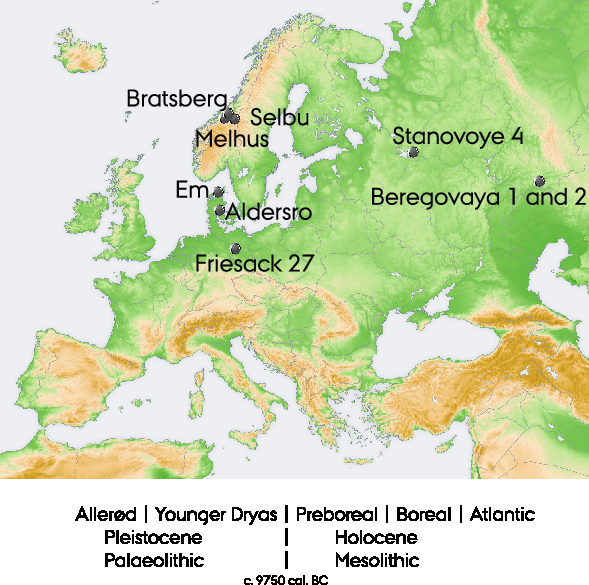
From Norway, three historical known-age, pre-bomb elk bones were acquired from Melhus, Selbu, and Bratsberg (Figure 1), all situated within an area with calcareous lakes. An aquatic plant from Melhus was collected in May 2015 to check for the freshwater reservoir effect. A sample of elk feces was collected in summer 2015 in Siberia, Russia, as it is an example of the elk’s diet in summer.
Map indicating the locations from where the samples originate. Background map: in the public domain, created by https://commons.wikimedia.org user San Jose. The insert shows the order of the environmental, climatic, and cultural phases mentioned in the text (based on the nomenclature commonly used in Denmark).
From the Preboreal-Boreal peat bog site Stanovoye 4 in the Upper Volga area, Russia, I received two elk antler artifacts from which wooden handles had already been 14C-dated (Hartz et al. Reference Hartz, Terberger and Zhilin2010). Here, the elk antler artifacts themselves were dated.
From the excavation FHM4096 at Aldersro, Denmark, a twig of yew/juniper (find no. x4705) was found right next to an elk antler and bone (find no. x4701) in a former dead ice lake. The twig and antler are assumed to be contemporaneous (pers. comm. Henrik Skousen and Uffe Rasmussen).
Four collagen samples from Friesack 27 (Groß Reference Groß2014) were provided by Charlotte Hegge, Kiel University. From two layer complexes, we have a pair of elk and terrestrial animal. The finds within one layer complex are assumed to be contemporaneous.
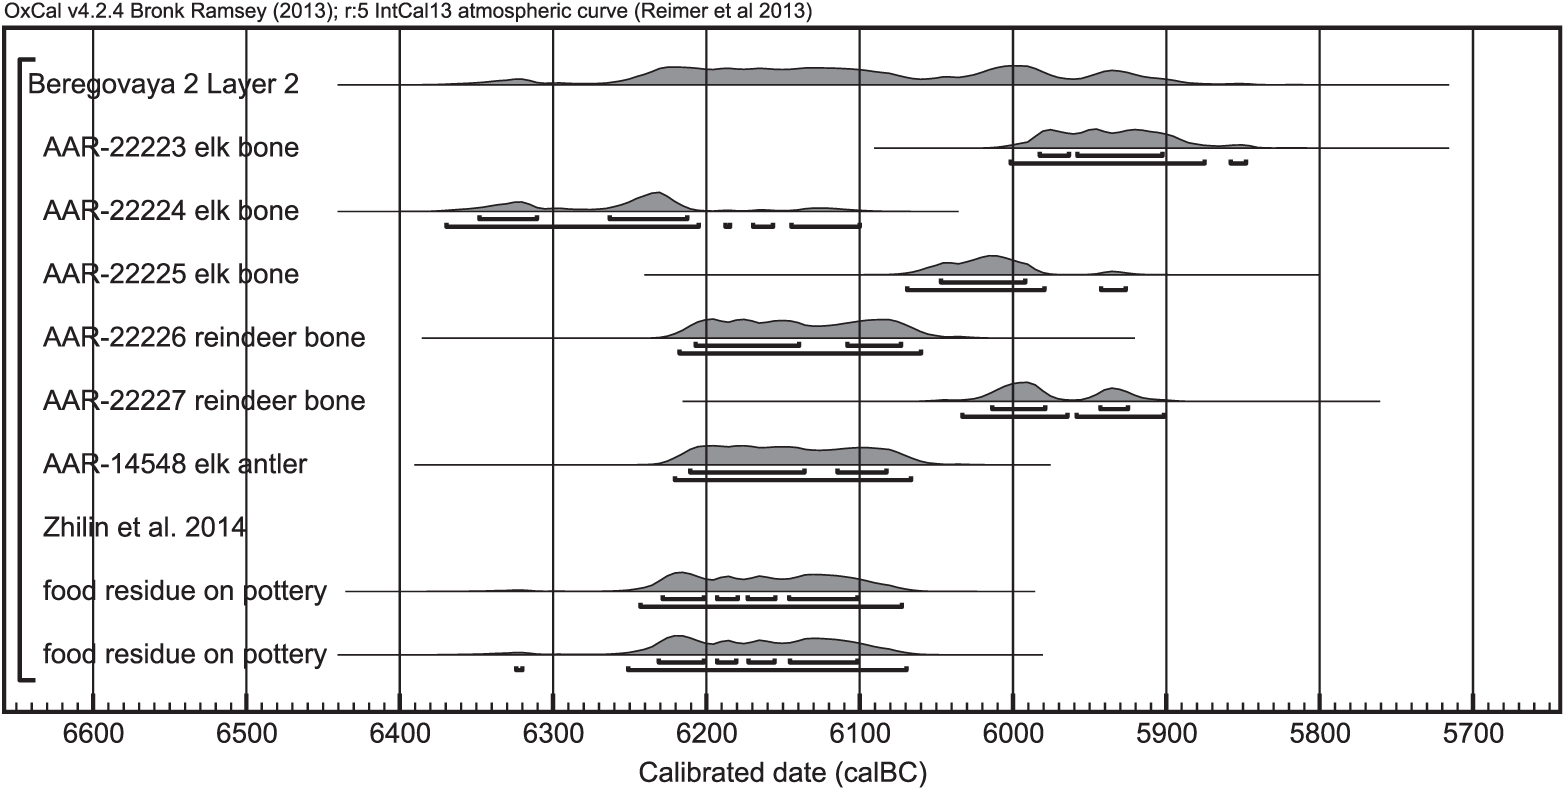
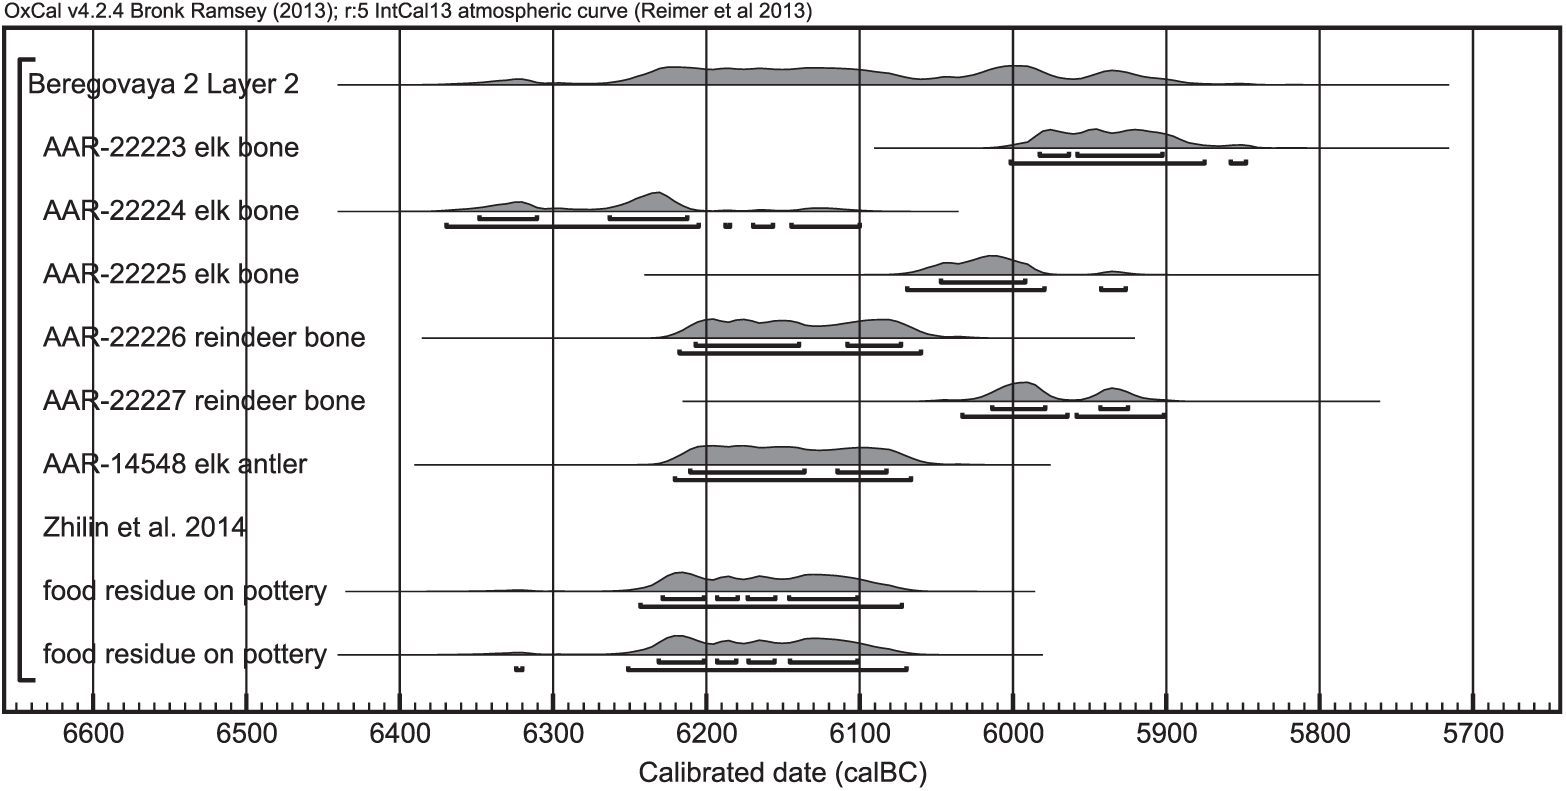
Beregovaya II, layer 2 comprises an Early Neolithic layer at the Gorbunovo peat bog, Russia. Layer 2 is embedded in peat and was dated to the Early Atlantic by pollen analysis and radiocarbon dated to about 7300 BP. In this study, two elk bones and two reindeer bones which are assumed to be contemporaneous were dated.
From the site “Tuehuset”, Em Sogn, Børglum Herred, Denmark, Per Lysdahl provided a sample of elk antler with some skull bone remains still attached to it. This sample pair will show if there is any difference in the radiocarbon age of summer diet (antler) vs. total diet (bone).
METHODS
Bone and antler samples were demineralised with 1M HCl at 4°C over several days, until effervescence ceased (complete dissolution of calcium carbonate) and no density gradient was observed (complete dissolution of calcium phosphate). Humates were removed with 0.1M NaOH, with renewed NaOH until the solution remained colorless; each base step lasted several hours at 4°C. After each acid or base step, the samples were rinsed 3 times with dem. H2O. Lastly, the samples were rinsed three times with a weak HCl solution (pH = 2), covered with that solution, and heated to 58–80°C for 48 hr, until the collagen was dissolved. The samples were centrifuged (15 min @ 2000 rpm) and filtered through 0.45-μm syringe filters, before they were freeze-dried. The collagen samples from Friesack were prepared with a modified Longin method at Kiel University. Radiocarbon dates were measured on the AMS systems of the Aarhus AMS Centre and at Direct AMS, Seattle USA, with data analysis and quality control in Aarhus. Stable isotopes were measured using a continuous-flow IsoPrime IRMS coupled to an elemental analyzer at the Aarhus AMS Centre.
RESULTS
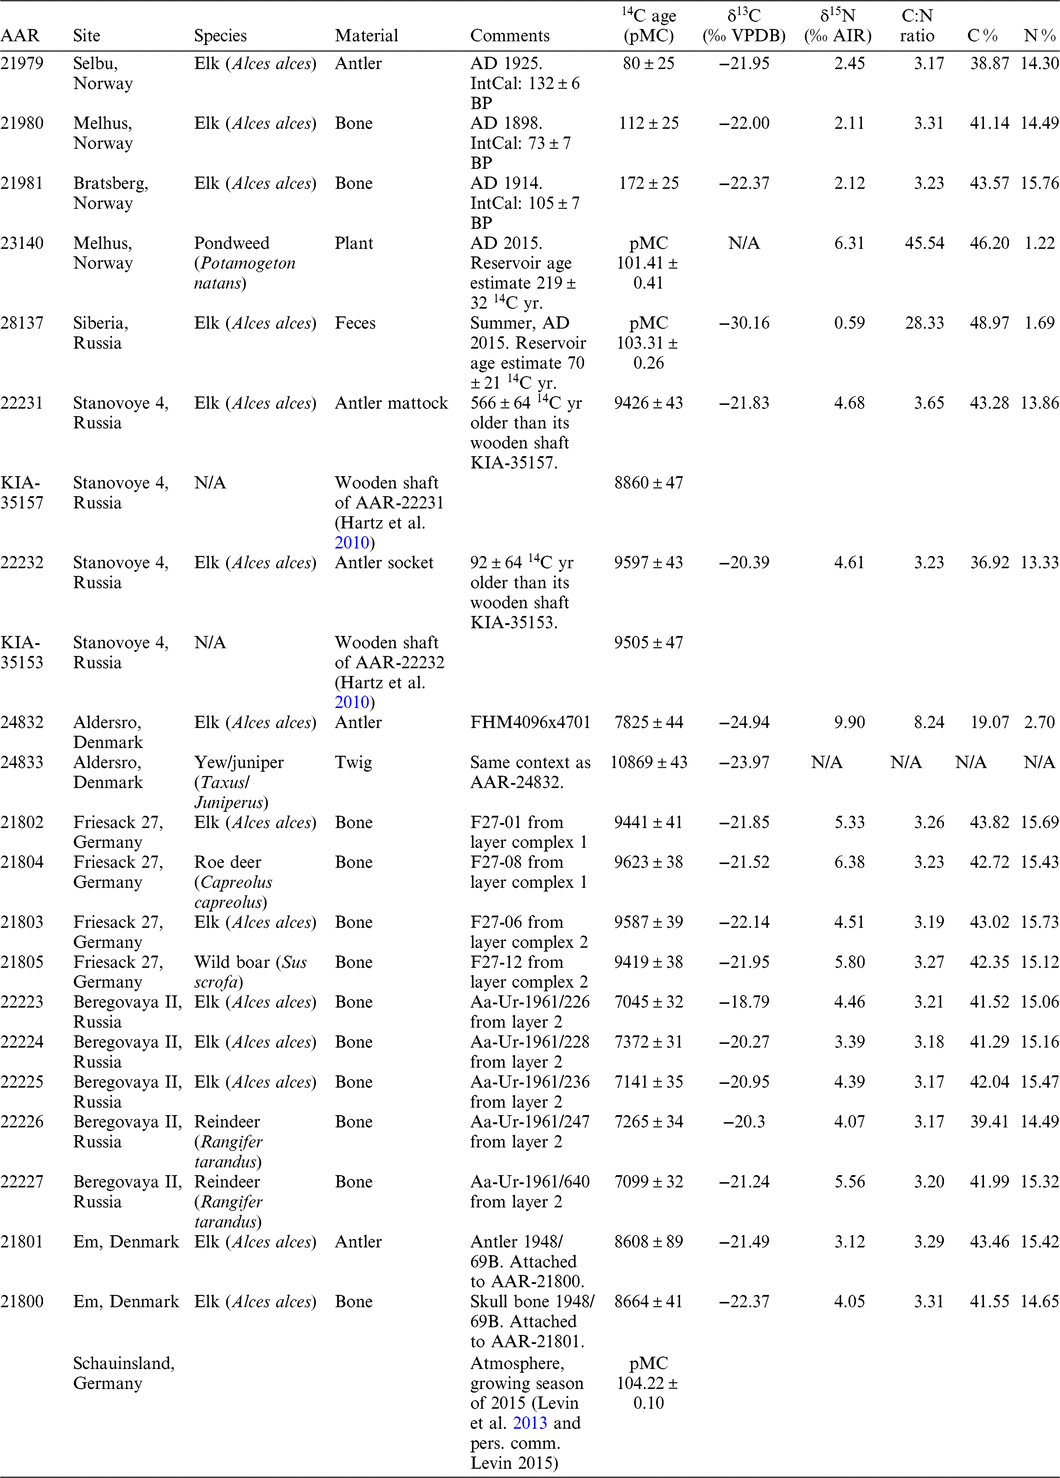
The radiocarbon dates and stable isotope measurements are presented in Table 1. Figures 2, 3, and 4 display the calibrated radiocarbon ages for the Norwegian sites; Em, Friesack 27 and Stanovoye 4; and Beregovaya 2. The samples were calibrated in OxCal 4.2.4 (Bronk Ramsey Reference Bronk Ramsey2009; Ramsey and Lee Reference Ramsey and Lee2013) using the terrestrial calibration curve IntCal13 (Reimer et al. Reference Reimer, Bard, Bayliss, Beck, Blackwell, Bronk Ramsey, Buck, Cheng, Edwards, Friedrich, Grootes, Guilderson, Haflidason, Hajdas, Hatté, Heaton, Hoffmann, Hogg, Hughen, Kaiser, Kromer, Manning, Niu, Reimer, Richards, Scott, Southon, Staff, Turney and van der Plicht2013).
Radiocarbon and stable isotope measurements of the samples discussed in this study.

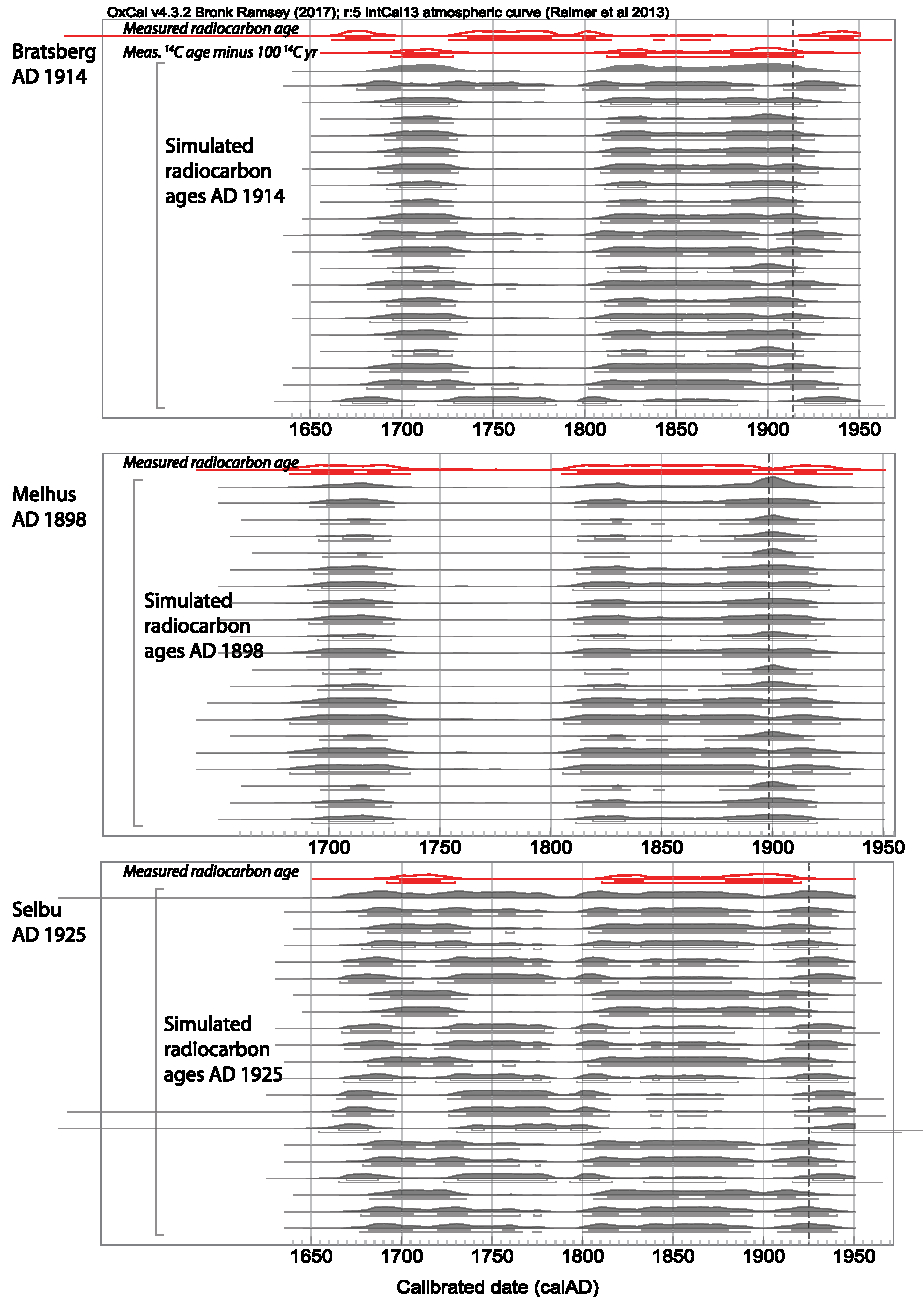
Calibrated and simulated radiocarbon ages of three historical elk samples from three sites in Norway (see Figure 1). Each panel represents one individual elk and site: the top panel the individual from Bratsberg, which died in AD 1914, the middle panel the individual from Melhus, which died in AD 1898, and the bottom panel the individual from Selbu, which died in AD 1925. Within each panel, the top probability distribution indicates the measured and calibrated radiocarbon age of the sample, shown in red outline (color figure available online). This is followed by 20 simulated radiocarbon ages for the time of death of the animal. A dashed line marks the time of death. In the case of Bratsberg, assuming a reservoir age of approximately 100 years results in a better match of the measured and simulated ages—the measured radiocarbon age minus 100 14C yr was calibrated as well as and is shown as the second probability distribution, also in red outline. The samples were calibrated with OxCal 4.2.4 (Bronk Ramsey Reference Bronk Ramsey2009; Ramsey and Lee Reference Ramsey and Lee2013) and the terrestrial calibration curve IntCal13 (Reimer et al. Reference Reimer, Bard, Bayliss, Beck, Blackwell, Bronk Ramsey, Buck, Cheng, Edwards, Friedrich, Grootes, Guilderson, Haflidason, Hajdas, Hatté, Heaton, Hoffmann, Hogg, Hughen, Kaiser, Kromer, Manning, Niu, Reimer, Richards, Scott, Southon, Staff, Turney and van der Plicht2013).

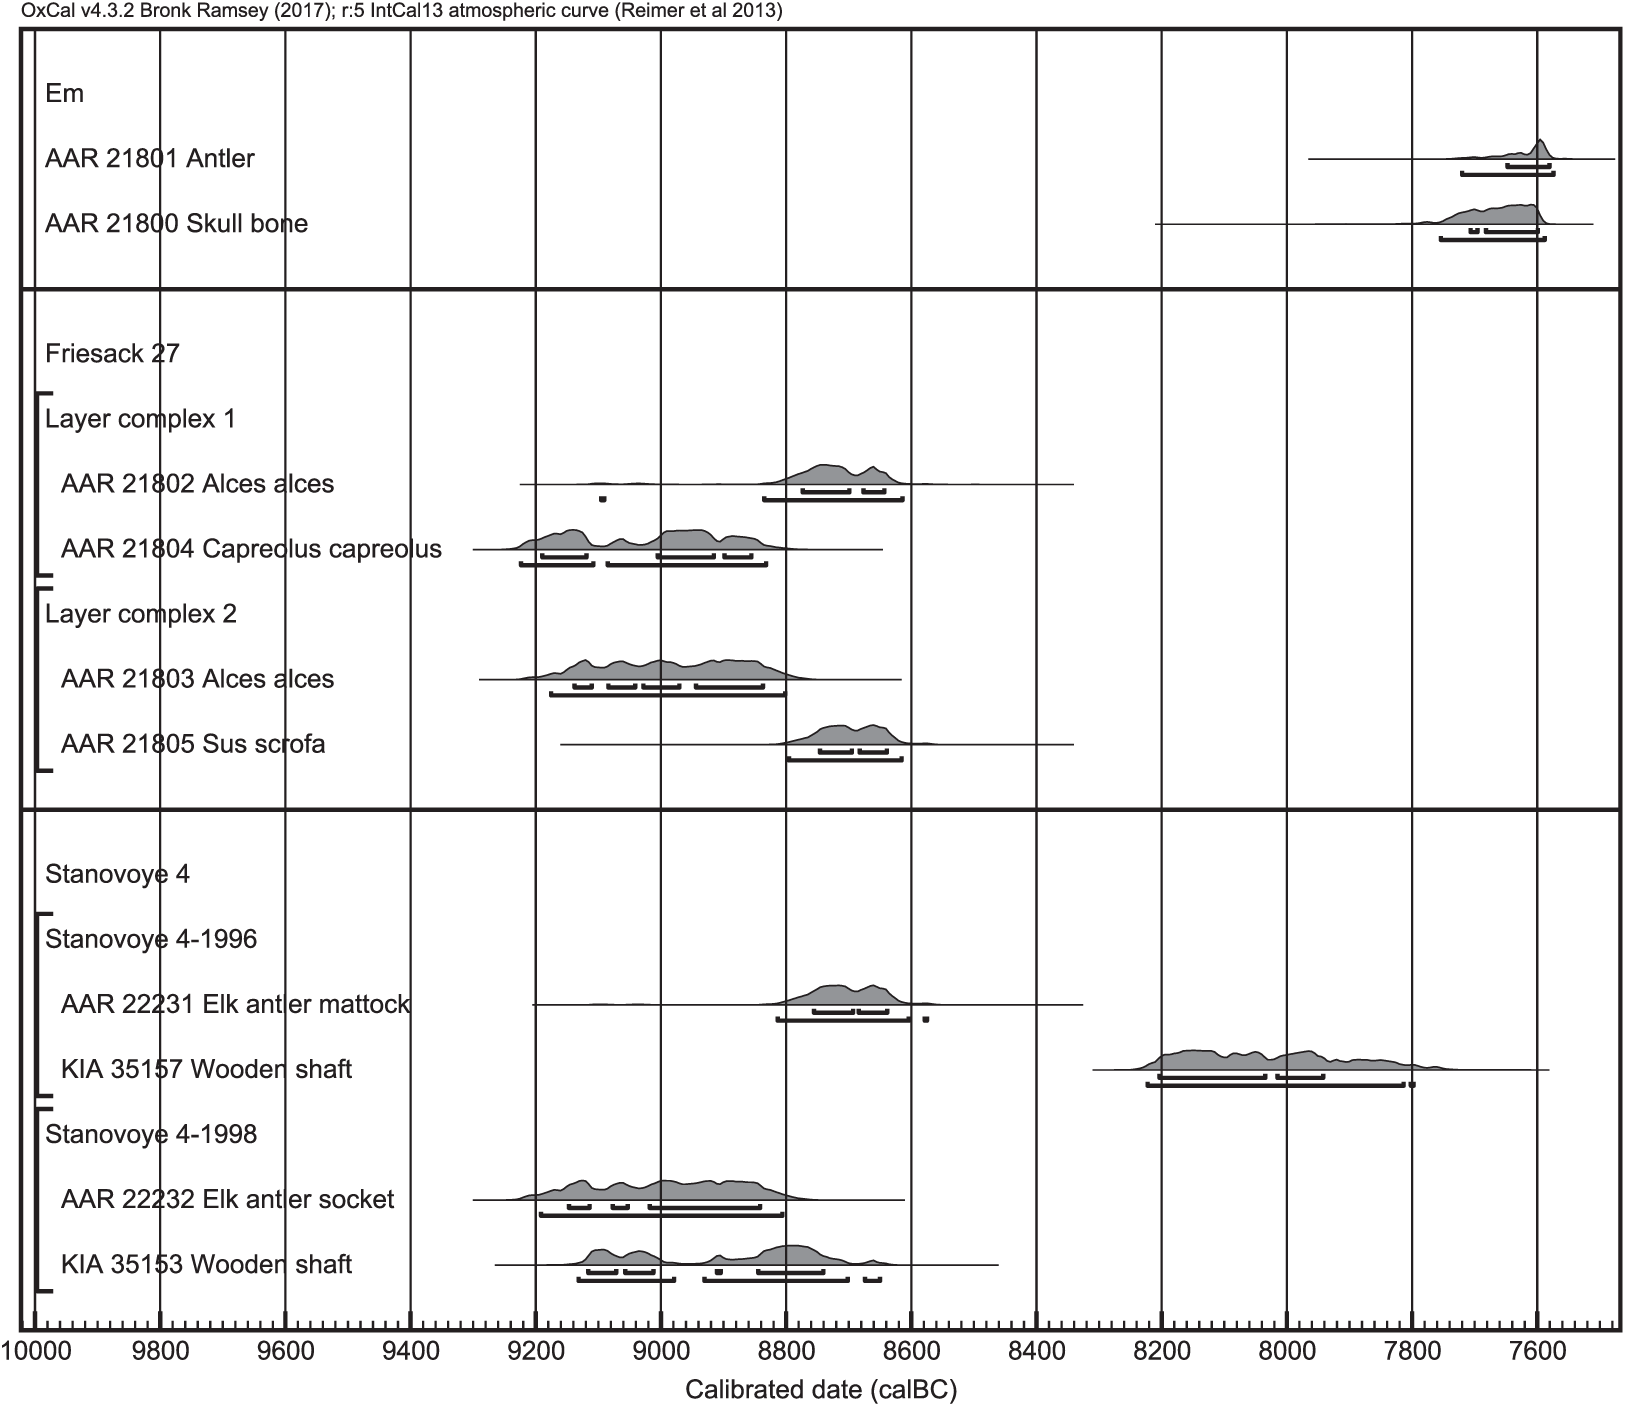
Calibrated radiocarbon ages of samples from Em (Denmark), Friesack 27 (Germany), and Stanovoye 4 (Russia; see Figure 1). The antler and skull bone from Em were still attached to another when found. Two pairs of samples from Friesack 27 originate from the same layer complexes and are thus assumed to be contemporaneous. From Stanovoye 4, two elk antler artifacts were dated, whose wooden handles had already been radiocarbon dated. The samples were calibrated with OxCal 4.2.4 (Bronk Ramsey Reference Bronk Ramsey2009; Ramsey and Lee Reference Ramsey and Lee2013) and the terrestrial calibration curve IntCal13 (Reimer et al. Reference Reimer, Bard, Bayliss, Beck, Blackwell, Bronk Ramsey, Buck, Cheng, Edwards, Friedrich, Grootes, Guilderson, Haflidason, Hajdas, Hatté, Heaton, Hoffmann, Hogg, Hughen, Kaiser, Kromer, Manning, Niu, Reimer, Richards, Scott, Southon, Staff, Turney and van der Plicht2013).

Calibrated radiocarbon ages of samples from Beregovaya II, layer 2, Russia. The samples were calibrated with OxCal 4.2.4 (Bronk Ramsey Reference Bronk Ramsey2009; Ramsey and Lee Reference Ramsey and Lee2013) and the terrestrial calibration curve IntCal13 (Reimer et al. Reference Reimer, Bard, Bayliss, Beck, Blackwell, Bronk Ramsey, Buck, Cheng, Edwards, Friedrich, Grootes, Guilderson, Haflidason, Hajdas, Hatté, Heaton, Hoffmann, Hogg, Hughen, Kaiser, Kromer, Manning, Niu, Reimer, Richards, Scott, Southon, Staff, Turney and van der Plicht2013). They originate from the same layer and are assumed to be contemporaneous.
The stable isotope values measured on elk bone and antler range from –24.94 to –18.79‰ (Table 1). The average is –21.64‰, with a standard deviation of 1.43‰. The δ15N range is even larger, from 2.11 to 9.90‰, with an average of 4.24 and standard deviation of 2.00‰. The isotope values of the elk samples do not differ significantly from the bones of other animals of the same site, such as the roe deer and wild boar at Friesack or the reindeer at Beregovaya (Table 1).
The historical elks from Norway died between AD 1898 and 1925. Their radiocarbon ages can be compared to the radiocarbon age of the contemporaneous atmosphere, as provided by IntCal13 (Table 1). The measured ages all agree within 2–3σ with IntCal13. A reservoir effect can thus not be found here, although the individuals originate from an area with calcareous lakes, where freshwater reservoir effects can be expected. A sample of water plant from Melhus, probably Potamogeton natans, was collected in May 2015. Its pMC of 101.41 ± 0.41 is lower than the contemporaneous atmosphere (pMC = 104.21 ± 0.10 for the 2015 growing season, Table 1) and yields an estimated reservoir age of R = 219 ± 32 14C yr (Eq. 1).
 $${\rm{R}} = 8033*{\rm{ln}}({\rm{pM}}{{\rm{C}}_{{\rm{atm}}}}{\rm{/pM}}{{\rm{C}}_{{\rm{sample}}}})$$
This indicates the possibility of a measurable reservoir effect, in case the elks consumed large amounts of plants with this radiocarbon age. In Figure 2, the calibrated radiocarbon ages of the historical elks from Norway are shown together with several simulated radiocarbon ages of samples with the same time of death. In the cases of the samples from Selbu and Melhus, both agree. However, in the case of the sample from Bratsberg, the measured and simulated radiocarbon ages agree better when assuming a reservoir age of about 100 14C yr for the elk.
Elk feces, collected in summer 2015 in Siberia, have a pMC of 103.31 ± 0.26 (Table 1). Compared to the average atmospheric pMC of the 2015 growing season, this results in a reservoir age estimate of 70 ± 21 14C yr (cf. Eq. 1). The shape and consistency of the feces pellet is uncharacteristic for summer feces of elk—these are reported as being soft and poorly formed due to the high nutrient and water content of summer browse compared to winter browse (Schwartz and Renecker Reference Schwartz, Renecker, Franzmann and Schwartz1998). The general appearance of the sample and its low 14C reservoir age both indicate a diet high in woody plant parts, i.e. terrestrial plants. This is in contrast to the observed preference of Russian elk for aquatic habitats and diet in summer (Heptner et al. Reference Heptner, Nasimowitsch, Bannikov, Heptner and Naumov1966; Heptner and Nasimovich Reference Heptner and Nasimovich1967). It is difficult to interpret the (remarkably low) δ13C value of the feces sample of –30‰, as the isotopic baseline of the region is unknown. The δ15N value of this sample is only 0.59‰. 15N-isotopic enrichment of feces relative to diet have been reported to be between 1.4 and 2.0‰ (Kielland Reference Kielland2001). Therefore, this individual’s diet would have had an average δ15N value of –0.8 to –1.4‰, not unusual for stems and leaves of trees such as willows, birch and aspen (Kielland Reference Kielland2001).
At Stanovoye, the elk antler artifact is in one case 566 ± 64 14C yr older than its wooden handle, in the other case only 92 ± 64 (Table 1, Figure 3). This could indicate that one of the elk antler tools was affected by the freshwater reservoir effect. However, the possibility of reused old antler for making the tool cannot be excluded.
The elk antler sample from Aldersro is younger than the twig that was found associated with it (Table 1). This indicates that the twig had been redeposited. The twig was identified to yew or juniper. If the first is true, this sample is quite old for yew, as yew is reported to reappear after the ice age around 7800–7200 cal BP in Central Europe, or in the Late Atlantic and Subboreal in Northwestern Europe, and thus possibly much later than 10000 cal BC in Denmark (Deforce and Bastiaens Reference Deforce and Bastiaens2007; Hageneder Reference Hageneder2013).
Two pairs of samples from Friesack 27 were radiocarbon dated. In the sample pair from layer complex 1, the elk is younger than the roe deer; in the sample pair from layer complex 2, the elk is older than the wild boar (Table 1, Figure 3). This indicates that the layer complexes are not, as previously assumed, closed stratigraphic units, and that the bones can have been redeposited. Therefore, I cannot make a statement about a reservoir effect in the elks from this site.
A similar situation to that in Friesack can be found at Beregovaya II. From that site, I only dated samples belonging to layer 2. Unfortunately, those samples span a range of several hundred years, without any difference between elk and reindeer bones (Table 1, Figure 4). Previous food crust dates from this layer (Zhilin et al. Reference Zhilin, Savchenko, Nikulina, Schmölcke, Hartz and Terberger2014) fall into the same range.
The skull and antler samples from Em have approximately the same radiocarbon age. This illustrates that the carbon incorporated during summer in the antler is not affected by a greater reservoir effect than the year-round diet. However, this sample pair cannot be used to support nor to reject the possibility of a reservoir effect.
DISCUSSION
On the basis of the 20 samples analyzed in this study, I found age offsets between zero and over 500 years between the elk and associated samples. However, significant reservoir effects were only found in few individuals and could also be explained by other factors, such as reuse of old antlers for tool production.
In all cases where elk samples were dated together with associated terrestrial samples from the same layers, I found discrepancies that cannot be caused by reservoir effects. For example, elk bones were both younger and older than the certainly terrestrial samples. In other cases, the terrestrial control samples also span a large age range. Individual layers do thus not represent closed contexts containing material of the same age. Even if the depositional event is considered to be of short duration, the sediment layers can contain redeposited material of different ages. For further studies regarding reservoir effects, I will thus aim at obtaining samples with better age controls than only the stratigraphic position.
The examples from Norway and Stanovoye 4 show that elks from the same region can have different reservoir ages. Therefore, the possibility of a reservoir effect in elk does not only depend on the study region (e.g., the presence of lakes with a considerable reservoir age), but also on the behavior of the individual elk. It should be noted that I only analyzed samples from Europe so far. From North America (Canada and the USA), there are numerous accounts of elk consuming large amounts of aquatic vegetation. In Ontario, for example, elk feed on aquatic vegetation from May/June to October, create access trails to feeding sites in lakes, and gather in groups of up to 20 individuals for feeding in one lake (Timmermann and Racey Reference Timmermann and Racey1989). This could reflect the dietary preferences of elk in North America, or an observation bias, as elk are much easier to observe in and next to water than in a dense forest (Lenarz et al. Reference Lenarz, Wright, Schrage and Edwards2011).
Several quantitative studies of elk nutrition found that aquatic plants only played a minor role. For example, the analysis of rumen contents of elk from Canada found only 4 % aquatic plants in the elks’ summer diet, while they were totally absent in the rumen contents of Alaskan elks (Cushwa and Coady Reference Cushwa and Coady1976; Crête and Jordan Reference Crête and Jordan1981). When recording the species and bite size of every individual bite in elks’ feeding bouts, LeResche and Davis (Reference LeResche and Davis1973) found that 3 % of the plants consumed in summer were aquatic. The same method was applied to elks in a mountainous area of Alaska, where virtually no aquatic plants were consumed, probably due to the lack of aquatic habitat types in the study area (Van Ballenberghe et al. Reference Van Ballenberghe, Miquelle and MacCracken1989). Only a few percent of radio locations of elks from Minnesota were in marsh habitat, although the elks were often observed to feed on aquatic vegetation from drainage ditches (Phillips et al. Reference Phillips, Berg and Siniff1973). Incremental sampling of elk hooves for δ13C and δ15N analyses showed less seasonal variation than would be expected from the large isotopic differences between aquatic and terrestrial browse (LaZerte and Szalados Reference LaZerte and Szalados1982), leading to the conclusion that aquatic plants only constitute a minor portion of the summer diet (Kielland Reference Kielland2001). Blood samples of elk showed no δ15N differences between summer and winter diet, but an enrichment of 0.5–0.6‰ was observed for the δ13C values in winter, probably due to isotopic differences between foliage and shrub stems (Ben-David et al. Reference Ben-David, Shochat and Adams2001). Thus, aquatic resources appear to be less important in elk diet than previously assumed. Even the use of aquatic habitats for cooling in summer might be less pronounced than generally reported. For example, Lenarz et al. (Reference Lenarz, Wright, Schrage and Edwards2011) found that shade in dense vegetation was preferred to aquatic sites for cooling. As mentioned above, this discrepancy between expected and measured use of aquatic resources could be due to an observation bias.
In the one case studied here, I could not detect a difference between the radiocarbon ages of the antler and bone. In terms of radiocarbon age, thus, there was no significant difference between summer diet and whole-year diet in this individual. This agrees with measurements performed along the hairs of North American elk, where seasonal differences also were absent (Drucker et al. Reference Drucker, Hobson, Ouellet and Courtois2010).
I could not find a correlation between the elks’ reservoir age and the δ13C or δ15N values of the bone collagen. This is probably due to the small proportion of aquatic diet and/or small isotopic differences between terrestrial and aquatic vegetation. Therefore, I do not have a tool to predict, let alone quantify, reservoir ages in elk.
The isotope values of my elk samples fall generally within the range of values measured on elk hair from boreal forests in Canada (δ13C between –26 and –22‰, δ15N between 0 and 7‰ for individual samples, Drucker et al. [Reference Drucker, Hobson, Ouellet and Courtois2010]) and elk hooves from Alaska (δ13C between ca. –24.5 and –22.5‰, δ15N between ca. 1 ‰ and 2.5‰, Kielland [Reference Kielland2001]), although my δ13C values tend to be less negative. In this study by Drucker et al. (Reference Drucker, Hobson, Ouellet and Courtois2010), however, there was a significant difference between the average values of elk hairs compared to caribou (reindeer) hair—the latter had consistently higher δ13C and δ15N values that did not overlap with those of the elk. This difference was interpreted as reflecting differences in diet between the two species. Therefore, the overlapping isotope values of my elk and reindeer samples from Beregovaya could indicate overlapping dietary resources and a general difference in habitats between prehistoric Russia and today’s North America.
In the literature, there are very few cases of radiocarbon dated elk remains in well-dated contexts. For example, two Swedish elk samples were 500–1000 years older than the pollen-dated context—but the same applied to some truly terrestrial animals, so this probably indicates a problem with the pollen dating rather than a reservoir effect in the elk. A better example is the elk found at Miesenheim, Germany. Its age is well-constrained as it was found below the Laacher See tephra. This individual has been dated multiple times in the context of an intercomparison study, without an indication of reservoir effects (Kuzmin et al. Reference Kuzmin, Fiedel, Street, Reimer, Boudin, van der Plicht, Panov and Hodgins2018). Another example is from England, where at Poulton-le Fylde, a complete elk skeleton with two bone or antler barbed points close to its hind bones was excavated in the 1970s (Barnes et al. Reference Barnes, Edwards, Hallam and Stuart1971; Hallam et al. Reference Hallam, Edwards, Barnes and Stuart1973). Both the skeleton, preservatives extracted from it and two samples of the surrounding detritus mud were radiocarbon dated (Hallam et al. Reference Hallam, Edwards, Barnes and Stuart1973; Gillespie et al. Reference Gillespie, Gowlett, Hall, Hedges and Perry1985; Jacobi Reference Jacobi and Roe1986). Amino acids extracted from elk bone have the same radiocarbon age as the older mud sample. However, in case the younger mud sample represented the “true age” of the event, this individual would have a reservoir age of about 700 14C yr. For future studies, it would be advisable to date the barbed points found at the animal as well.
From Denmark, there are several examples of elk skeletons found in associations with hunting weapons made of bone or antler. These would serve as excellent test material to detect possible reservoir effects, unless of course all weapons had been made of elk bone or antler. At Skottemarke, Denmark, an elk skeleton was dated to 9400 ± 140 BP (K-2075). The author had also applied for radiocarbon dates of samples of the surrounding layers, but had been rejected (Sørensen Reference Sørensen1978). The elk from another Danish site, Tåderup, had been found together with a bone point and later a harpoon (Ødum Reference Ødum1920). It is dated to 7810 ± 120 BP (K-2227, Sørensen Reference Sørensen1978). The bone point and harpoon have not been dated yet.
CONCLUSIONS
Most elk remains appear to be free of reservoir effects. Further studies are needed to determine whether this is true in general or only an effect of the small number of samples analyzed here. The importance of aquatic plants in the diet of elk might be considerably lower than usually reported. Therefore, I propose that radiocarbon dating of contemporary elk samples could be a useful tool to monitor the contribution of aquatic vegetation to elk diet. Aquatic and terrestrial vegetation differ in concentrations of macronutrients (lipids, proteins, carbohydrates), which are usually routed to different tissues in the animal’s body. Therefore, I suggest to analyze different tissues and different compounds from one tissue (e.g., amino acids from bone collagen) to reconstruct the elk’s diet in detail.
This study shows that a freshwater reservoir effect can occur in individual samples. Radiocarbon dates of elk remains should thus be treated with caution.
ACKNOWLEDGMENTS
This project was funded by the IFA IDEAS award 2014. The write-up of this article was supported by the Danish National Research Foundation under the grant DNRF119 – Centre of Excellence for Urban Network Evolutions (UrbNet).
I would like to thank all colleagues who kindly supplied me with samples: Per Lysdahl, Vendsyssels Historiske Museum, Hjørring, Denmark (elk bone and antler from Em), Jørgen Rosvold, NTNU Vitenskapsmuseet, Seksjon for arkeologi og kulturhistorie, Norway (historical elks from Norway), Kirsti Pedersen (aquatic plants from Norway), Henrik Skousen, Uffe Rasmussen, Helle Strehle, Susanne Østergaard and Jannie Holm Larsen, Moesgård Museum, Denmark (elk antler and wood from Aldersro and species identifications), Charlotte Hegge and Daniel Groß, Kiel University, Germany (bone collagen from Friesack 27), Mikhail Zhilin, Institute of Archaeology, and Pavel Kosintsev, Institute of Plant and Animal Ecology, Russian Academy of Sciences (bone and antler samples from Stanovoye and Beregovaya).