
1. Introduction
Rayleigh–Taylor (RT) instability occurs at the interface between two fluids of different densities, when the density and pressure gradients are in opposite directions. In a gravitational field, an interface separating a dense fluid supported by a lighter one is unstable (Rayleigh Reference Rayleigh1899). In this situation, which we refer as static, the average position of the interface does not vary with time. If the interface is accelerated in the direction from the lighter to the denser fluid, the configuration is also unstable (Taylor Reference Taylor1950). In this situation, which we refer as dynamic, the average position of the interface varies over time. In both cases, infinitesimal perturbations at the interface will grow over time, leading to the interpenetration of the fluids, and to the reduction of their combined potential energy.
The RT instability was first investigated at planar interfaces using theoretical, numerical and experimental methods, both in the early-time linear (e.g. Emmons, Chang & Watson Reference Emmons, Chang and Watson1960; Chandrasekhar Reference Chandrasekhar1961; Tryggvason Reference Tryggvason1988) and the subsequent nonlinear regimes (e.g. Linden, Redondo & Youngs Reference Linden, Redondo and Youngs1994; Dalziel, Linden & Youngs Reference Dalziel, Linden and Youngs1999; Dimonte Reference Dimonte1999). However, various phenomena such as inertial confinement fusion experiments (e.g. Lindl Reference Lindl1998; Thomas & Kares Reference Thomas and Kares2012), supernovae explosions (e.g. Arnett et al. Reference Arnett, Bahcall, Kirshner and Woosley1989; Schmidt Reference Schmidt2006), detonation of explosive charges (e.g. Balakrishnan & Menon Reference Balakrishnan and Menon2011) and collapsing bubbles (e.g. Prosperetti Reference Prosperetti1977; Lin, Storey & Szeri Reference Lin, Storey and Szeri2002) involve RT instabilities at spherical interfaces. The spherical configuration was initially investigated in static and dynamic cases, regarding the early-time linear stability of spherical interfaces between two inviscid fluids (Bell Reference Bell1951; Plesset Reference Plesset1954; Mikaelian Reference Mikaelian1990). Viscosity effects responsible for energy dissipation at small-scale were also investigated in both cases (Chandrasekhar Reference Chandrasekhar1955; Prosperetti Reference Prosperetti1977; Mikaelian Reference Mikaelian2016). Turbulent mixing related to the late-time nonlinear RT instability dynamics was also investigated for spherical interfaces (Youngs & Williams Reference Youngs and Williams2008; Thomas & Kares Reference Thomas and Kares2012; Lombardini, Pullin & Meiron Reference Lombardini, Pullin and Meiron2014).
The RT instability also enters the dynamics of drop impacts. Above a given kinetic energy, the drop impact is followed by the formation of a liquid crown above the crater (e.g. Rein Reference Rein1993). The interface between the liquid of the crown and the air rapidly decelerates, which leads to the formation of fluid fingers in part interpreted as an RT instability (e.g. Allen Reference Allen1975; Krechetnikov & Homsy Reference Krechetnikov and Homsy2009; Agbaglah, Josserand & Zaleski Reference Agbaglah, Josserand and Zaleski2013).
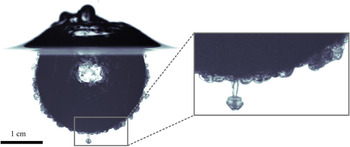
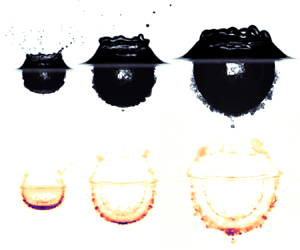
In our experiment, we investigate another instability that develops under the water surface when a denser-than-water drop impacts a deep liquid pool of water. Figure 1 shows a snapshot from one such experiment, at a time when the impact of the drop has produced a sizeable crater. We see on this picture that the liquid from the drop, which covers the crater floor, has developed mushroom-shaped structures penetrating radially into the water pool. We interpret these structures as a spherical RT instability associated with the deceleration of the crater floor. The dynamics of the RT instability depends crucially on the acceleration history of the interface (Mikaelian Reference Mikaelian1990; Dimonte & Schneider Reference Dimonte and Schneider2000).
Crater produced by the vertical impact of a liquid drop onto a less dense liquid pool. A spherical RT instability develops around the crater when it decelerates, which results in mushroom-shaped plumes growing radially outward.

In the case of a drop impact, this acceleration is dictated by the dynamics of the crater, which depends on the impact parameters, i.e. drop radius, impact velocity, ambient gravity and physical properties of the fluids such as surface tension, density and viscosity. Depending on these impact parameters, various impact regimes such as floating, bouncing, coalescence and splashing may occur (e.g. Rein Reference Rein1993). In this work, we focus on the splashing regime. Since the pioneering experiments of Worthington (Reference Worthington1895), the splashing regime has been extensively investigated, regarding in particular the scaling of the maximum crater size (Engel Reference Engel1966; Leng Reference Leng2001), the time evolution of the transient crater (Engel Reference Engel1967; Morton, Rudman & Jong-Leng Reference Morton, Rudman and Jong-Leng2000; Bisighini et al. Reference Bisighini, Cossali, Tropea and Roisman2010), the evolution and fragmentation of the fluid crown (Okawa, Shiraishi & Mori Reference Okawa, Shiraishi and Mori2006; Zhang et al. Reference Zhang, Brunet, Eggers and Deegan2010), the formation and fragmentation of the central peak (Fedorchenko & Wang Reference Fedorchenko and Wang2004; Ray, Biswas & Sharma Reference Ray, Biswas and Sharma2015) and underwater acoustic properties of the impact (Prosperetti & Oguz Reference Prosperetti and Oguz1993). Furthermore, the effects of immiscibility (Lhuissier et al. Reference Lhuissier, Sun, Prosperetti and Lohse2013; Jain et al. Reference Jain, Jalaal, Lohse and van der Meer2019), viscoplasticity (Jalaal, Kemper & Lohse Reference Jalaal, Kemper and Lohse2019), impact angles (Okawa et al. Reference Okawa, Shiraishi and Mori2006; Gielen et al. Reference Gielen, Sleutel, Benschop, Riepen, Voronina, Visser, Lohse, Snoeijer, Versluis and Gelderblom2017) and thickness of the target layer (Berberović et al. Reference Berberović, van Hinsberg, Jakirlić, Roisman and Tropea2009) on impact dynamics have been examined. Based on these experiments, several models of the crater size evolution and its related acceleration history were developed, using energy conservation (e.g. Engel Reference Engel1966, Reference Engel1967; Leng Reference Leng2001) or momentum conservation in an irrotational flow (e.g. Bisighini et al. Reference Bisighini, Cossali, Tropea and Roisman2010).
Besides providing an example of an RT instability at a spherical interface, this drop impact instability and the mixing related to it have geophysical implications. Terrestrial planets such as the Earth formed  $4.5\times 10^{9}$ years ago by the successive accretion of increasingly massive bodies composed mainly of silicates and iron (Chambers Reference Chambers2010), the last giant impact being probably responsible for the formation of the Moon (Canup Reference Canup2012; Cuk & Stewart Reference Cuk and Stewart2012). During this process, planetary materials are heated by the kinetic energy released during the impacts, the reduction of gravitational potential energy as the metal of the impactors migrates toward the core, and the decay of radioactive isotopes (Rubie, Nimmo & Melosh Reference Rubie, Nimmo and Melosh2015). This energy supply contributes to the production of deep magma oceans (Solomatov Reference Solomatov2015). In addition, accretion models show that most of the Earth mass was accreted from differentiated bodies (Kleine et al. Reference Kleine, Münker, Mezger and Palme2002; Scherstén et al. Reference Scherstén, Elliott, Hawkesworth, Russell and Masarik2006), i.e. with a separate core and mantle (in contrast, it should be noted that we use drops made of a single liquid in our experiments). Both the impacting body and the planetary surface are melted by the shock waves produced by the impact, releasing the liquid metal core of the impactor into a fully molten magma ocean (Tonks & Melosh Reference Tonks and Melosh1993). This results in a situation where the metal core of an impactor strikes a less dense silicate magma ocean. A spherical RT instability can therefore develop during crater opening, producing mixing that contributes to the thermal and chemical equilibration between the metal core of the impactors and the silicates of the magma ocean.
The current dynamics of the Earth is partly inherited from its concomitant accretion and differentiation. Heat partitioning and chemical fractionation between the mantle and the core depend on the physical processes involved during differentiation (Stevenson Reference Stevenson1990; Wood, Walter & Wade Reference Wood, Walter and Wade2006), which includes in particular equilibration and dispersion occurring during planetary impacts (Canup Reference Canup2004; Cuk & Stewart Reference Cuk and Stewart2012; Kendall & Melosh Reference Kendall and Melosh2016; Nakajima et al. Reference Nakajima, Golabek, Wünnemann, Rubie, Burger, Melosh, Jacobson, Manske and Hull2021; Landeau et al. Reference Landeau, Deguen, Phillips, Neufeld, Lherm and Dalziel2021). Heat partitioning sets the initial temperature contrast between the mantle and the core. It crucially determines the early thermal and magnetic evolution of the planet, in particular the formation and evolution of magma oceans (Labrosse, Hernlund & Coltice Reference Labrosse, Hernlund and Coltice2007; Sun et al. Reference Sun, Zhou, Yin, Zhao, Xu and Lu2018) and the existence of an early dynamo (Williams & Nimmo Reference Williams and Nimmo2004; Monteux, Jellinek & Johnson Reference Monteux, Jellinek and Johnson2011; Badro et al. Reference Badro, Aubert, Hirose, Nomura, Blanchard, Borensztajn and Siebert2018). Chemical fractionation has also major geodynamical implications, such as the nature and abundance of radioactive and light elements in the core (Corgne et al. Reference Corgne, Keshav, Fei and McDonough2007; Siebert et al. Reference Siebert, Badro, Antonangeli and Ryerson2012; Badro et al. Reference Badro, Brodholt, Piet, Siebert and Ryerson2015; Fischer et al. Reference Fischer, Nakajima, Campbell, Frost, Harries, Langenhorst, Miyajima, Pollok and Rubie2015). Geochemical data such as isotopic ratios and partitioning coefficients between metal and silicates provide constraints on the timing of accretion and physical conditions of core formation in terrestrial planets (Li & Agee Reference Li and Agee1996; Kleine et al. Reference Kleine, Münker, Mezger and Palme2002; Righter Reference Righter2011; Siebert, Corgne & Ryerson Reference Siebert, Corgne and Ryerson2011). However, their interpretation depends on the degree of chemical equilibration between the metal of the impactors’ core and the magma ocean (Rudge, Kleine & Bourdon Reference Rudge, Kleine and Bourdon2010; Rubie et al. Reference Rubie, Frost, Mann, Asahara, Nimmo, Tsuno, Kegler, Holzheid and Palme2011). Consequently, an estimate of the equilibration produced by the spherical RT instability during the impact is required in order to properly interpret geochemical data. In this paper, we examine the spherical RT instability produced during an impact using fluid dynamics experiments.
The layout of this paper is as follows. In § 2, we introduce the set of non-dimensional numbers used in this study, and present the experimental procedure. In § 3, we describe the phenomenology of the cratering process and of the RT instability. In § 4, we obtain a model for the crater radius evolution from energy conservation. In § 5, we use the acceleration history of the cratering process to model the evolution of the thickness of the mixing layer resulting from the RT instability. In § 6, we finally apply this model to the differentiation of terrestrial planets.
2. Impact cratering experiments
2.1. Non-dimensional numbers
The impact dynamics of a liquid drop released above a deep liquid pool with a different density and viscosity depends on its impact velocity  $U_i$ and radius
 $R_i$, the densities
 $\rho _1$ and
 $\rho _2$ of the drop and the pool, the dynamic viscosities
 $\mu _1$ and
 $\mu _2$ of the drop and the pool, the surface tension at the air–liquid interface
 $\sigma$, and the acceleration of gravity
 $g$. Since these eight parameters contain three fundamental units, the Vaschy–Buckingham theorem dictates that the impact dynamics depends on a set of five independent dimensionless numbers. We choose the following set:
 \begin{equation} Fr=\frac{U_i^2}{g R_i}, \quad We=\frac{\rho_1U_i^2R_i}{\sigma}, \quad Re=\frac{\rho_2 U_i R_i}{\mu_2}, \quad \rho_1/\rho_2, \quad \mu_1/\mu_2. \end{equation}
The Froude number  $Fr$ is a measure of the relative importance of impactor inertia and gravity forces. It can also be interpreted as the ratio of the kinetic energy
 $\rho _1 R_i^3 U_i^2$ of the impactor to its gravitational potential energy
 $\rho _1 g R_i^4$ just before impact. The Weber number
 $We$ compares the impactor inertia and interfacial tension at the air–liquid interface. The Reynolds number
 $Re$ is the ratio between inertial and viscous forces. The ratios
 $\rho _1/\rho _2$ and
 $\mu _1/\mu _2$ compare, respectively, the density and the dynamic viscosity of the drop and the pool. Although the Atwood number
 $A=(\rho _1-\rho _2)/(\rho _1+\rho _2)$ is used widely in the context of RT instabilities, we use instead the density ratio because it appears more naturally in the equations governing the crater size evolution (see § 4). Since surface tension depends on salt concentration, a surface tension ratio between the drop and the pool is also involved. However, we ignore this parameter because the Weber number is much larger than unity and the surface tension of the drop varies by less than 20 % compared with the pool. We also use a modified Froude number and a Bond number,
 \begin{equation} Fr^*=\frac{\rho_1}{\rho_2}\frac{U_i^2}{g R_i}, \quad Bo=\frac{\rho_2 g R_i^2}{\sigma}, \end{equation}
which are, respectively, the ratio of the kinetic energy of the impactor  $\rho _1 R_i^3 U_i^2$ to the change of potential gravitational energy
 $\rho _2 g R_i^4$ associated with the opening of a crater of size
 $R_i$, and the ratio of buoyancy forces to interfacial tension at the air–liquid interface. The Bond, Weber and modified Froude numbers are related through
 $Bo=We/Fr^*$. In the following, time, lengths, velocities and accelerations are made dimensionless using the drop radius and the impact velocity, i.e. using, respectively,
 $R_i/U_i$,
 $R_i$,
 $U_i$ and
 $U_i^2/R_i$. These dimensionless quantities are denoted with a superscript star. For example, we use a dimensionless time
 $t^*=t/(R_i/U_i)$.
Planetary impacts are generally classified between a strength regime and a gravity regime, depending on the resistance to deformation of the target material (e.g. Melosh Reference Melosh1989). When the yield stress of the solid planetary surface, or the viscous stress of the magma ocean, are negligible in comparison with the impact-induced stress, planetary impacts are in the gravity regime. This typically happens when the impactor is larger than a few kilometres (Holsapple Reference Holsapple1993). In this case, the Reynolds number, the Weber number and the Bond number are expected to be larger than  $10^{10}$, due to kilometric impactors with impact velocities of the order of
 $10\,\mathrm {km}\,\mathrm {s}^{-1}$. This leads to extremely turbulent impact conditions where surface tension effects are negligible. Assuming that the impact velocity is close to the escape velocity of the target planet, i.e.
 $U_i \simeq \sqrt {gR_t}$ with
 $R_t$ the radius of the target, the modified Froude number scales as
 \begin{equation} Fr^* \simeq \frac{\rho_1}{\rho_2}\frac{R_t}{R_i}. \end{equation}
Here  $Fr^*$ is then of the order of 1 for impactors comparable in size with the target, but increases by several orders of magnitude for small colliding bodies, e.g. the Froude number is approximately
 $10^4$ for a 1 km radius body impacting an Earth-sized planet. From the perspective of the impactor, small impacts are thus dynamically more extreme than giant impacts. Since the metal core of the impactor is mainly composed of iron, the density ratio and the viscosity ratio are, respectively, expected to be of the order of
 $\rho _1/\rho _2 \simeq 2$ and
 $\mu _1/\mu _2 \simeq 0.1$ (Solomatov Reference Solomatov2015).
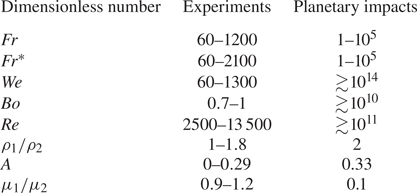
Table 1 compares the value of the dimensionless parameters in our drop impact experiments and in planetary impacts. Since experimental Reynolds numbers ( $Re \gtrsim 2500$) and Weber numbers (
 $We \gtrsim 60$) are large, viscosity and surface tension are mostly negligible during crater opening (e.g. Olevson Reference Olevson1969; Macklin & Metaxas Reference Macklin and Metaxas1976). Although
 $Re$ and
 $We$ are much larger during planetary impacts than in our experiments, this means that the cratering process is governed by inertia and buoyancy forces, in both our experiments and planetary impacts. We thus focus on the gravity regime (e.g. Melosh Reference Melosh1989), where the cratering dynamics depends mainly on two dimensionless parameters, the Froude number
 $Fr$ and the density ratio
 $\rho _1/\rho _2$.
Typical values of the main dimensionless parameters ((2.1a–e) and (2.2a,b)) in the experiments, and typical planetary impacts. For planetary impacts, dimensionless numbers are estimated with a density of  $4000\,\mathrm {kg}\,\mathrm {m}^{-3}$ for molten silicates and of
 $8000\,\mathrm {kg}\,\mathrm {m}^{-3}$ for molten metal, a dynamic viscosity of
 $0.1\,\mathrm {Pa}\,\mathrm {s}$ for molten silicates and of
 $0.01\,\mathrm {Pa}\,\mathrm {s}$ for molten metal (Solomatov Reference Solomatov2015). Surface tension between air and molten silicates, and between air and molten metal, are taken to be
 $0.3\,\mathrm {J}\,\mathrm {m}^{-2}$ (Taniguchi Reference Taniguchi1988) and
 $1.8\,\mathrm {J}\,\mathrm {m}^{-2}$ (Wille, Millot & Rifflet Reference Wille, Millot and Rifflet2002), respectively. We assume the impact velocity to be one to three times the escape velocity (Agnor, Canup & Levison Reference Agnor, Canup and Levison1999; Agnor & Asphaug Reference Agnor and Asphaug2004). We assume the impactor-to-target radius to be in the range
 $10^{-4}\text {--}1$.

In order to characterise the crater geometry and the RT instability following the impact, we vary the drop radius, drop density and impact velocity. In our experiments, we obtain Froude numbers and modified Froude numbers larger than unity, in the range  $Fr \simeq 60\text {--}1200$ and
 $Fr^* \simeq 60\text {--}2100$, respectively. We focus on five density ratios
 $\rho _1/\rho _2 \simeq \{1.0,1.2,1.4,1.6,1.8\}$, in comparison with a reference case without density contrast. We have also conducted a few experiments at
 $\rho _1/\rho _2 \simeq 0.8$ using ethanol in the drop. The upper limit of our experimental density ratios is close to the density ratio expected during a planetary impact.
2.2. Experimental set-up
2.2.1. Drop production, fluids and cameras
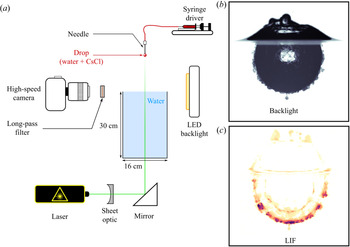
In these experiments, we release a liquid drop in the air above a deep liquid pool contained in a  $16\,{\rm cm}\times 16\,{\rm cm}\times 30\,{\rm cm}$ glass tank (figure 2). The pool level is set at the top of the tank. The aim is to minimise the thickness of the meniscus on the sides of the tank in order to obtain an image of the crater all the way to the surface.
(a) Schematic view of the experimental set-up, including backlight and LIF configuration set-up. (b) Snapshot obtained using the backlight configuration. (c) Snapshot obtained using the LIF configuration.

We generate the drop using a needle supplied with fluid by a syringe driver at a slow and steady pace. When the weight of the drop exceeds the surface tension forces, the drop comes off. We use a metallic needle with an inner diameter of 1.6 mm and a nylon plastic needle with an inner diameter of 4.7 mm, generating two series of drop size with typical radius in the range 1.7–2.0 mm and 2.3–2.7 mm, respectively. We estimate the drop size, which depends on the drop density, for each experiment based on a calibration using mass measurements of dozens of drops, independent density measurement, and assuming the drop is spherical. We validate this method using high-speed pictures of the drop prior to impact where we can directly measure the drop radius.
Typical impact velocities are in the range  $1\text {--}5\,\mathrm {m}\,\mathrm {s}^{-1}$. We calculate the impact velocity for each experiment using a calibrated free-fall model for the drop, including a quadratic drag. We also validate this method using high-speed pictures of the drop prior to impact where we can directly measure the drop velocity.
We use an aqueous solution of caesium chloride CsCl ( $\rho _1=998\text {--}1800\,\mathrm {kg}\,\mathrm {m}^{-3}$,
 $\mu _1=0.9 \times 10^{-3}\text {--}1.2 \times 10^{-3}\,\mathrm {Pa}\,\mathrm {s}$) in the drop, and water (
 $\rho _2=998\,\mathrm {kg}\,\mathrm {m}^{-3}$,
 $\mu _2=10^{-3}\,\mathrm {Pa}\,\mathrm {s}$) in the pool. In a few experiments, we also use pure ethanol (
 $\rho _1=790\,\mathrm {kg}\,\mathrm {m}^{-3}$,
 $\mu _1=1.2 \times 10^{-3}\,\mathrm {Pa}\,\mathrm {s}$) in the drop. The density is measured for each experiment using an Anton Paar DMA 35 Basic densitometer. Since the typical measurement errors on density are less than 0.1 %, we neglect errors on density. We obtain viscosities using data from Haynes (Reference Haynes2016). We neglect errors on viscosity since the typical error is less than 0.01 %. The surface tension at the air–water interface is
 $\sigma =72.8\pm 0.4\,\mathrm {mJ}\,\mathrm {m}^{-2}$ (Haynes Reference Haynes2016).
We obtain errors on the velocity and radius of the impacting drop from the variability in mass measurements and from error propagation in the velocity model, respectively. We then propagate uncertainties on fluid properties and impact parameters to uncertainties on the dimensionless numbers ((2.1a–e) and (2.2a,b)).
We use two imaging configurations, backlight and laser-induced fluorescence (LIF) configurations, most suited to determine the crater shape and characterise the mixing layer thickness, respectively. In both configurations, we position the camera at the same height as the water surface. We record images at 1400 Hz with a  $2560\times 1600$ pixels resolution (
 $34\,\,\mathrm {\mu } \mathrm {m}\,\mathrm {pixel}^{-1}$), and a 12 bits dynamic range, using a high-speed Phantom VEO 640L camera and a Tokina AT-X M100 PRO D Macro lens.
2.2.2. Backlighting
In the backlight configuration (figure 3a), we measure the evolution of the mean crater radius. The crater is illuminated from behind by a light emitting diode (LED) backlight panel and it appears dark owing to refraction of light at the air–water interface. Image processing involves spatial calibration using a sight, background removal, intensity threshold, image binarisation, and allows us to determine the crater boundary.
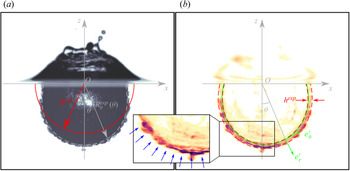
(a) Detection of the crater boundary. The dashed line corresponds to the fitted crater boundary using a set of shifted Legendre polynomials up to degree  $l=5$, the degree
 $l=0$ gives the solid line corresponding to the mean crater radius. (b) Detection of the mixing layer. The solid line corresponds to the fitted crater boundary using a set of Legendre polynomials up to degree
 $l=5$. The dashed lines correspond to the weighted average of the mixing layer boundaries, calculated using the second moment of the LIF intensity about the mean position of the layer. Blue arrows indicate the position of the plumes produced by the instability.

We then fit the experimental crater boundary radius  $R_\theta ^{{exp}}(\theta,t)$, which depends on the polar angle
 $\theta$ and time
 $t$, using a set of shifted Legendre polynomials
 $\tilde {P}_l$ up to degree
 $l=5$, as follows:
 \begin{equation} R_\theta^{{exp}}(\theta,t)=\sum_{l=0}^5 a_l^{{exp}}\tilde{P}_l(\cos\theta), \end{equation}
where  $a_l^{{exp}}$ are the experimental fitted coefficients. The shifted Legendre polynomials are an affine transformation of the standard Legendre polynomials
 $\tilde {P}_l(x)=P_l(2x-1)$, and are orthogonal on
 $[0,1]$, i.e. on a half-space. We obtain the experimental mean crater radius from the
 $l=0$ coefficient, i.e.
 $R^{{exp}}=a_0^{{exp}}$.
Uncertainties are dominated by the extrinsic variability between experiments in the same configuration. We repeat each experiment at least four times consecutively in order to estimate uncertainties on dimensionless parameters and target quantities. This allows us to include uncertainties resulting from reflections and refraction at the crater boundary. In comparison, the intrinsic uncertainties related to the spatial resolution of the camera, spatial calibration and image processing, are small. Spatial resolution of the camera,  $30\,\mathrm {pixel}\,\mathrm {mm}^{-1}$, is adequate given the size of the target, allowing this uncertainty to be neglected. We also neglect spatial calibration errors, typically around 0.2 pixel. Finally, given the camera resolution and dynamic range, we obtain a good contrast on the crater and the impacting drop, which allows us to neglect errors related to image processing.
2.2.3. LIF
In the LIF configuration (figure 3b), we measure the thickness of the mixing layer and the number of plumes produced by the RT instability. The fluorescent dye (Rhodamine 6G,  $1.5\,\mathrm {mg}\,\mathrm {l}^{-1}$) contained in the fluid of the drop is excited by a vertical laser sheet (532 nm). The fluorescent dye then re-emits light between 500 and 700 nm. This emission signal is then recorded by the camera and isolated from the laser signal with a long-pass filter (
 ${>}540$ nm). We generate the laser sheet using a 10 W Nd:YAG continuous laser in combination with a divergent cylindrical lens and a telescope, producing a 1 mm thick sheet. We divert the laser sheet vertically using a
 $45^\circ$ mirror beneath the tank. In order to isolate the mixing layer, we process images with spatial calibration using a sight, background removal, and laser sheet corrections, removing sheet inhomogeneities. We then filter and remove artefacts due to reflections on the surface and on the air–water interface. In particular, we remove the internal reflection of the mixing layer (e.g. figure 2c). We eventually obtain a measured LIF intensity field from which we can identify the mixing layer. Scalar diffusion of the dense liquid is negligible since the diffusion length during crater opening (typically 50 m s) is approximately
 $10\,\mathrm {\mu }\mathrm {m}=0.3\,\mathrm {pixel}$. During crater opening, diffusion of Rhodamine 6G is even more negligible.
As for the backlight configuration, we fit the position of the experimental crater boundary  $R_\theta ^{{exp}}(\theta,t)$, which corresponds to the inner boundary of the mixing layer, using a set of shifted Legendre polynomials up to degree
 $l=5$. We then define a local frame of reference
 $(\boldsymbol {e_r'},\boldsymbol {e_\theta }')$, where
 $\boldsymbol {e_r'}$ is normal to the fitted crater boundary and
 $\boldsymbol {e_\theta '}$ is tangent to it. For each polar position
 $\theta$ about the crater boundary, we calculate the local mean position of the mixing layer
 $\langle r' \rangle$, using the position of the pixels in the local frame of reference
 $(r',\theta )$ and the corresponding LIF intensity field
 $I$:
 \begin{equation} \langle r' \rangle(\theta)=\frac{\int r' I(r',\theta)\,\mathrm{d}r'} {\int I(r',\theta)\,\mathrm{d}r'}. \end{equation}
We then calculate the local standard deviation  $\sigma _{r'}$ about the local mean position of the mixing layer:
 \begin{equation} \sigma_{r'}(\theta)=\sqrt{\frac{\int \left[r'-\langle r' \rangle(\theta)\right]^2 I(r',\theta)\,\mathrm{d}r'}{\int I(r',\theta)\,\mathrm{d}r'}}. \end{equation}
We eventually obtain the experimental mixing layer thickness  $h^{{exp}}$ with
 \begin{equation} h^{{exp}}=\frac{\int_{-{\rm \pi}/2}^{{\rm \pi}/2} 2\sigma_{r'}({R_\theta^{{exp}}})^2|\sin\theta |w(\theta)\,\mathrm{d}\theta}{\int_{-{\rm \pi}/2}^{{\rm \pi}/2} (R_\theta^{{exp}})^2|\sin\theta |w(\theta)\,\mathrm{d}\theta}, \end{equation}
using a weighted average where  $w=1/[1+\exp \{k(|\theta |-\theta _0)\}]$ is a symmetric logistic weight function whose steepness is
 $k=30$ and whose sigmoid midpoint is
 $\theta _0={\rm \pi} /3$. The logistic function allows us to give more weight to the bottom of the crater, between
 $\theta =0$ and
 $\theta =\theta _0$, and less to the top of the crater, close to
 $\theta =\pm {\rm \pi}/2$. The use of such a weight function is motivated by the polar dependency of the LIF signal quality. The crater is indeed illuminated from below, so that the laser sheet undergoes absorption (due to the fluorescent dye) and refraction (due to small scale variations of the index of refraction) as it goes through the mixing layer. Imaging of the mixing layer may also be perturbed directly by the air–water interface, causing reflection of the laser sheet. Consequently, close to the surface, i.e. at
 $\theta =\pm {\rm \pi}/2$, imaging of the mixing layer may undergo significant perturbations, leading to a poor estimate of its extent. All these effects are amplified when the crater slightly deviates from a hemispherical shape. When the drop is denser than the pool, the crater is stretched downward, leading to an ellipsoidal crater centred below the surface of the pool. At low Weber and Froude numbers, the crater is also deformed by the propagation of a capillary wave which is superimposed on the density effects. The path of the laser sheet through the mixing layer thus increases, and is more likely to cross the air–water interface.
We also count manually the number of plumes produced by the RT instability for each experiment at the same dimensionless time  $t^* \sim 10$ (figure 3b, inset). This time was chosen from visual inspections, which suggest that at this time the plumes have not yet interacted significantly with each other, which is relevant since this number of plumes is to be compared with a scaling of the early-time instability wavelength (Appendix A).
As in the backlight configuration, uncertainties are dominated by the extrinsic variability between experiments in the same configuration, and hence, we repeat each experiment at least four times consecutively. We neglect intrinsic uncertainties related to the spatial resolution of the camera, the spatial calibration and image processing, since as in the backlight configuration they are still comparatively small.
3. Phenomenology
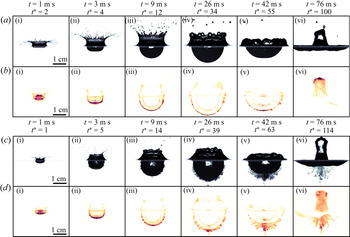
In our experiments, the development of the RT instability is governed by the crater evolution following the impact, and particularly by its acceleration history. Using both backlight and LIF configurations, we characterise the air–water interface evolution and the mixing layer evolution. From these measurements, we describe the observed RT instability. We base our description on two typical experiments, with and without density contrast, with similar evolution of the crater radius, in the backlight (figure 4a,c) and the LIF configurations (figure 4b,d). Experiments without density contrast are also available as animations in supplementary movie 1 (backlight configuration) and supplementary movie 2 (LIF configuration), while experiments with density contrast are available in supplementary movie 3 (backlight configuration) and supplementary movie 4 (LIF configuration) – available at https://doi.org/10.1017/jfm.2022.111.
Liquid drop impact onto a deep liquid pool without density contrast ( $\rho _1/\rho _2=1$) in the backlight (
 $Fr=483$) (a) and the LIF (
 $Fr=481$) (b) configuration. Liquid drop impact onto a deep liquid pool with density contrast (
 $\rho _1/\rho _2=1.8$) in the backlight (
 $Fr=542$) (c) and the LIF (
 $Fr=572$) (d) configuration. The liquid drop impact sequences are also available as animations in supplementary movies 1 (a), 2 (b), 3 (c) and 4 (d).

3.1. Crater geometry
The impact of the drop first causes the formation of an impact crater with a flat bottom due to the spreading of the drop (figure 4a, i). The liquid of the drop is deformed and accumulated on the crater floor (figure 4b, i) on a time scale  $t^* \simeq 2\text {--}3$, akin to previous results (e.g. Engel Reference Engel1961, Reference Engel1962). As the crater grows, the cavity becomes hemispherical, on a time scale
 $t^* \simeq 10$, as a result of the overpressure produced at the contact point between the impacting drop and the surface (figure 4a, ii,iii). The liquid of the drop then spreads over the crater sides toward the surface, producing a layer with an approximately uniform thickness at the surface of the crater (figure 4b, iii,iv).
The impact also produces a cylindrical fluid crown (Fedorchenko & Wang Reference Fedorchenko and Wang2004) (figure 4a, i–iv), along with a surface wave propagating radially outward from the crater on the horizontal surface (Leng Reference Leng2001). As can be seen from the LIF intensity field (figure 4b, i–iv), the fluid of the drop mostly accumulates on the surface of the crater, leaving the crown mainly composed of fluid from the pool. As soon as the crown decelerates, the cylindrical sheet produces liquid ligaments around the crown rim, which eventually fragment into drops (figure 4a, ii,iii) (Krechetnikov & Homsy Reference Krechetnikov and Homsy2009; Zhang et al. Reference Zhang, Brunet, Eggers and Deegan2010; Agbaglah et al. Reference Agbaglah, Josserand and Zaleski2013).
When the crater reaches its maximum size, the crater is almost hemispherical (figure 4a, iv). When  $\rho _1/\rho _2>1$, the crater cavity is entrained downward, which stretches vertically the crater (figure 4c, iv). After reaching its maximum size, the crater starts to collapse due to buoyancy forces (figure 4a, v). The resulting converging flow leads to the formation of a thick upward jet which, in view of the LIF intensity field (figure 4b, vi), appears to be made mostly of liquid from the drop.
3.2. RT instability
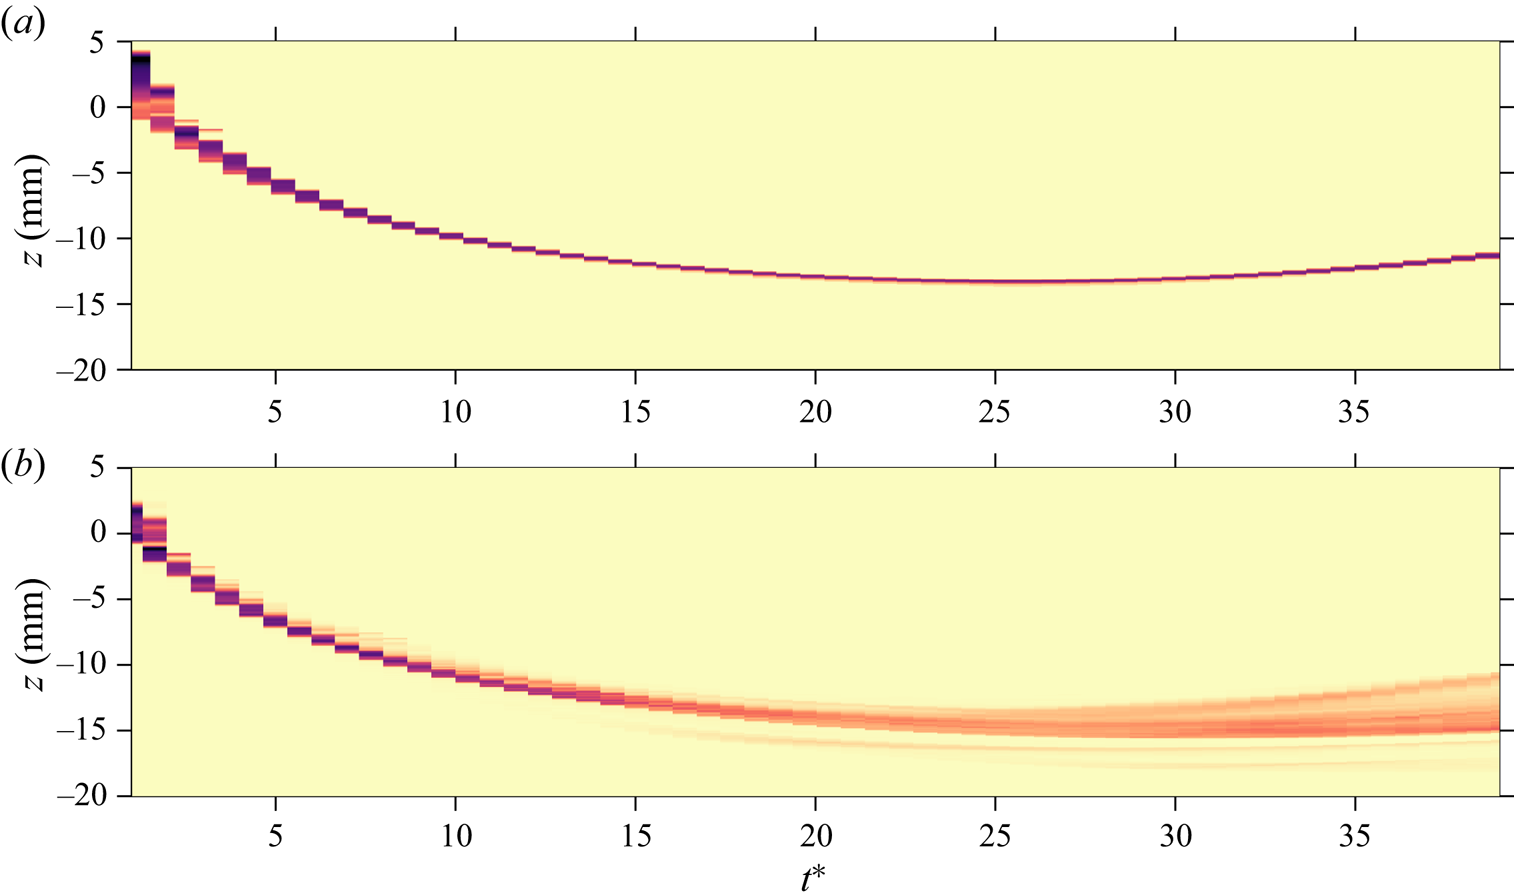
The presence of an instability at the interface between the drop and target fluids is particularly clear when comparing experiments without and with a density contrast between the two liquids (figure 4). We will also base our description on figure 5, which shows composite images obtained from sequences of LIF images from these two experiments. They are built by extracting from each LIF image a column of pixels centred on the crater vertical axis of symmetry, before juxtaposing them to show the LIF intensity as a function of vertical position and time. This provides a qualitative picture of the evolution of the radial dispersion of the liquid drop.
Composite images showing the LIF intensity as a function of vertical position and time, on the crater axis of symmetry ( $\theta =0$). The two panels have been build from experiments without (a) (
 $\rho _1/\rho _2=1.0$) and with (b) (
 $\rho _1/\rho _2=1.8$) a density contrast between the drop and the pool. The surface of the pool prior to impact is at
 $z=0$.

The early-time evolution of the drop liquid is similar in both experiments up to  $t^*\sim 10$. The liquid from the drop spreads over the crater floor and forms a thin layer of approximately uniform thickness (figure 4 (all subpanels i,ii) and figure 5). In the experiment with no density contrast (figure 4a,b and figure 5a), the thickness of the layer keeps decreasing with time as the crater grows. This is a direct consequence of the crater expansion, the liquid of the drop being redistributed over an increasingly large surface area.
The behaviour of the layer is markedly different when the drop is denser than the pool. Figure 4(c,d) and figure 5(b) show that the thickness of the mixing layer initially decreases up to  $t^* \simeq 10$, but it then increases over time while small scale corrugations of the interface evolve into radially growing plumes. The fine scale structure of the layer as seen from the LIF intensity field (figure 4d, iii,iv) is reminiscent of the structure of mixing layers observed in RT experiments in planar configurations (e.g. Dalziel et al. Reference Dalziel, Linden and Youngs1999).
These observations can be rationalised as follows. During the crater opening phase, the rate at which the crater grows gradually decreases with time, which results in a deceleration of the boundary between the mixing layer and the surrounding liquid. This situation is known to be unstable with respect to the RT instability when the liquid from the drop is heavier than the liquid from the pool (Taylor Reference Taylor1950). Measurements of the crater acceleration as a function of time (figure 7c of § 4.2) shows that the deceleration of the crater boundary can be more than 10 times larger than the acceleration of gravity, which explains why the dense liquid plumes grow radially outward rather than in the vertical direction. The growth of the RT instability tends to increase the thickness of the mixing layer. However, the expansion of the crater spreads the dyed liquid over an increasing large surface area, which tends to make the layer thinner. The competition between these two effects explains why the thickness of the mixing layer first decreases as the crater expands and then increases when the RT instability dominates.
The instability first goes through a stage where the perturbations of the interface are small in comparison with the radius of the crater and the wavelength of the instability (figure 4d, i,ii). The growth of the RT instability competes with the geometrical expansion of the crater, which stretches the instabilities, hence reducing the amplitude of the perturbations and increasing their wavelength. This initial stage is dominated by the fast vigorous crater expansion, which contributes to decrease the mixing layer thickness by spreading the volume of the layer over an increasingly large surface area. Considering the resolution of our experiments, we are not able to observe the small initial perturbations that could exist in spite of the vigorous crater expansion. We observe that the amplitude of the perturbations eventually reaches the same size as the instability wavelength at  $t^* \simeq 10$.
The two fluids involved being miscible, i.e. surface tension is zero, all wavenumbers are expected to be unstable with respect to the RT instability (Chandrasekhar Reference Chandrasekhar1955). In addition, owing to larger velocity gradients at large wavenumbers, viscosity is responsible for the energy dissipation of short wavelengths. The growth rate of the instability then decreases as the inverse of the wavenumber (Chandrasekhar Reference Chandrasekhar1961). Consequently, a mode of maximum instability depending on the acceleration history and impact parameters is expected to develop. This mode likely determines the typical number of plumes and the corresponding wavelength. The growth rate of the instability and the wavelength selection are also possibly influenced by the thin layer configuration, with a stabilising effect, if the mixing layer thickness is much smaller than the typical instability wavelength (Keller & Kolodner Reference Keller and Kolodner1954; Villermaux Reference Villermaux2020).
At longer times ( $t^* \gtrsim 10$), geometrical effects produced by crater expansion loose intensity and become comparable with the instability. This coincides with a stage where the instability is strongly influenced by three-dimensional effects, leading to the formation of plumes below the hemispherical surface of the crater (figure 4d, iii). As the instability grows towards a more turbulent layer, the mode of maximum instability is modified by nonlinear interactions. Plumes then start interacting with each other, producing a mixing layer (figure 4d, iv).
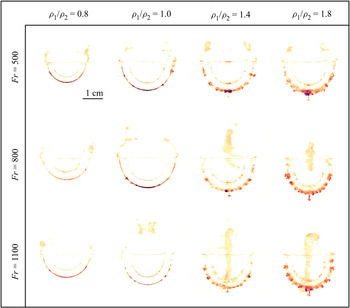
The importance of the density ratio is apparent in figure 6, which shows the LIF intensity when the crater reaches its maximum size, as a function of the Froude number and density ratio. For density ratios smaller than unity (first column), no instability is observed. For density ratios about unity (second column), small corrugations are observed between the dyed liquid and the ambient, possibly resulting from a large-scale shear instability in the layer. During crater opening, the air–water interface is not exactly hemispherical and the velocity field is not exactly radial (Bisighini et al. Reference Bisighini, Cossali, Tropea and Roisman2010). This creates a velocity shear across the interface, which may lead to the development of a Kelvin–Helmholtz instability. For density ratios larger than unity (third and fourth columns), the thickness of the dyed liquid layer is significantly larger than in other cases, as a consequence of the development of the RT instability. For a given Froude number, the mixing layer thickness obtained when the crater reaches its maximum size increases with the density ratio. For a given density ratio, the mixing layer thickness does not change significantly with the Froude number (figure 6).
Snapshots of the LIF intensity field when the crater reaches its maximum size, as a function of the Froude number and the density ratio.

A point of terminology may be in order here. The configuration of our experiments falls somewhat in-between the canonical RT configuration, in which the acceleration is constant, and incompressible Richtmyer–Meshkov instability, in which the acceleration changes impulsively (Richtmyer Reference Richtmyer1960; Meshkov Reference Meshkov1969; Jacobs & Sheeley Reference Jacobs and Sheeley1996). Since in our experiments the acceleration varies continuously during the crater opening phase, we have chosen to refer to it as an RT instability, as has been done before in the literature (e.g. Mikaelian Reference Mikaelian1990, Reference Mikaelian2016). However, the magnitude of the acceleration decreases quite fast, by almost two orders of magnitude, (figure 7c of § 4.2), giving it a somewhat impulsive nature. This suggests that the development of the instability may share some similarities with the Richtmyer–Meshkov instability.
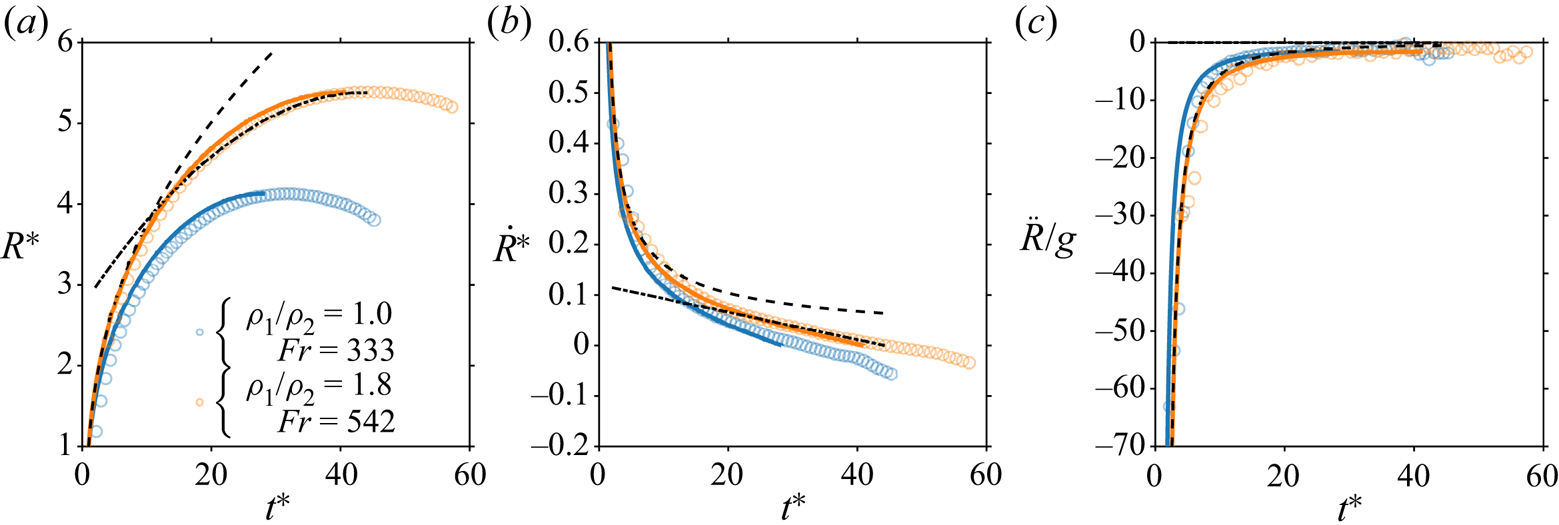
Time evolution of the normalised mean crater radius  $R^*$ (a), the normalised mean crater velocity
 $\dot {R}^*$ (b) and the mean crater acceleration
 $\ddot {R}$ normalised by the acceleration of gravity
 $g$ (c), for two impact parameters. Circles and solid lines correspond, respectively, to experimental data and fitted energy model (4.8). Dashed lines and dashed–dotted lines correspond, respectively, to early-time power-law solution (4.10) and late-time quadratic solution (4.13) with
 $\rho _1/\rho _2=1.8$ and
 $Fr=542$.

4. Evolution of the crater size
Experiments in the backlight configuration provide the time evolution and the maximum of the mean crater radius, a required step in the understanding of the RT instability. We derive an energy model for the evolution of the crater radius, velocity and acceleration and compare it with experiments, from which we obtain scaling laws for the maximum crater radius and the crater opening time.
4.1. Energy conservation model
We use an energy conservation model (Engel Reference Engel1966, Reference Engel1967; Leng Reference Leng2001) accounting for the density difference between the impacting drop and the targeted pool. We assume the crater shape to be hemispherical, and the flow around the crater to be incompressible and irrotational. Since the crater opening dynamics is mainly driven by impactor inertia ( $Re \gtrsim 2500$) and gravity forces, viscous dissipation is not included in the model. The formation of the crown and the surface wave during the impact, in particular their potential, kinetic, and surface energies, are not explicitly included in the model.
On the basis of these assumptions, the sum of the crater potential energy  $E_p$, the crater surface energy
 $E_\sigma$ and the crater kinetic energy
 $E_k$, at any instant of time is equal to the impacting drop kinetic energy
 $E_i$ just before the impact. The potential energy of the crater is
 \begin{equation} E_p=\iiint\rho_2gz\,\mathrm{d}V=\int_{0}^{R} \rho_2g{\rm \pi}(R^2-z^2)z\,\mathrm{d}z=\tfrac{1}{4} {\rm \pi}\rho_2 g R^4, \end{equation}
where  $R$ is the mean crater radius (§ 2) and
 $z$ is the depth. The crater surface energy corresponds to the formation of new surface due to crater opening. It is equal to the difference of surface energy between the initially planar surface area of the pool
 ${\rm \pi} R^2$ and the hemispherical surface area of the cavity
 $2{\rm \pi} R^2$, i.e.
 \begin{equation} E_\sigma=\sigma(2{\rm \pi} R^2-{\rm \pi} R^2)=\sigma{\rm \pi} R^2. \end{equation}
The crater kinetic energy corresponds to the kinetic energy of the pool fluid below the initial surface and is related to the flow velocity potential. A radial velocity potential of the form  $\varPhi =-A/r$, the solution of the Laplace equation
 $\nabla ^2\varPhi =0$, is able to satisfy the boundary conditions at
 $r=R$. At the crater boundary, the radial velocity is
 $u_r(r=R)=(\partial \varPhi /\partial r)_{r=R}=\dot {R}$, giving
 $A=\dot {R}R^2$ and
 \begin{equation} \varPhi={-}\frac{\dot{R}R^2}{r}. \end{equation}
The radial velocity, the tangential velocity and the resulting velocity are, respectively,
 \begin{gather} \left. \begin{gathered} u_r =\frac{\dot{R}R^2}{r^2},\\ u_\theta =0,\\ \|\boldsymbol{u}\| =\sqrt{u_r^2+u_\theta^2}=\frac{\dot{R}R^2}{r^2}.\end{gathered} \right\} \end{gather}
The crater kinetic energy is then
 \begin{equation} E_k=\int\frac{1}{2}\rho_2\|\boldsymbol{u}\|^2\,\mathrm{d}V =\int_{R}^{+\infty}{\rm \pi}\rho_2\dot{R}^2R^4\frac{1}{r^2}\,\mathrm{d}r ={\rm \pi}\rho_2R^3\dot{R}^2. \end{equation}
The impacting drop kinetic energy is
 \begin{equation} E_i=\tfrac{2}{3} {\rm \pi}\rho_1 R_i^3 U_i^2. \end{equation}
Energy conservation between  $E_p$,
 $E_\sigma$,
 $E_k$ and
 $E_i$ gives
 \begin{equation} \tfrac{1}{4} \rho_2 g R^4 + \sigma R^2 + \xi \rho_2 R^3 \dot{R}^2 = \tfrac{2}{3} \phi \rho_1 R_i^3 U_i^2, \end{equation}
where  $\phi$ and
 $\xi$ are fitted parameters. The coefficient
 $\phi$ corresponds to a correction parameter accounting for the terms not included in the model, i.e. viscous dissipation and crown energy terms. The coefficient
 $\xi$ is a correction parameter accounting for the difference between the deliberately simplified velocity field used in the model and the true flow.
Normalising the crater radius and opening velocity by the impacting drop radius  $R_i$ and velocity
 $U_i$, respectively, energy conservation becomes
 \begin{equation} \frac{1}{4} \frac{1}{Fr^*}{R^*}^4 + \frac{1}{Fr^*Bo} {R^*}^2 + \xi\left(\frac{\rho_1}{\rho_2}\right)^{{-}1} {R^*}^3 {\dot{R^*}}^2 = \frac{2}{3}\phi, \end{equation}
where  $R^*=R/R_i$ and
 $\dot {R}^*=\dot {R}/U_i$ are dimensionless.
For each experiment, we calculate  $\phi$ as follows. Assuming that the velocity field vanishes simultaneously in the pool (Prosperetti & Oguz Reference Prosperetti and Oguz1993), the crater kinetic energy vanishes when the crater reaches its maximum size, which, taking
 $R^*=R_{max}^{*^{exp}}$ and
 $\dot {R}^*=0$ in (4.8), gives
 \begin{equation} \phi=\frac{3}{2}\frac{1}{Fr^*}\left(R_{max}^{*^{{exp}}}\right)^2\left[\frac{1}{4}\left(R_{max}^{*^{{exp}}}\right)^2+\frac{1}{Bo}\right]. \end{equation}
Knowing  $\phi$, we then fit the time evolution of the mean crater radius to the experiments with (4.8) using a least squares method, the kinetic energy correction parameter
 $\xi$ being a fit parameter. Fitting
 $\phi$ and
 $\xi$ for each experiment shows that both parameters depend on the Froude number (see Appendix B for details). Knowing
 $\phi$ and
 $\xi$, we solve the ordinary differential equation (4.8) using the boundary condition
 ${R^*}(1)=1$. This assumes that the crater radius is initially the same as the drop radius, at
 $t=R_i/U_i$.
4.2. Time evolution
Figure 7 shows the evolution of the mean crater radius (figure 7a), the mean crater velocity (figure 7b) and the mean crater acceleration (figure 7c). This figure compares the fitted energy model with experimental data, in two reference cases, with and without density difference between the impacting drop and the pool. In both cases, the fitted mean crater radius, opening velocity and acceleration are in close agreement with the experimental data. In the  $\rho _1/\rho _2=1$ case,
 $\phi =0.40$ and
 $\xi =0.35$. In the
 $\rho _1/\rho _2=1.8$ case,
 $\phi =0.39$ and
 $\xi =0.34$. Experimental data are consistent with the qualitative observations of § 3. The crater first opens, before it reaches its maximum size and eventually starts to collapse.
At early times, the crater potential and surface energies are negligible in comparison with the crater kinetic energy. This implies that the kinetic energy of the impactor is converted exclusively into kinetic energy of the flow around the crater. We thus neglect the two first terms on the left-hand side of (4.8), which in this limit gives
 \begin{gather} \left. \begin{gathered} {R^*} =\left[Q(t^*-1)+1\right]^{2/5},\\ \dot{R}^* =\frac{2}{5}Q\left[Q(t^*-1)+1\right]^{{-}3/5},\\ \ddot{R}^* = {-}\frac{6}{25}Q^2\left[Q(t^*-1)+1\right]^{{-}8/5}, \end{gathered} \right\} \end{gather}
where
 \begin{equation} Q=\left(\frac{25}{6}\frac{\phi}{\xi}\frac{\rho_1}{\rho_2}\right)^{1/2}. \end{equation}
This consistently verifies the imposed boundary condition  ${R^*}(1)=1$, and depends on the density ratio
 $\rho _1/\rho _2$, and on the correction parameters
 $\phi$ and
 $\xi$. It is in agreement with experimental data at early times (figure 7, dashed lines) and similar scaling laws from previous works (Leng Reference Leng2001; Bisighini et al. Reference Bisighini, Cossali, Tropea and Roisman2010).
At late times, the crater velocity becomes very small. If surface tension can be neglected, taking the time derivative of (4.8), and then making the assumption  $\dot {R}^*=0$ gives
 \begin{equation} \ddot{R}^*={-}\frac{1}{2}\frac{1}{Fr\xi}. \end{equation}
Using  ${R^*}(t_{max}^*)=R_{max}^*$ and
 $\dot {R}^*(t_{max}^*)=0$ as boundary conditions, we obtain a quadratic solution:
 \begin{gather} \left. \begin{gathered} \ddot{R}^* ={-}\frac{1}{2}\frac{1}{Fr\xi},\\ \dot{R}^* ={-}\frac{1}{2}\frac{1}{Fr\xi}(t^*-t_{max}^*),\\ {R^*} = R_{max}^*-\frac{1}{4}\frac{1}{Fr\xi}(t^*-t_{max}^*)^2. \end{gathered} \right\} \end{gather}
This is in good agreement with experimental data at late times using the experimentally determined values of  $R_{max}^*$ and
 $t_{max}^*$ (figure 7, dash–dotted lines). Using scaling laws for
 $R_{max}^*$ and
 $t_{max}^*$ (to be obtained in § 4.3), the late-time quadratic evolution of the mean crater radius can be fully predicted as function of
 $\phi$ and
 $\xi$.
4.3. Maximum crater radius and opening time
We first consider the limit of no surface tension ( $Bo \to +\infty$), which amounts to neglecting the second term on the left-hand side of (4.8). The maximum size of the crater is then obtained by taking
 $\dot {R}^*=0$ in (4.8), before solving for
 ${R^*}$ to obtain
 \begin{equation} R_{max|Bo \to +\infty}^*=\left(\tfrac{8}{3}\right)^{1/4}\phi^{1/4} Fr^{*^{1/4}}. \end{equation}
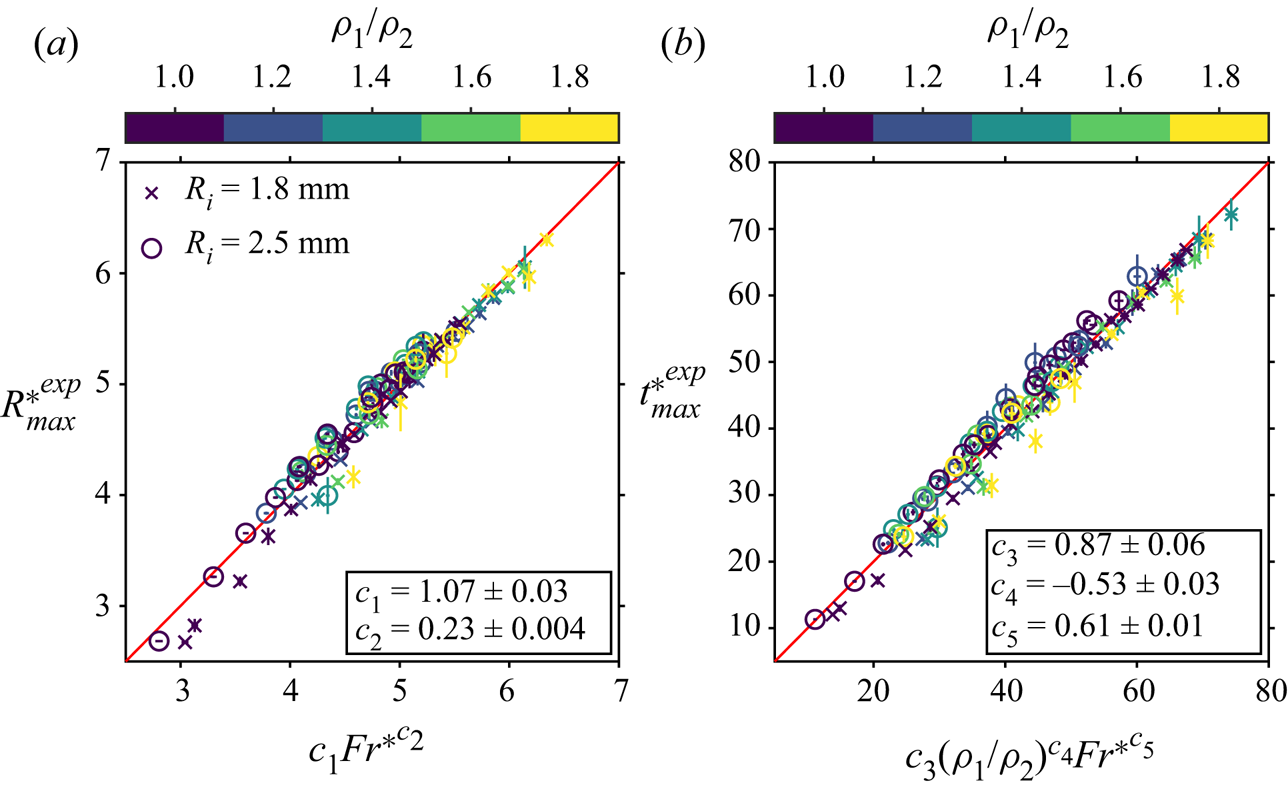
Figure 8(a) shows the maximum crater size in our experiments as a function of a least squares best-fit power law scaling in the form
 \begin{equation} R_{max}^{*^{{lsq}}}=c_1Fr^{*^{c_2}}. \end{equation}
The exponent  $c_2=0.23\pm 0.004$ for
 $Fr^*$ is close to the theoretical
 $1/4$ prediction of (4.14), and is in agreement with previous works on liquids (Prosperetti & Oguz Reference Prosperetti and Oguz1993; Leng Reference Leng2001; Bisighini et al. Reference Bisighini, Cossali, Tropea and Roisman2010) and granular materials (Walsh et al. Reference Walsh, Holloway, Habdas and de Bruyn2003; Takita & Sumita Reference Takita and Sumita2013). The prefactor
 $c_1=1.07\pm 0.03$ is close to the value predicted by the model (4.14): since
 $\phi =0.38\pm 0.04$ in our experiments, the predicted model prefactor is indeed equal to
 $1.0\pm 0.03$. The prefactor
 $c_1$ is also consistent with those obtained in previous works (e.g.
 $c_1=1.1$ in Leng (Reference Leng2001)).
(a) Experimental normalised maximum crater radius  $R_{max}^{*^{exp}}$, as a function of the least squares best-fit power-law scaling
 $R_{max}^{*^{lsq}}$ (4.15). (b) Experimental normalised crater opening time
 $t_{max}^{*^{exp}}$, as a function of the least squares best-fit power-law scaling
 $t_{max}^{*^{lsq}}$ (4.18). Colours scale as the density ratio
 $\rho _1/\rho _2$. Circles and crosses correspond, respectively, to large and small drop size series.

We now turn to estimating the crater opening time, defined as the time  $t_{max}^*$ at which the maximum crater size is reached. Having neglected surface tension, we integrate equation (4.8) between
 $t^*=0$ and
 $t^*=t_{max|Bo \to +\infty }^*$ to obtain
 \begin{equation} t_{max|Bo \to +\infty}^* = \xi^{1/2} \left(\frac{\rho_1}{\rho_2} \right)^{{-}1/2} \int_0^{R_{max|Bo \to +\infty}^*} \frac{{R^*}^{3/2}}{\left(\dfrac{2}{3}\phi -\dfrac{1}{4}\dfrac{{R^*}^4}{Fr^*} \right)^{1/2} } \,\mathrm{d}{R^*}. \end{equation}
Using (4.14) for  $R_{max|Bo \to +\infty }^*$ and integrating, we obtain
 \begin{equation} t_{max|Bo \to +\infty}^*=\frac{1}{2}\left(\frac{8}{3}\right)^{1/8}\mathrm{B}\left(\frac{1}{2},\frac{5}{8}\right)\left(\frac{\rho_1}{\rho_2}\right)^{{-}1/2} \phi^{1/8} \xi^{1/2} Fr^{*^{5/8}}, \end{equation}
where  $\mathrm {B}$ is the beta function.
Figure 8(b) shows the opening time in our experiments as a function of a least squares best-fit power law scaling in the form
 \begin{equation} t_{max}^{*^{{lsq}}}=c_3(\rho_1/\rho_2)^{c_4}Fr^{*^{c_5}}. \end{equation}
The exponent  $c_4=-0.53\pm 0.03$ for
 $\rho _1/\rho _2$ agrees with the theoretical
 $-1/2$ prediction of (4.17). The exponent
 $c_5=0.61\pm 0.01$ for
 $Fr^*$ is also close to the
 $5/8=0.625$ prediction of (4.17), and agrees with previous works at
 $\rho _1/\rho _2=1$ (Leng Reference Leng2001; Bisighini et al. Reference Bisighini, Cossali, Tropea and Roisman2010). The prefactor
 $c_3=0.87\pm 0.06$ is close to the value predicted by (4.17): since
 $\phi =0.38\pm 0.04$ and
 $\xi =0.34\pm 0.03$ in our experiments, the prefactor predicted by the model is indeed equal to
 $0.79\pm 0.04$. The prefactor
 $c_3$ is also consistent with prefactors obtained in previous works (e.g.
 $c_3=0.59$ in Leng (Reference Leng2001)).
In the above paragraphs, we develop a leading-order model that neglects surface tension. We now consider the effect of surface tension on the maximum crater size and crater opening time. With only the kinetic energy term set to zero in (4.8), we obtain the maximum crater radius including surface tension:
 \begin{equation} R_{max}^*=R_{max|Bo \to +\infty}^*\left[\sqrt{1+\frac{3}{2}(\sqrt{Fr^*\phi}Bo)^{{-}2}}-\frac{\sqrt{6}}{2}(\sqrt{Fr^*\phi}Bo)^{{-}1}\right]^{1/2}. \end{equation}
This scaling depends on the dimensionless parameter  $(\sqrt {Fr^*\phi }Bo)^{-1}$, which brings in the effect of surface tension on the cratering dynamics. When
 $Bo \to +\infty$, we have
 $(\sqrt {Fr^*\phi }Bo)^{-1} \to 0$ and we retrieve the scaling without surface tension (4.14).
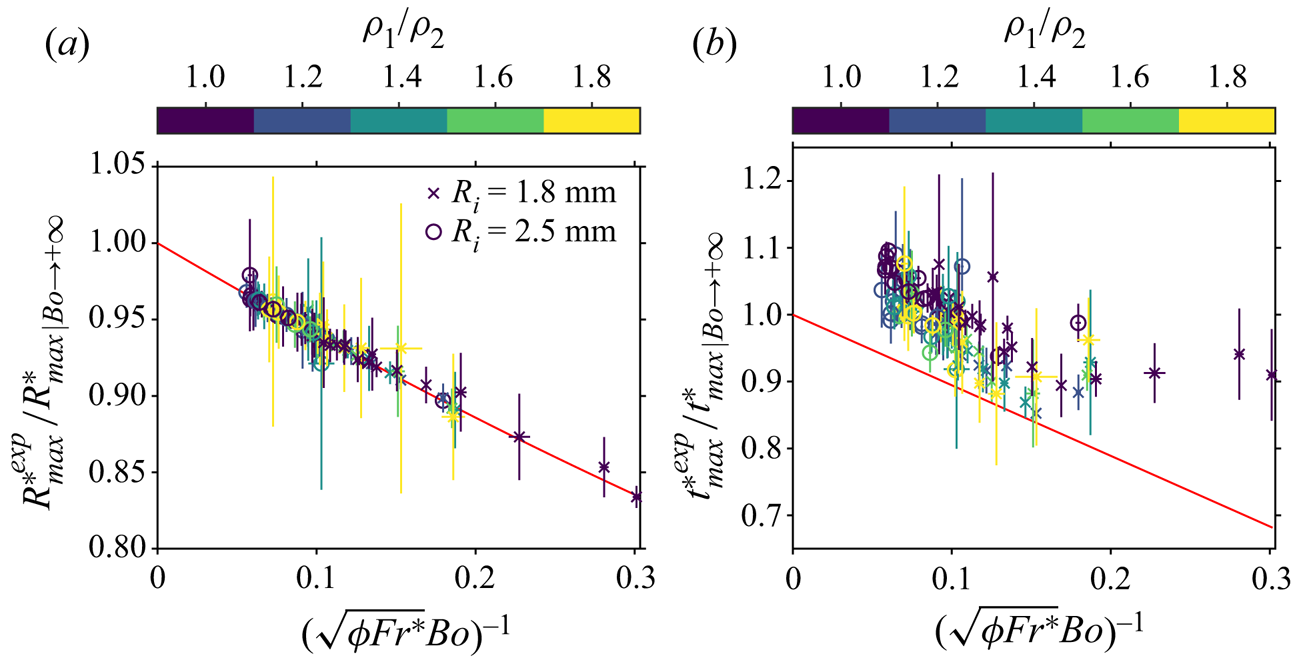
Figure 9(a) shows the maximum crater radius normalised by the maximum crater radius scaling without surface tension  $R_{max}^{*^{{exp}}}/R_{max|Bo \to +\infty }^*$, as a function of
 $(\sqrt {Fr^*\phi }Bo)^{-1}$. This corresponds to the ratio between the experimental data and the scaling law without surface tension (4.14). As expected, the scaling without surface tension overestimates the experimental maximum crater radius because it neglects surface energy. This overestimate decreases with
 $(\sqrt {Fr^*\phi }Bo)^{-1}$, i.e. when surface tension effects become negligible in comparison with impactor inertia and gravity forces. The difference between experimental data and the scaling law without surface tension is properly accounted for by (4.19).
(a) Experimental maximum crater radius normalised by the maximum crater radius scaling without surface tension  $R_{max}^{*^{exp}}/R_{max|Bo \to +\infty }^*$ (4.14), as a function of
 $1/(\sqrt {\phi Fr^{*}}Bo)$. The solid line corresponds to the surface tension correction of (4.19). (b) Experimental crater opening time normalised by the crater opening time scaling without surface tension
 $t_{max}^{*^{exp}}/t_{max|Bo \to +\infty }^*$ (4.17), as a function of
 $1/(\sqrt {\phi Fr^{*}}Bo)$. The solid line corresponds to the surface tension correction of (4.22). Colours scale as the density ratio
 $\rho _1/\rho _2$. Circles and crosses correspond, respectively, to large and small drop size series.

We finally obtain an expression for the crater opening time by integrating equation (4.8) between  $t^*=0$ and
 $t^*=t_{max}^*$:
 \begin{equation} t_{max}^* = \xi^{1/2} \left(\dfrac{\rho_1}{\rho_2} \right)^{{-}1/2} \int_0^{R_{max}^*} \dfrac{{R^*}^{3/2}}{\left(\dfrac{2}{3}\phi - \dfrac{{R^*}^2}{Fr^*Bo} - \dfrac{1}{4}\dfrac{{R^*}^4}{Fr^*} \right)^{1/2} } \,\mathrm{d}{R^*}. \end{equation}
Writing  $\mathcal {R}={R^*}/R_{max}^*$, this gives
 \begin{equation} t_{max}^* = t_{max|Bo \to +\infty}^* \frac{4}{\mathrm{B}\left(\frac{1}{2},\frac{5}{8}\right)} \int^1_0 \frac{f(x)^{5/4}\mathcal{R}^{3/2}}{\left[1 - \mathcal{R}^4 + 2xf(x)(\mathcal{R}^4 - \mathcal{R}^2)\right]^{1/2}}\,\mathrm{d}\mathcal{R}, \end{equation}
where  $f(x)=\sqrt {1+x^2}-x$ and
 $x=(2 Fr^* \phi Bo^2/3)^{-1/2}$. Using a first-order Taylor expansion in
 $(\sqrt {Fr^*\phi }Bo)^{-1}$, we obtain
 \begin{equation} t_{max}^* = t_{max|Bo \to +\infty}^* \left[1 - \frac{\sqrt{6}}{8}\frac{\mathrm{B}\left(\frac{1}{2},\frac{1}{8}\right)}{\mathrm{B}\left(\frac{1}{2},\frac{5}{8}\right)}(\sqrt{Fr^*\phi}Bo)^{{-}1} + \textit{O}((\sqrt{Fr^*\phi} Bo)^{{-}2})\right].\end{equation}
Figure 9(b) shows the crater opening time normalised by the crater opening time scaling without surface tension  $t_{max}^{*^{{exp}}}/t_{max|Bo \to +\infty }^*$, as a function of
 $(\sqrt {Fr^*\phi }Bo)^{-1}$. This corresponds to the ratio between experimental data and the scaling law without surface tension (4.17). Although this scaling law without surface tension is close to the experimental opening time, it increasingly overestimates experiments as
 $(\sqrt {Fr^*\phi }Bo)^{-1}$ increases, i.e. when surface tension effects become significant. When surface energy is significant, we indeed expect the crater to open at a slower rate. The difference between experimental data and the scaling law without surface tension is corrected in part by (4.22), which is in reasonable agreement with the experimental data (the relative error is
 ${\pm }10\,\%$). The residual differences between experimental and predicted crater opening time may come from our assumption that the correction parameters
 $\phi$ and
 $\xi$ are independent of time. This also explains why residual differences of the maximum crater radius are smaller. Since we obtain the maximum crater radius assuming that the kinetic energy term of (4.8) vanishes, we predict the maximum crater radius without time integration.
These scaling laws, with and without surface tension, are now discussed by normalising the time evolution of the crater radius for all experiments (figure 10). Figure 10(a) shows the crater radius normalised by scaling laws neglecting surface tension ((4.14) and (4.17)). With this normalisation, we expect the experimental crater radius to collapse on the case without surface tension (figure 10a, red line). However, we obtain a residual dependency on the dimensionless parameter related to surface tension  $(\sqrt {Fr^*\phi }Bo)^{-1}$. Figure 10(b) shows the crater radius normalised by scaling laws including surface tension ((4.19) and (4.22)). We find that the experimental crater radius collapses better when accounting for surface tension effects (figure 10b).
(a) Experimental mean crater radius normalised by the maximum crater radius scaling  $R^{*^{exp}}/R_{max|Bo \to +\infty }^*$, as a function of time normalised by the crater opening time scaling
 $t^*/t_{max|Bo \to +\infty }^*$, with scaling laws neglecting surface tension. (b) Experimental mean crater radius normalised by the maximum crater radius scaling
 $R^{*^{exp}}/R_{max}^*$, as a function of time normalised by the crater opening time scaling
 $t^*/t_{max}^*$, with scaling laws including surface tension. The thick solid line corresponds to the solution of (4.8) when
 $1/(\sqrt {\phi Fr^{*}}Bo)=0$, i.e. without surface tension. Colours scale as
 $1/(\sqrt {\phi Fr^{*}}Bo)$.

Although the maximum crater radius collapses in figure 10(b), there is a residual dispersion on the crater radius evolution at early times when surface tension effects are significant. This is explained by renormalising the crater radius as  $\tilde {R}={R^*}/R_{max|Bo \to +\infty }^*$ and time as
 $\tilde {t}=t^*/t_{max|Bo \to +\infty }^*$ in (4.8). This gives
 \begin{equation} \tilde{R}^4+\frac{\sqrt{6}}{\sqrt{Fr^*\phi}Bo}\tilde{R}^2 +\frac{16}{\mathrm{B}\left(\frac{1}{2},\frac{5}{8}\right)^2}\tilde{R}^3 \left(\frac{\mathrm{d}\tilde{R}}{\mathrm{d}\tilde{t}}\right)^2=1. \end{equation}
The surface tension term depends on  $(\sqrt {Fr^*\phi }Bo)^{-1}$, which results in a residual dispersion of experimental curves at early times. This remains correct when we normalise equation (4.8) with scaling laws including surface tension, although the surface tension term depends on
 $(\sqrt {Fr^*\phi }Bo)^{-1}$ in a different way. We also obtain a residual dispersion of the crater radius at late times (figure 10b). Since the energy model (4.8) applies only during the opening of the crater, we expect the experimental curves to collapse only when
 $t^*< t_{max}^{*^{{exp}}}$.
5. Evolution of the RT instability
Experiments in the LIF configuration allow us to describe quantitatively the evolution of the thickness of the mixing layer. Using the energy conservation model (§ 4), we derive a model for the mixing layer thickness evolution, from which we obtain scaling laws for the maximum mixing layer thickness. We also obtain a theoretical scaling for the early-time instability wavelength, which we compare with experiments (Appendix A).
5.1. Buoyancy–drag model
In addition to the energy conservation model assumptions (§ 4), we assume the mixing layer to be uniform with a constant thickness around the crater boundary. We first consider the situation where no instability develops. In this situation, the volume of the layer remains constant. As the crater radius increases, the drop liquid spreads over an increasingly large surface area and the mean layer thickness  $h$ thus decreases with time (figure 5a). Denoting by
 $\bar {u}(r,t)$ the laterally averaged velocity field associated with the opening of the crater, the time derivative of
 $h$ is then given by
 \begin{equation} \dot{h}=\bar{u}(R+h)-\bar{u}(R). \end{equation}
Since  $\bar {u}=\dot {R}(R/r)^2$ corresponds to the radial potential flow of (4.4), this gives
 \begin{equation} \dot{h}=\dot{R}\left[\frac{R^2}{(R+h)^2}-1\right], \end{equation}
where the right-hand side will be referred to as a geometrical thinning term. This equation originates from the mass conservation of the layer in the absence of instability.
We now consider the effect of the RT instability (figures 5b and 11), which we model as an entrainment process. Assuming that the ambient liquid is gradually incorporated into the mixing layer at a rate  $u'(t)$ (a volumetric flux), the time derivative of
 $h$ is then the sum of the geometrical thinning term (5.2) and entrainment rate
 $u'$ (figure 11c). The velocity
 $u'$ and length scale
 $h$ also correspond to the velocity and integral length scale of a mixing-length turbulent model describing the mixing layer. After non-dimensionalisation, this writes as
 \begin{equation} \dot{h}^*=\dot{R}^*\left[\frac{R^{*^2}}{(R^*+h^*)^2}-1\right]+u'^*. \end{equation}
Mixing layer evolution. After having spread quickly on the crater boundary to become a thick layer (a), the liquid layer of the drop gradually gets thinner as the crater grows (b). At some point, crater expansion becomes weak enough, allowing for the RT instability to develop (c). We decompose the velocity field into a velocity component  $\bar {u}$ produced by crater opening, and velocity fluctuations
 $u'$ produced by the RT instability.

Now  $u'$ can also be seen as the velocity the tip of the RT plumes would have in the absence of geometrical thinning. With this interpretation in mind, we describe the evolution of
 $u'$ using a buoyancy–drag model of the mixing layer (Dimonte Reference Dimonte2000; Oron et al. Reference Oron, Arazi, Kartoon, Rikanati, Alon and Shvarts2001; Zhou Reference Zhou2017). We consider that the RT plumes with a density
 $\bar {\rho }=\rho _2+\Delta \rho$ penetrate into the less dense surrounding liquid with a density
 $\rho _2$. The equation of motion then reads as
 \begin{equation} \bar{\rho}\frac{\mathrm{d}u'^*}{\mathrm{d}t^*}={-}\beta\Delta\rho\ddot{R}^*-C\rho_2\frac{u'^{*^2}}{h^*}, \end{equation}
where  $\beta$ and
 $C$ are the RT buoyancy prefactor and the drag coefficient, respectively. This equation corresponds to a balance between the fluid inertia on the left-hand side, buoyancy in the first term on the right-hand side, and inertial drag in the second term on the right-hand side. The acceleration of the crater boundary
 $\ddot {R}$ being significantly larger than
 $g$ (figure 7), we neglect Earth's gravity in the buoyancy term.
Using mass conservation in the uniform, hemispherical and thin mixing layer, the dimensionless density difference is
 \begin{equation} \dfrac{\Delta\rho}{\bar{\rho}}=\dfrac{1}{1+\dfrac{3}{2}{R^*}^2h^*\dfrac{\rho_2}{\Delta\rho_0}}, \end{equation}
where  $\Delta \rho _0$ is the initial density difference between the impacting drop and the pool. Inserting the density excess (5.5) into the equation of motion (5.4) made dimensionless, we obtain
 \begin{equation} \dfrac{\mathrm{d}u'^*}{\mathrm{d}t^*}={-}\beta\dfrac{\ddot{R}^*}{1+\dfrac{3}{2}{R^*}^2h^*\dfrac{\rho_2}{\Delta\rho_0}}-C\dfrac{1}{1+\dfrac{2}{3}\dfrac{1}{{R^*}^2h^*}\dfrac{\Delta\rho_0}{\rho_2}}\dfrac{u'^{*^2}}{h^*}. \end{equation}
Together with the crater radius evolution (4.8), (5.3) and (5.6) are coupled ordinary differential equations. We solve this initial value problem numerically using fixed initial conditions at  $t^*=1$. As in § 4, we choose
 $R^*(1)=1$, which means that the crater radius is initially the same as the drop radius. We choose the initial mixing layer thickness
 $h^*(1)$ by fitting the experiments without density contrast (
 $\rho _1/\rho _2=1$) with the system of differential equations without entrainment ((4.8) and (5.2)). Parameter
 $h^*(1)$ is a fitting parameter, as well as the energy partitioning coefficient
 $\phi$ and the kinetic energy correction coefficient
 $\xi$ (§ 4). We experimentally obtain
 $h^*(1)=h_0^*=0.62\pm 0.15$. This value is larger than the theoretical
 $h^*(1)=3^{1/3}-1 \simeq 0.44$ obtained when the liquid of the drop is distributed uniformly around a hemispherical crater with a radius
 ${R^*}(1)=1$. This may be explained by the non-hemispherical cavity at the beginning of crater opening, the initial accumulation of the fluid of the drop on the crater floor and possible initial interpenetration between the drop and the ambient fluid. We also choose
 $u'^*(1)=0$, assuming that the amplitude of the velocity fluctuations in the layer are initially small. For each experiment, using these fixed initial conditions, we use the experimentally measured crater radius
 $R^{*^{{exp}}}$ and mixing layer thickness
 $h^{*^{{exp}}}$ to determine the best value for the fitting parameters of the system of differential equations. This includes the energy partitioning coefficient
 $\phi$ and the kinetic energy correction coefficient
 $\xi$ (4.8), as well as the buoyancy prefactor
 $\beta$ and the drag coefficient
 $C$ (5.6). Fitting
 $\beta$ and
 $C$ for each experiment, we find that
 $C$ is a decreasing function of the density ratio, with no resolvable effect of the Froude number. Also,
 $\beta$ shows no resolvable trend with either the Froude number or the density ratio (see Appendix C for details).
5.2. Time evolution
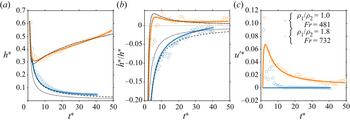
Figure 12 shows the evolution of the mixing layer thickness (figure 12a), growth rate (figure 12b) and of the estimated inward flux due to entrainment (figure 12c). This figure compares the fitted mixing layer evolution model with experimental data, in two reference cases, with or without a difference of density between the impacting drop and the pool. Experimental data are consistent with the qualitative observations of § 3. The mixing layer starts to thin due to crater expansion, with a negative growth rate. Then, when the density of the drop is larger than the target liquid, it thickens owing to the RT instability, with a positive growth rate.
Time evolution of the normalised mixing layer thickness  $h^*$ (a), the normalised mixing layer growth rate
 $\dot {h}^*/h^*$ (b) and the normalised inward flux due to entrainment
 $u'^*$ (estimated from (5.3)) (c), for two impact parameters with and without initial density difference. Circles and solid lines correspond, respectively, to experimental data and fitted buoyancy–drag model ((4.8), (5.3) and (5.6)). Dashed lines and dotted lines correspond, respectively, to the complete early-time power-law analytical solution (5.7) and the approximate early-time power-law analytical solution (5.9), calculated for the
 $\rho _1/\rho _2=1.0$ and
 $Fr=481$ experiment. Dash–dotted lines correspond to the late-time power-law analytical solution (5.15 with
 $h_0=0.62$,
 $\dot {h}_0=-1.14$ and
 $C=0.71$), calculated for the
 $\rho _1/\rho _2=1.8$ and
 $Fr=732$ experiment.

In figure 12(c), we estimate  $u'^*$ from (5.3) based on experimental measurements of
 ${R^*}$ and
 $h^*$, i.e.
 $u'^*$ is the difference between the measured time derivative of
 $h^*$ and the prediction of the model in the absence of entrainment. The model underestimates
 $u'^*$ for dimensionless times typically smaller than 10, for experiments with and without density difference. This underestimate may be explained by shear instabilities at the interface between the mixing layer and its surroundings (e.g. figure 6,
 $\rho _1/\rho _2=1.0$). These instabilities increase the growth rate of the layer and are neglected in the buoyancy–drag model, explaining why the model underestimates the inward flux
 $u'^*$. Furthermore, the liquid of the drop initially accumulates at the crater floor. Since the weighted average of the mixing layer thickness
 $h^*$ gives more weight to the bottom of the crater (2.7), the initial mean thickness is then larger in the experiments than in the model, where the layer thickness is uniform. The liquid of the drop then flows on the crater sides. For a given volume of the mixing layer, the measured layer velocity
 $\dot {h}^*$ is then larger than the early-time velocity predicted with a uniform mixing layer (5.1). This also explains why the uniform model underestimates the inward flux
 $u'^*$ in comparison with experimental data.
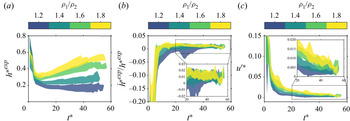
Figure 13 shows the mixing layer thickness  $h^{*^{exp}}$ (figure 13a), growth rate
 $\dot {h}^{*^{exp}}/h^{*^{exp}}$ (figure 13b), and the estimated entrainment term
 $u'^*$ (figure 13c) as a function of time, for all experiments, grouped by density ratio. As suggested by figure 6, the mixing layer evolution, due to the RT instability, is mainly dictated by the density ratio between the drop and its surroundings. In the entrainment stage (typically
 $t^*>15$), a larger initial density difference promotes entrainment by the RT instability through an increased entrainment term
 $u'^*$ (figure 13c), leading to an increased mixing layer growth rate (figure 13a,b). The local Reynolds number in the mixing layer depends on the density ratio and decreases with time, but is typically in the range 1–200.
Time evolution of the experimental normalised mixing layer thickness  $h^{*^{exp}}$ (a), the experimental mixing layer growth rate
 $\dot {h}^{*^{exp}}/h^{*^{exp}}$ (b) and the normalised inward flux due to entrainment
 $u'^*$ (c) (estimated from (5.3)). Experiments are clustered by density ratio group, the extent of which is defined by the standard deviation of the experiments in that group. Colours scale as the density ratio
 $\rho _1/\rho _2$.

5.3. Thinning stage, entrainment stage and transition time scale
We now focus on the numerical solution of the coupled ordinary differential equations (4.8), (5.3) and (5.6). Figure 14 shows the geometrical thinning term and the entrainment term in (5.3), as well as the buoyancy term and the drag term in (5.6), as a function of time. Based on this figure, we identify two stages in the evolution of the mixing layer.
(a) Geometrical thinning term (first term on the right-hand side), entrainment term (second term on the right-hand side) and  $\dot {h}^*$ (left-hand side) in (5.3), as a function of time. (b) Buoyancy term (first term on the right-hand side), drag term (second term on the right-hand side) and
 $\dot {u'}^*$ (left-hand side) in (5.6), as a function of time. In this numerical solution,
 $\rho _1/\rho _2=1.8$,
 $Fr=572$,
 $\phi =0.39$,
 $\xi =0.47$,
 $\beta =0.33$ and
 $C=1.34$.

The first stage, referred to as the thinning stage, is defined by a negative growth rate of the mixing layer, i.e.  $\dot {h}^*<0$ in figure 14(a). Its dynamics is controlled by the geometrical evolution of the crater, with the geometrical thinning term much larger than the RT entrainment term in (5.3) (figure 14a). Since the crater deceleration is large at early times, the buoyancy term prevails over the drag term in the buoyancy–drag equation (5.6) (figure 14b). However, this does not influence the evolution of the mixing layer since the geometrical thinning term dominates.
Neglecting the entrainment term  $u'^*$, and assuming
 $h^*(1)=h_0^*=0.62$ as initial condition for the thickness of the mixing layer, the solution of the differential equation (5.3) is
 \begin{equation} h^*=({R^*}^3-1+(h_0^*+1)^3)^{1/3}-{R^*}. \end{equation}
Using the power-law solution of  ${R^*}$ (4.10), we obtain an analytical solution for
 $h^*$ in the geometrical phase (figure 12, dashed lines). Assuming
 $h^* \ll {R^*}$, which is reasonable after a few time units (e.g. figure 4), (5.3) simplifies as
 \begin{equation} \dot{h}^*={-}2\dot{R}^*\frac{h^*}{{R^*}}. \end{equation}
The solution then takes the form
 \begin{equation} h^*=\frac{h_0^*}{{R^*}^2}. \end{equation}
These solutions correspond to the conservation of the initial volume of the impactor, i.e. a sphere of unit dimensionless radius. Using the power-law solution of (4.10), (5.9) also gives a power-law solution for the mixing layer thickness, velocity and acceleration:
 \begin{gather} \left. \begin{gathered} h^* =h_0^*[Q(t^*-1)+1]^{{-}4/5},\\ \dot{h}^* =\frac{-4}{5}h_0^*Q[Q(t^*-1)+1]^{{-}9/5},\\ \ddot{h}^* =\frac{36}{25}h_0^*Q^2[Q(t^*-1)+1]^{{-}14/5},\\ \end{gathered} \right\} \end{gather}
where
 \begin{equation} Q=\left(\frac{25}{6}\frac{\phi}{\xi}\frac{\rho_1}{\rho_2}\right)^{1/2}. \end{equation}
Consequently, a power-law solution for the mixing layer growth rate is
 \begin{equation} \frac{\dot{h}^*}{h^*}={-}\frac{4}{5}Q\left[Q(t^*-1)+1\right]^{{-}1}. \end{equation}
These solutions (figure 12, dotted lines) depend on the density ratio  $\rho _1/\rho _2$, and on the correction parameters
 $\phi$ and
 $\xi$, through
 $Q$. They explain the early-time evolution of the mixing layer thickness.
The second stage, referred to as the entrainment stage, is defined by a positive growth rate of the mixing layer, i.e.  $\dot {h}^*>0$ in figure 14(a). In this stage, spreading and entrainment are similar in magnitude. The dynamics is then governed by a balance between residual geometrical effects and entrainment produced by the RT instability. In this stage, the crater deceleration slows down and hence the buoyancy term quickly decreases. The rate of entrainment is therefore limited by the drag term (figure 14b). At late times, when the crater size is close to reaching its maximum, the geometrical thinning term vanishes and the dynamics is only controlled by the entrainment term (figure 14a).
In this stage, we use the approximation (5.8) for the geometrical term to simplify equation (5.3). We also neglect the buoyancy in (5.6) assuming
 \begin{equation} \frac{2}{3}\frac{\Delta\rho_0}{\rho_2}/({R^*}^2h^*) \ll 1. \end{equation}
These assumptions, respectively, correspond to the vanishing crater deceleration and  $\Delta \rho \ll \rho _2$ during the entrainment stage. With these assumptions, (5.3) and (5.6) become
 \begin{equation} \left. \begin{aligned} \dot{h}^* & ={-}2\frac{\dot{R}^*}{{R^*}}h^*+u'^*,\\ \dot{u'}^* & ={-}C\frac{u'^{*^2}}{h^*}. \end{aligned} \right\} \end{equation}
Assuming a  $2/5$ power-law solution for
 ${R^*}$ (4.10), and using
 $h^*(1)=h_0^*$ and
 $\dot {h}^*(1)=\dot {h}_0^*$ as initial conditions, the solution to (5.14) is
 \begin{equation}h^*=h_0^*[1+Q(t^*-1)]^{{-}4/5}\{1+K[[1+Q(t^*-1)]^{9/5} -1]\}^{{1}/({1+C})},\end{equation}
where
 \begin{equation} K=\frac{1}{9}(C+1)\left(4+\frac{5}{Q}\frac{\dot{h}_0^*}{h_0^*}\right) \end{equation}
(figure 12, dash–dotted lines). The value  $C=0.71$ required to fit experimental data is smaller than the value obtained by fitting experimental data with the full numerical model ((4.10), (5.3) and (5.6)). We explain this difference with the assumptions made to obtain the analytical solution, i.e. approximated geometrical term, neglected buoyancy term,
 $\Delta \rho \ll \rho _2$, and
 $2/5$ power-law for
 ${R^*}$. Using a larger value of
 $C$ in the analytical solution results in an underestimate of the layer thickness in the entrainment stage.
The transition time  $t_c$ between the thinning stage and the entrainment stage is the time at which the growth rate changes sign and the mixing layer thickness reaches a local minimum (figure 15a). This corresponds to the time at which geometrical effects exactly balance the entrainment produced by the RT instability.
(a) Experimental mixing layer thickness  $h^{*^{exp}}$ as a function of time, for a single experiment. The experimental transition time
 $t_c^{*^{exp}}$ between the thinning stage and the entrainment stage is defined as the time at which the mixing layer thickness reaches a local minimum. (b) Experimental transition time scale
 $t_c^{*^{exp}}$ as a function of the transition time
 $t_c^{*}$ predicted by the buoyancy–drag model ((4.8), (5.3) and (5.6)). (c) Experimental transition time scale
 $t_c^{*^{exp}}$ as a function of the transition time scaling
 $t_c^{*^{lsq}}$ (5.19). Colours scale as the density ratio
 $\rho _1/\rho _2$.

We measure the transition time in experiments, and in figure 15(b) we compare the experimental values with the transition time obtained from the numerical model. Although uncertainties on the transition time are significant due to the extrinsic variability of experiments, the numerical model is rather consistent with experimental data.
We now derive an approximate power-law for the transition time. We assume that  $h^* \ll {R^*}$, and hence we use the approximation (5.8) for the geometrical term to solve (5.3). We also simplify equation (5.6) assuming
 \begin{equation} \frac{2}{3}\frac{\Delta\rho_0}{\rho_2}/({R^*}^2h^*) \ll 1. \end{equation}
These assumptions correspond to  $\Delta \rho \ll \rho _2$, which is a reasonable assumption at the transition time. With these assumptions, (5.3) and (5.6) can be combined to give
 \begin{equation} \ddot{h}^* + 2(2C+1)\frac{\dot{R}^*}{{R^*}}\dot{h}^* + 2(2C-1)\frac{\dot{R}^{*^2}}{R^{*^2}}h^* + C\frac{\dot{h}^{*^2}}{h^*} + 2h^*\frac{\ddot{R}^*}{{R^*}} + \beta\frac{2}{3}\frac{\Delta\rho_0}{\rho_2}\frac{\ddot{R}^*}{R^{*^2}h^*} = 0. \end{equation}
At the critical transition time  $t_c$,
 $\dot {h}^*(t=t_c)=0$. Using the power-law solutions for
 ${R^*}$ (4.10) and
 $h^*$ (5.10) in the thinning stage, we obtain from (5.18) a scaling for the dimensionless transition time
 $t_c^*$:
 \begin{equation} t_c^{*^{lsq}}=c_6\left\{1+\frac{1}{Q}\left[\left(4{h_0^*}^2\frac{C+1}{\beta\frac{\Delta\rho_0}{\rho_2}}\right)^{5/6}-1\right]\right\}, \end{equation}
where  $c_6=1.36\pm 0.07$ is a least squares best-fit prefactor obtained from experimental data (figure 15c). As observed experimentally in figure 13, the predicted transition time (5.19) decreases with the density contrast between the fluid of the impacting drop and the pool. The larger the density contrast, the quicker entrainment effects become comparable to geometrical effects.
5.4. Maximum mixing layer thickness
The maximum mixing layer thickness  $h_{max}^*$ first depends on the growth rate of the RT instability in the entrainment stage, an increased initial density difference leading to an increased mixing layer growth rate (figure 13). The maximum thickness also depends on the time window available for the mixing layer to actually grow without being affected by geometrical effects. The transition time
 $t_c^*$ and the maximum opening time
 $t_{max}^*$ correspond, respectively, to the lower and upper limits of the available time window. Since
 $t_c^*$ and
 $t_{max}^*$ are, respectively, a decreasing function (5.19) and an increasing function (4.17) of the density ratio, we expect an increased density ratio to expand the time window available for entrainment, leading to an increased maximum mixing layer thickness, consistent with figure 13(a). Since
 $t_{max}^*$ also increases with the Froude number, we also expect the available time window and the maximum layer thickness to increase with the Froude number.
We first compare the experimental maximum mixing layer thickness  $h_{max}^{*^{exp}}$ with the maximum thickness
 $h_{max}^*$ obtained from the model (figure 16a). We obtain a good agreement. We then fit experimental data with the power-law scaling
 \begin{equation} h_{max}^{*^{{lsq}}}=c_7\left(\frac{\rho_1}{\rho_2}\right)^{c_8}Fr^{c_{9}}, \end{equation}
where  $c_7=0.04\pm 0.02$,
 $c_8=2.3\pm 0.2$ and
 $c_{9}=0.21\pm 0.06$ (figure 16b). We search a scaling law as a function of
 $\rho _1/\rho _2$ because
 $t_{max}^*$ and
 $t_c^*$ are strong functions of
 $\rho _1/\rho _2$ ((4.17) and (5.19)). Scaling (5.20) is consistent with the predicted influence of the density ratio and the Froude number on the mixing layer growth rate and the time window available for entrainment. We indeed obtain a maximum mixing layer thickness increasing with both the initial density ratio (
 $c_8>0$) and the Froude number (
 $c_{9}>0$). The fact that
 $c_8$ is significantly larger than
 $c_{9}$ is also consistent with the qualitative observations of figure 6, i.e. a maximum mixing layer thickness increasing mainly with the initial density ratio.
(a) Experimental normalised maximum mixing layer thickness  $h_{max}^{*^{exp}}$ as a function of the maximum thickness
 $h_{max}^*$ predicted by the buoyancy–drag model ((4.8), (5.3) and (5.6)). (b) Experimental normalised maximum mixing layer thickness
 $h_{max}^{*^{exp}}$ as a function of the least squares best-fit power-law scaling
 $h_{max}^{*^{lsq}}$ (5.20). Colours scale as the density ratio
 $\rho _1/\rho _2$.

6. Geophysical implications
We now apply our results to obtain a prediction of the amount of metal–silicate equilibration following an impact on a magma ocean. After the impact, the metal core of the colliding body migrates toward the planetary core due to the density contrast with the surrounding silicates (Rubie et al. Reference Rubie, Nimmo and Melosh2015). Part of the migration occurs in a fully molten magma ocean where the metal is expected to descend as a turbulent thermal and equilibrate with silicates (Deguen, Olson & Cardin Reference Deguen, Olson and Cardin2011; Deguen, Landeau & Olson Reference Deguen, Landeau and Olson2014). The metal phase then undergoes a vigorous stirring (Lherm & Deguen Reference Lherm and Deguen2018), leading to its fragmentation (Landeau, Deguen & Olson Reference Landeau, Deguen and Olson2014; Wacheul et al. Reference Wacheul, Le Bars, Monteux and Aurnou2014; Wacheul & Le Bars Reference Wacheul and Le Bars2018) into centimetric drops (Stevenson Reference Stevenson1990; Karato & Murthy Reference Karato and Murthy1997; Rubie et al. Reference Rubie, Melosh, Reid, Liebske and Righter2003; Ichikawa, Labrosse & Kurita Reference Ichikawa, Labrosse and Kurita2010). However, these turbulent thermal models assume that the metal cores are released as a compact volume in the magma ocean. In contrast, recent investigations show that the impactor core equilibrates with silicates during the impact stage, prior to the fall in the magma ocean (Kendall & Melosh Reference Kendall and Melosh2016; Landeau et al. Reference Landeau, Deguen, Phillips, Neufeld, Lherm and Dalziel2021). Our experiments confirm this result and show that an RT instability develops during the opening of the crater, possibly equilibrating metal and silicates.
In order to estimate the equilibration produced by the RT instability, we estimate the mass of ambient silicates entrained by the RT instability that is likely to equilibrate with the impacting metal core. For the sake of simplicity, we assume that the mass of entrained silicates fully equilibrates, i.e. mixes, with the metal of the impactor. When an impactor with a radius  $R_i$, a volume fraction of metal
 $f_m$, a metal core density
 $\rho _m$ and a silicate mantle density
 $\rho _s$, impacts a planetary target, the dimensionless mass of equilibrated silicates is
 $\Delta =M_s/M_m$, where
 $M_m=f_m\rho _m(4/3){\rm \pi} R_i^3$ is the mass of the metal core and
 $M_s=\rho _s[2{\rm \pi} R_{max}^2h_{max}-(4/3){\rm \pi} R_i^3]$ is the mass of entrained silicates (Deguen et al. Reference Deguen, Landeau and Olson2014). After non-dimensionalisation, the mass of silicates equilibrated with metal during crater opening is
 \begin{equation} \Delta=\frac{\rho_s}{\rho_m}\left(\frac{3}{2}\frac{1}{f_m}R_{max}^{*^2}h_{max}^*-1\right). \end{equation}
Using scaling laws for  $R_{max}^*$ (4.15) and
 $h_{max}^*$ (5.20), we obtain the following scaling law for the mass of equilibrated silicates:
 \begin{equation} \Delta^{{{lsq}}}=\frac{\rho_s}{\rho_m}\left(\frac{1}{f_m}c_{10}\left(\frac{\bar{\rho}}{\rho_s}\right)^{c_{11}}Fr^{c_{12}}-1\right), \end{equation}
where  $c_{10}=0.07\pm 0.03$,
 $c_{11}=2.8\pm 0.2$ and
 $c_{12}=0.67\pm 0.06$. In this scaling, the density ratio is defined with
 $\bar {\rho }/\rho _s$, where
 $\bar {\rho }=\rho _mf_m+\rho _s(1-f_m)$ is the mean density ratio of the impactor, because this scaling derives from the crater size and the maximum mixing layer thickness scaling laws ((4.15) and (5.20), respectively), which indeed use the mean density of the impactor. We validate this scaling law against experimental data in figure 17(a), using
 $f_m=1$ since the drop is a one-phase fluid. The predicted values of the dimensionless mass of equilibrated silicates
 $\Delta ^{lsq}$ are indeed close to the experimental values
 $\Delta ^{{exp}}$. Relatively large error bars of
 $\Delta ^{lsq}$ mainly result from the uncertainty on the prefactor coefficient of
 $h_{max}^{*^{lsq}}$ (5.20). This means that the following geophysical applications have to be considered carefully given the uncertainties on the scaling law coefficients.
(a) Experimental mass of equilibrated silicates  $\Delta ^{exp}$, as a function of the mass of equilibrated silicates scaling
 $\Delta ^{lsq}$ (6.2), using
 $f_m=1$. Colours scale as the modified Froude number
 $Fr^*$. (b) Mass of equilibrated silicates scaling
 $\Delta ^{lsq}$ as a function of the target-to-impactor radius
 $R_t/R_i$ (6.3), for several impact velocities
 $U_i$, and using
 $f_m=0.16$ and
 $\rho _m/\rho _s=2$. Symbols and lines: triangle, impactor of 10 km in radius onto a Earth-sized target; circle, impactor of 100 km in radius onto a Earth-sized target; square, canonical Moon-forming impact with a Mars-sized impactor (Canup Reference Canup2004); diamond, fast-spinning Earth Moon-forming impact with a fast (
 $U_i=2U_e$) and small (
 $R_i/R_t=0.3$) impactor (Cuk & Stewart Reference Cuk and Stewart2012); dashed lines correspond to an extrapolated range of Froude number, i.e.
 $Fr<200$, which is outside of the experimental Froude number range.

In the context of planetary impacts, the Froude number is given by
 \begin{equation} Fr=2\frac{R_t}{R_i}\frac{U_i^2}{U_e^2}, \end{equation}
where  $U_e=\sqrt {2gR_t}$ is the escape velocity and
 $R_t$ is the radius of the target planet. The impact velocity of colliding bodies during accretion is typically one to three times the escape velocity (Agnor et al. Reference Agnor, Canup and Levison1999; Agnor & Asphaug Reference Agnor and Asphaug2004), which means that the Froude number depends mainly on the target-to-impactor radius.
Using (6.2) and (6.3), we calculate the estimated mass of silicates equilibrated with the impacting core during crater opening  $\Delta ^{lsq}$ as a function of the target-to-impactor radius
 $R_t/R_i$ (figure 17b). We use
 $f_m=0.16$ and
 $\rho _m/\rho _s=2$ to match the internal structure of a differentiated impactor (Canup Reference Canup2004). Since the Froude number increases with the target-to-impactor radius, it means that smaller colliding bodies will produce more equilibration, relative to their size, than giant impactors. For example, impactors with a 10 and 100 km radius (figure 17b, triangle and circle, respectively) will then equilibrate with 35.5 and 7.2 times its own mass, respectively.
Several giant impact scenarios have been proposed to explain the formation of the Moon (e.g. Canup Reference Canup2004; Cuk & Stewart Reference Cuk and Stewart2012). We expect the canonical impact scenario with a Mars-sized impactor (Canup Reference Canup2004) to equilibrate with 0.2 times its own mass during this crater opening stage (figure 17b, square). In contrast, we predict that the fast-spinning and smaller impactor proposed by Cuk & Stewart (Reference Cuk and Stewart2012) equilibrates with 1.8 times its own mass (figure 17b, diamond). These giant impacts scenarios involve a small target-to-impactor radius, corresponding to an extrapolated range of Froude number, i.e.  $Fr<200$ (figure 17b, dashed lines), which is outside of the experimental Froude number range used to constrain the scaling. In addition, this small target-to-impactor radius is very sensitive to the uncertainty on the scaling law coefficients. The mass of equilibrated silicates extrapolated for large impactor thus has to be considered carefully.
Recent experiments estimate the mass of equilibrated silicates during the impact, considering both the crater formation, its collapse into an upward jet, and the collapse of the jet (Landeau et al. Reference Landeau, Deguen, Phillips, Neufeld, Lherm and Dalziel2021). The 10 km impactor, the 100 km radius impactor, the canonical Moon-forming impactor and the fast-spinning Earth impactor, respectively, equilibrate with 1155, 74, 1.5 and 12 times the impactor mass. This means that the fraction of silicates equilibrated during the opening stage of the crater, in comparison with the whole cratering process including the jet formation and collapse, are 3 %, 10 %, 13 % and 15 %, respectively. This is in agreement with an impact-induced equilibration mostly dominated by the collapse of the jet (Landeau et al. Reference Landeau, Deguen, Phillips, Neufeld, Lherm and Dalziel2021).
Experiments including the formation and collapse of the jet (Landeau et al. Reference Landeau, Deguen, Phillips, Neufeld, Lherm and Dalziel2021) have been done with relatively small density contrasts ( $\rho _1/\rho _2 < 1.1$), and the effect of the RT instability was not as important as in the present experiments. At a given Froude number, e.g.
 $Fr=300$, the fluid of the impactor equilibrates with 4.8 and 13.3 times its own mass of ambient fluid, if
 $\rho _1/\rho _2 = 1.1$ and
 $\rho _1/\rho _2 = 1.8$, respectively (6.2). This means that the mass of ambient fluid likely to equilibrate with the impactor is 2.8 times larger in our experiments close to the metal–silicate density ratio than in the experiments of Landeau et al. (Reference Landeau, Deguen, Phillips, Neufeld, Lherm and Dalziel2021). We thus implicitly assume that equilibration produced by the RT instability and the jet are independent, whereas the equilibration produced by the jet is actually promoted by the RT instability and the dispersion of the impactor during crater opening. In other words, we assume that equilibration produced by the RT instability and the jet is combined in an additive way, whereas it is likely to be a multiplicative process. This means that we probably underestimate the influence of the jet on the overall equilibration for the large density ratios.
7. Conclusion
In this paper, we use a backlighting method and LIF to visualise the crater boundary and the mixing layer produced around the cavity after the impact of a drop on a deep liquid pool. We show that crater deceleration after impact is responsible for a density-driven perturbation at the drop–pool interface. We interpret these perturbations as a spherical RT instability. We derive an energy conservation model for the crater radius evolution (4.8) and compare it with backlight experiments. In particular, we obtain scaling laws for the maximum crater radius ((4.14) and (4.19)) and the crater opening time ((4.17) and (4.22)). We also derive a mixing layer evolution model ((5.3) and (5.6)) involving two stages. The mixing layer dynamics is first controlled by the geometrical evolution of the crater, then by the balance between residual geometrical effects and entrainment produced by the RT instability. We obtain scaling laws for the transition time scale between stages (5.19) and the maximum mixing layer thickness (5.20). From our results, we derive scaling laws for equilibration between metal and silicates during a planetary impact onto a magma ocean.
In order to validate the extrapolation of our experimental scaling laws to giant impacts, experiments at lower Froude number involving large volume impactors (e.g. Landeau et al. Reference Landeau, Deguen, Phillips, Neufeld, Lherm and Dalziel2021) are required. This would allow us to investigate the possible effect of the Reynolds number on the mixing layer. Furthermore, several physical aspects neglected in our experiments have to be investigated experimentally or numerically, in order to examine their effect on the cratering and equilibration dynamics. Immiscibility effects may change the equilibration dynamics, in particular with the fragmentation of the metal phase. Furthermore, the viscosity and diffusivity contrasts may influence thermal and chemical transfers between phases, as well as the RT instability wavelength. Compressibility effects are significant during the opening stage of the crater, with a Mach number larger than unity (Kendall & Melosh Reference Kendall and Melosh2016). They include the propagation of an impact shock wave and melting processes. Experiments neglect these effects with a Mach number much smaller than unity. Compressibility may influence the crater evolution and equilibration dynamics following the impact, in particular the evolution of the mixing layer during crater opening. Nonetheless, the flow velocity becomes very rapidly subsonic because the kinetic energy of the impactor is quickly distributed over an increasingly large volume, and because this kinetic energy is converted into gravitational potential energy. Oblique impact effects are also expected since the probability of a vertical impact is less than the likelihood of an oblique impact, with a maximum probability for a  $45^\circ$ angle (Shoemaker Reference Shoemaker1961). The asymmetry caused by an oblique impact modifies the dynamics of the mixing layer with the growth of a shear instability around the cavity. The crater then collapses, producing an oblique jet with an angle similar to the impact angle, but in the opposite direction. These features modifying the dynamics of the mixing layer during crater opening and the properties of the jet following the collapse of the crater crucially affect the overall equilibration of the metal phase. Differentiated impactors effects are also expected since most of the Earth mass was accreted from differentiated bodies (Kleine et al. Reference Kleine, Münker, Mezger and Palme2002; Scherstén et al. Reference Scherstén, Elliott, Hawkesworth, Russell and Masarik2006). Experiments currently fail to reproduce an impactor with a differentiated fluid core. The existence of a mantle around the impactor's core may influence the mixing layer dynamics by changing the distribution of the metal phase around the crater and the dynamics of the RT instability during crater opening. Depending on whether the impactor core directly descends in the magma ocean or is entrained into the upward jet, the equilibration of the metal phase may be modified. The role of impactor differentiation may be investigated numerically, or experimentally using compound drops (e.g. Blanken et al. Reference Blanken, Saleem, Thoraval and Antonini2021). However, since the compound drop experiments involve immiscible water–oil drops, it will be challenging to study the mixing properties following the impact. Finally, pressure and temperature effects are expected during the impact, in particular regarding large energetic impacts such as the Moon-forming giant impact. These effects neglected in experiments may result in an increased miscibility of metal and silicate phases (Morard & Katsura Reference Morard and Katsura2010), with potential consequences on the fragmentation of the metal phase. This may affect chemical equilibration and increase the iron content in the magma ocean. Temperature contrasts may also slightly influence the buoyancy of the metal phase, which may affect the impact dynamics in a minor way.
Supplementary movies
Supplementary movies are available at https://doi.org/10.1017/jfm.2022.111.
Acknowledgements
We thank M. Moulin for the help with the design and construction of the experimental apparatus and J. Vatteville for the help with the imaging equipment. We thank three anonymous reviewers for their valuable comments which significantly improved the manuscript.
Funding
This work was supported by the European Research Council (ERC) under the European Unions Horizon 2020 research and innovation programme (grant number 716429); ISTerre is part of Labex OSUG@2020 (ANR10 LABX56). Partial funding for this research was provided by the Center for Matter at Atomic Pressure (CMAP), a National Science Foundation (NSF) Physics Frontier Center, under award PHY-2020249. Any opinions, findings, conclusions or recommendations expressed in this material are those of the author(s) and do not necessarily reflect those of the National Science Foundation.
Declaration of interests
The authors report no conflict of interest.
Author contributions
V.L., R.D. and T.A. derived the model and V.L. conducted the experiments. All authors contributed to analysing data and reaching conclusions. V.L. wrote the paper, with contributions from all coauthors.
Appendix A. Early-time wavelength
We convert the experimental instability wavelength into an equivalent spherical harmonic degree, and we compare with an experimental scaling law. From the number of plumes  $n$, counted on the hemispherical section of the density interface at
 $t^*=10$, we estimate the instability wavelength as
 $\lambda ={\rm \pi} R/n$. We then obtain the corresponding spherical harmonics degree of maximum instability
 $l_{max}$ using the Jeans relation (Jeans Reference Jeans1923):
 \begin{equation} \sqrt{l_{max}(l_{max}+1)}=\frac{2 {\rm \pi}R}{\lambda}. \end{equation}
In a thin layer configuration with no surface tension, the preferred instability wavelength is the minimum of the layer thickness and of a length scale obtained by balancing buoyancy, inertia and viscous forces. In the following, we assume that the instability wavelength depends on the buoyancy–inertia–viscosity balance. On the one hand, the balance between buoyancy and inertia is valid at small harmonic degrees  $l$, with an instability growth rate scaling as
 $l^{1/2}$ (Rayleigh Reference Rayleigh1899; Taylor Reference Taylor1950). On the other hand, the balance between buoyancy and viscosity is valid at large harmonic degrees
 $l$, with an instability growth rate scaling as
 $1/l$ (Chandrasekhar Reference Chandrasekhar1961). The instability growth rate thus reaches a maximum when inertia, buoyancy and viscous forces are of the same order of magnitude. The corresponding instability wavelength is
 $\lambda \sim \{\nu _2^2/[(\Delta \rho _0/\rho _2)\ddot {R}]\}^{1/3}$, which after non-dimensionalisation gives
 \begin{equation} \lambda^* \sim \left(\frac{\Delta\rho_0}{\rho_2}\ddot{R}^*\right)^{{-}1/3} Re^{{-}2/3}. \end{equation}
Assuming that  $\ddot {R}^*$ and
 ${R^*}$ scale, respectively, as
 $R_{max|Bo \to \infty }^*/t^{*^2}_{max|Bo \to \infty }$ and
 $R_{max|Bo \to \infty }^*$ (see (4.14) and (4.17)), and using the Jeans relation (A1), (A2) gives a scaling for the degree of maximum instability:
 \begin{equation} l_{max}^{lsq}=c_{13}\phi^{1/4} \xi^{{-}1/3} Fr^{{-}1/12} \left(\frac{\rho_1}{\rho_2}\right)^{1/4} \left(\frac{\Delta\rho_0}{\rho_2}\right)^{1/3} Re^{2/3}, \end{equation}
where  $c_{13}=0.177\pm 0.005$ is a least squares best-fit prefactor obtained from experimental data (figure 18).
Experimental harmonic degree of maximum instability  $l_{max}^{exp}$, as a function of the harmonic degree of maximum instability scaling
 $l_{max}^{lsq}$ (A3). Colours scale as the Reynolds number
 $Re$.

Figure 18 shows the harmonic degrees of maximum instability measured in all experiments, as a function of scaling (A3) for  $l_{max}$. Experimental data agree with this scaling, except for Froude numbers smaller than 100. This corresponds to Reynolds numbers smaller than 4000. In this case, the crater differs from the hemispherical shape and from the purely radial acceleration assumed in the scaling. Furthermore, the fact that experimental data scale with the buoyancy–inertia–viscosity scaling (A3) indicates that the preferred wavelength is indeed set by the buoyancy–inertia–viscosity balance rather than by the layer thickness.
Appendix B. Energy partitioning and kinetic energy correction
Figure 19(a) shows the correction parameter  $\phi$ as a function of the Froude number. Since several energy sinks such as crown energy and viscous dissipation are neglected in the model, we expect
 $\phi$ to be smaller than unity. In our experiments, we find
 $\phi =0.38\pm 0.04$, in agreement with previous works where experimental data are fitted using a partitioning coefficient in the range
 $0.2$–
 $0.6$, depending on the Froude number (Engel Reference Engel1966; Olevson Reference Olevson1969; Leng Reference Leng2001).
Energy partitioning parameter  $\phi$ (a), and crater kinetic energy correction parameter
 $\xi$ (b), as a function of the Froude number
 $Fr$. The solid line gives the best-fit power-law scaling (B1). Colours scale as the density ratio
 $\rho _1/\rho _2$. Circles and crosses correspond, respectively, to large and small drop size series.

In our experiments,  $Fr$ and
 $We$ are highly correlated since
 $Bo$ does not vary by a large amount. The coefficient
 $\phi$ is found to be a decreasing function of both
 $Fr$ and
 $We$, which scales in particular as
 \begin{equation} \phi=Fr^{{-}0.156\pm0.001}, \end{equation}
and is relatively independent of the density ratio and the drop size. This implies that as the impactor inertia increases, the relative importance of the neglected energy sink terms increases. This may be explained by a change in the energy balance between the crater energy and the crown energy (Olevson Reference Olevson1969). As the impactor inertia increases, the relative importance of the surface energy of the crater and the crown decreases, while the potential energy of the crater and the kinetic energy of the crown increases, resulting in a global increase of the crown energy to the expense of the crater. According to Olevson (Reference Olevson1969), the energy within the crown increases with  $Fr$ faster than the energy within the crater, which would imply that
 $\phi$ is a decreasing function of
 $Fr$. The drop deformation upon impact may also increase with impactor inertia, and with it the energy required for this deformation, decreasing to this extent the energy delivered to the pool.
Figure 19(b) shows the kinetic energy correction parameter  $\xi$, as a function of the Froude number. It accounts for the difference between the deliberately simplified velocity potential used in the model (4.3) and the true flow. Since the crater boundary is not hemispherical and the crown is necessarily generated by a tangential velocity field, the true velocity potential cannot be purely radial (Engel Reference Engel1967; Bisighini et al. Reference Bisighini, Cossali, Tropea and Roisman2010). Parameter
 $\xi$ is very likely a function of time, but we assume it to be constant. In our experiments, the kinetic energy correction parameter is smaller than unity with
 $\xi =0.34\pm 0.03$. This means that the velocity model overestimates the crater kinetic energy in the energy balance. We do not observe any resolvable trend between
 $\xi$,
 $Fr$ and
 $\rho _1/\rho _2$.
Appendix C. Buoyancy prefactor and drag coefficient
Figure 20 shows the fitted buoyancy prefactor  $\beta$ and drag coefficient
 $C$ for each experiment.
Buoyancy prefactor  $\beta$ (a), and drag coefficient
 $C$ (b), as a function of the Froude number
 $Fr$. Colours scale as the density ratio
 $\rho _1/\rho _2$.

The mean value of the buoyancy prefactor is  $\beta =0.32\pm 0.17$. This is smaller than the value
 $\beta =1$ found by Dimonte (Reference Dimonte2000) for plane layer experiments. This difference may come from the hemispherical shape or the finite thickness of the dense layer in our experiments. Given error bars, we find that
 $\beta$ shows no resolvable trend with the density ratio or the Froude number. However, variations may exist and require further investigations.
The mean value of the drag coefficient is  $C=1.9\pm 1.1$. This value agrees with the value
 $C=2.5\pm 0.6$ obtained for constant, variable and impulsive accelerations of a plane mixing layer (Dimonte Reference Dimonte2000). We find that
 $C$ decreases when the density ratio increases (figure 20b). The mean value of the drag coefficient at
 $\rho _1/\rho _2=1.2$ and
 $\rho _1/\rho _2=1.8$ is, respectively,
 $C=3.1\pm 1.1$ and
 $C=1.1\pm 0.4$. As for the buoyancy prefactor,
 $C$ shows no resolvable trend with the Froude number.
In order to further compare the values of  $\beta$ and
 $C$ with the results of (Dimonte Reference Dimonte2000), we now consider two simplified end-member acceleration histories: a constant acceleration and an impulsive acceleration.
In the case of a plane layer under constant acceleration  $\ddot {R}$, the solution to the buoyancy–drag equation (5.4) is
 $h=\alpha (\Delta \rho /\bar {\rho })\ddot {R}t^2$ (e.g. Dimonte Reference Dimonte2000), where
 $\alpha$ is an empirical prefactor and
 $\bar {\rho }=(\rho _1+\rho _2)/2$. The parameter
 $\alpha$ can be expressed as a function of the parameters
 $\beta$ and
 $C$ by looking for a solution of (5.4). Taking
 $u'=\dot {h}$, as appropriate for a plane layer, solving gives
 \begin{equation} \alpha=\frac{\beta}{2+8C\dfrac{\rho_2}{\rho_1+\rho_2}}. \end{equation}
Figure 21(a) shows  $\alpha$, calculated for each experiment, and compares the results to the homogeneous buoyancy–drag model of Dimonte (Reference Dimonte2000) for
 $C=1$,
 $C=2$ and
 $C=3$. The mean value
 $\alpha =0.04\pm 0.01$ in our experiments is smaller than the values
 $\alpha =0.05\text{--} 0.07$ that are obtained at the same density ratio with immiscible fluids, and under constant acceleration (Dimonte & Schneider Reference Dimonte and Schneider2000). The observed values of
 $\alpha$ are also smaller than the predictions from the homogeneous model of Dimonte (Reference Dimonte2000), in particular at large density ratios. For example, at
 $\rho _1/\rho _2=1.8$ the drag coefficient found in our experiments is approximately
 $C=1$ (figure 20b), which leads to an overestimate of
 $\alpha$ by a factor 2 in figure 21(a). This may be a consequence of the variable acceleration, but also of the spherical interface, miscibility and the finite thickness of the dense layer.
Constant acceleration prefactor  $\alpha$ (a) and impulsive acceleration exponent
 $\theta$ (b) as a function of the density ratio
 $\rho _1/\rho _2$. Colours scale as the experimental drag coefficient
 $C$. Solid lines, dashed lines and dotted lines correspond to the homogeneous buoyancy–drag model of Dimonte (Reference Dimonte2000) for
 $C=1$,
 $C=2$ and
 $C=3$, respectively.

In the case of an impulsive acceleration, the buoyancy term in (5.4) is negligible since  $\ddot {R}=0$. Neglecting geometrical effects, i.e.
 $u'=\dot {h}$, and assuming that
 $\bar {\rho }=(\rho _1+\rho _2)/2$, the solution is then given by
 $h=h_0\tau ^\theta$, where
 $\tau =u'_0t/\theta h_0+1$, and
 $h_0$ and
 $u'_0$ are initial values (e.g. Dimonte Reference Dimonte2000). The exponent is then
 \begin{equation} \theta=\frac{1}{1+2C\dfrac{\rho_2}{\rho_1+\rho_2}}. \end{equation}
Figure 21(b) shows  $\theta$, calculated for each experiment, and compares the results with the buoyancy–drag model of Dimonte (Reference Dimonte2000). The mean value
 $\theta =0.4\pm 0.1$ is close to the values
 $\theta =0.2\text{--} 0.3$ that are obtained at the same density ratio between immiscible fluids, and under an impulsive acceleration (Dimonte & Schneider Reference Dimonte and Schneider2000). The exponent
 $\theta$ increases with the density ratio, consistently with the homogeneous model of Dimonte (Reference Dimonte2000) estimated at consistent values of the drag coefficient
 $C$ (figure 20b). Since the acceleration of the crater evolves as
 $t^{-8/5}$, the acceleration is relatively close to be impulsive, explaining the good agreement between our experiments and the impulsive acceleration model.