Implications
More than $340 million is conceded annually by Western United States producers due to production losses associated with livestock consuming toxic plants (Nielsen and James, Reference Nielsen and James1992). The economic implications of acute NO3− toxicity have been recognized; however, the economic impact of subacute NO3− toxicity is difficult to establish, as the signs are non-specific and often misdiagnosed. Subacute NO3− toxicity may partially explain the poor performance frequently observed in livestock in drought-stricken regions, including decreased feed intake and nutrient utilization, weight loss, and compromised reproduction and immune function.
Introduction
Death rates from the consumption of high NO3− forages (45 to 547 mg NO3−/kg body weight (BW) in cattle and 224 to 547 mg NO3−/kg BW in sheep) range from 7% to 44% in cattle and up to 42% in sheep (Harris and Rhodes, Reference Harris and Rhodes1969). During severe drought conditions, plants do not absorb NO3−; however, eventual moisture leads to rapid absorption of NO3− by plants. Nitrate itself is not toxic to livestock, but ingested NO3− is converted to NO2− by rumen bacteria and further reduced to ammonia. Ingestion of high levels of NO3− causes accumulation of toxic levels of NO2− in the blood, resulting from a conversion of the ferrous ion of hemoglobin to the ferric form, which reduces the ability of red blood cells to carry the oxygen. Signs of NO3− toxicity may appear when >20% of hemoglobin is converted to methemoglobin (Yaremcio, Reference Yaremcio1991). The transfer of rumen NO2− into the bloodstream is influenced by NO3− intake, rate of feed digestion and subsequent NO3− release, rate of NO2− reduction to ammonia and absorption of NO2− from the rumen. Subacute NO3− toxicity can result in lethargy, head pressing, and impaired animal production as evidenced by depressed appetite, reduced or no BW gain, lowered milk production, reproductive inefficiency and increased susceptibility to infection (Yaremcio, Reference Yaremcio1991). The long- and short-term effects of subacute NO3− toxicity have received limited research investigation, resulting in frequent misdiagnosis in livestock operations and incorrect or lack of appropriate treatment. Signs of toxicity exhibited by sheep and cattle are similar in response to high levels of NO3− in forage. However, sheep have a higher tolerance to NO3− due to their ability to increase the concentration of red cells in the blood (Diven et al., Reference Diven, Reed and Pistor1964). The observed variation in susceptibility to toxicity can be partially attributed to the rate and duration of exposure as well as individual tolerance and metabolism capacity. The objective of this study was to confirm and quantify individual variation in ewes exposed to subacute levels of dietary NO3− and determines if individual animals can be identified as highly tolerant or lowly tolerant based on production traits, plasma analytes, and(or) signs of subacute NO3− toxicity.
Material and methods
Animal procedures
All animal procedures used were approved by the University of Wyoming Institutional Animal Care and Use Committee. Due to time and labor limitations, purebred Suffolk ewes (n = 60; average initial BW = 85.7 ± 46.4 kg) were randomly allotted to one of two project start days (contemporary groups). The variation in BW was attributed to variations in both body condition score (3 to 7) and age of ewes (1 to 8 years). Within each contemporary group, ewes were randomly assigned to a control (n = 5) or elevated NO3− (n = 25) treatment group with age randomly distributed between control (average of 2.4 years) and NO3− treated (average of 3.1 years) ewes. The trial period occurred during the summer months of June and July, and animals within the contemporary group were housed in a covered outdoor facility and fed the basal diet and supplement mixture during the trial period. The basal diet consisted of baled bromegrass hay (8.1% CP, 61% NDF, 91% dry matter (DM) basis) fed at 2.5% (2.150 g/day, 60% total digestible nutrient (TDN)) of initial BW. The supplement mixture (11.5% total dietary CP) consisted of (92% DM) 53.9% soybean meal, 28.7% beet pulp, 10.0% molasses, and 7.4% vitamins/minerals and was fed 3× per day (125 g/feeding, as fed basis; 75.6% TDN) for 8 days. The maximum TDN intake per ewe was 1.460 g/d; an 85 kg non-lactating mature ewe requires 720 g/day for maintenance (National Research Council, 2007). Respective treatments included either control supplement (supplement mixture with tap water) or NO3− treated supplement (supplement mixture with 100 mg/kg BW of NO3− provided as a 1.5 M NO3− solution, using potassium nitrate (KNO3) as the NO3− source) administered 3 × daily. All ewes (n = 60) were adjusted to the control supplement for 3 days prior to the initiation of treatment (day 3 to day 1). Starting on day 0, ewes were then administered their respective supplement, control (n = 10) or NO3− treated (n = 50), for the 8 day trial period (day 0 to day 7). Liver biopsies were performed on all ewes using a procedure modified from Ferreira et al. (Reference Ferreira, van der Merwe and Slippers1996) on day 0 (prior to treatment administration) and again at the end of the study on day 7 to obtain tissues for future gene expression analyses. An 11% death rate typically occurs in sheep when performing liver biopsies as opposed to <0.5% in cattle (Anderson et al., Reference Anderson, Taylor, Diven, Hubbert and Hale1962). A total of 120 biopsies were performed in this study, with an 8.3% death loss (n = 5) due to surgery complications. With the loss of 2 control ewes and 3 NO3− treated ewes, a total of 8 control ewes and 47 NO3− treated ewes were available for analyses. After ewe losses, contemporary group 1 was composed of 5 controls and 25 NO3− treated ewes and contemporary group 2 was composed of 3 controls and 22 NO2− treated ewes.
Animals assigned to the NO3− supplement treatment were provided a KNO3 treated supplement at a rate of 300 mg/kg BW of NO3− (Sigma Aldrich, St Louis, MO, USA) daily (100 mg/kg BW of NO3− 3 × daily) in a 1.5 M solution consisting of NO3− and distilled H2O that was evenly distributed within the 125 g supplement mixture prior to feeding. To avoid acute NO3− toxicity, this supplement was delivered over three daily feeding periods at 0700, 1200 and 1700 h. Based on preliminary studies in our laboratory, a molar solution of NO3− rather than supplement top-dressed with NO3− was effective in eliminating sorting behavior. Furthermore, those preliminary studies indicated that administration of 300 mg/kg BW of NO3− resulted in the greatest variation in NO3− treated supplement intake among ewes. Control supplement ewes were administered 125 g daily of supplement mixed with tap water only immediately prior to feeding. The control supplement was similarly administered over three daily feeding periods. Tap water used for mixing control supplement was also used as the drinking water source for this study. Concentration of NO3− was not tested in the tap water, but assumed to be minimal due to lack of subacute NO3− toxicity signs in control animals and other stock animals with access to the tap water. As a precautionary measure against acute NO3− toxicity, a mixture of 1% to 4% aqueous solution of methylene blue in saline was prepared for intravenous injection on a 5 to 20 mg/kg live BW basis upon onset of clinical signs of NO3− toxicity. Blood was drawn for analyses on day 0, 12 h after initial NO3− exposure, every 24 h for the remaining 8 days of the trial, and 3 days after the cessation of treatment. Blood was drawn via the jugular vein into ethylenediaminetetraacetic acid− lined tubes (Tyco Healthcare Group LP, Mansfield, MA, USA) to prevent clotting. All samples were immediately mixed and put on ice for 1 h. Samples were then centrifuged for 20 min at 1520 × g at 2°C after which plasma was obtained and stored at −20°C.
Supplement weigh back
Once respective supplements (control or NO3− treated) were administered to ewes, a maximum period of 30 min was allotted for feeding so that accurate measures of supplement intake could be obtained. In a preliminary trial, it was determined that a feeding period of 30 min was sufficient for maximum supplement intake, or ad libitum supplement intake. Ewes tended to waste supplement when feeding periods exceeded 30 min, making it difficult to obtain accurate supplement intake measures. Any remaining supplement was placed into individual bags, labeled with date and ewe tag number, and stored at −20°C until weighed.
Selection
Nitrate treated ewes (n = 47) were ranked on average NO3− treated supplement intake during the experimental feeding period. During the adjustment period (day 3 to day1) all ewes consumed 100% of the control supplement offered. The 20% (n = 9) of ewes consuming the greatest amount of NO3− treated supplement during the 8 day trial period were considered for selection as highly tolerant to NO3−. The 20% (n = 9) consuming the least amount of NO3− treated supplement were considered for selection as lowly tolerant to NO3−. Lowly tolerant ewes selected for further analyses consumed <25% of the NO3− treated supplement. Highly tolerant ewes selected for further analyses consumed >70% of the NO3− treated supplement. From the initial 20% considered, six ewes were selected as lowly tolerant and six ewes as highly tolerant to NO3− based on behaviors and toxicity signs, or lack thereof, such as lethargy, decreased supplement intake, head pressing and upper respiratory congestion attributed to suppressed immune function. For each toxicity sign, ewes were assigned a score of 1 if the sign was expressed and a score of 0 if not. Lethargic ewes would hold their heads and ears low and position themselves away from the surrounding ewes. Ewes that demonstrated head pressing would hold their heads down and press them against the pen for extended periods of time. Though ewes that demonstrated upper respiratory congestion were not examined by a licensed veterinarian, ewes that consistently coughed and had noticeable nasal mucous discharge where classified as exhibiting upper respiratory congestion. Lowly tolerant ewes demonstrated ⩾2 of those signs whereas highly tolerant ewes did not demonstrate any signs associated with subacute NO3− toxicity. Of the eight control ewes, six were selected for further analyses based on health status and collection of a liver sample of adequate quality and quantity. Of the two control ewes not selected for further analyses, one had a tumor on the neck prior to treatment and the other exhibited blood clots in the liver sample obtained via biopsy.
Feed analyses
Feed samples were analyzed for DM (Association of Official Analytical Chemists, 1990), nitrogen (LECO Model FP-528 Nitrogen analyzer; LECO Corporation, St Joseph, MI, USA), and NDF contents (ANKOM 200 fiber analyzer; ANKOM Technology, Fairport, NY, USA). Nitrate levels in the bromegrass hay and supplement were analyzed using a Standard Range Lab Nitrate Test Kit (L-NTK; NECi, Lake Linden, MI, USA) and measured on a Nanodrop spectrophotometer (Nanodrop Technologies, Inc., Wilmington, DE, USA). Nitrate measurements in bromegrass hay and supplement were obtained to determine the basal level of NO3− that all animals were consuming regardless of treatment assignment. In this assay, NO3− was measured by the reduction of NO3− to NO2− using a NO3− reductase and an electron donor, NADH (Campbell et al., Reference Campbell, Campbell and Egan2006). Nitrate was evenly mixed with the supplement immediately prior to administration and ewes were unable to sort the NO3− solution from supplement; therefore, NO3− intake of NO3− treated ewes was estimated by NO3− treated supplement consumption.
Plasma analyses
Plasma samples from selected ewes were tested for NO2− levels as described for analysis of the supplement and bromegrass hay with the omission of the NO3− reductase and NADH reagents from the assay. Plasma NO3− levels were not determined as toxicosis is caused by circulating NO2− rather than NO3−. Daily plasma urea nitrogen (PUN) levels were confirmed in control, highly tolerant and lowly tolerant ewes using a QuantiChrom™ Urea Assay Kit (DIUR-500; BioAssay Systems, Hayward, CA, USA) and measured on a Beckman Coulter DU 640 spectrophotometer (Beckman Coulter, Fullerton, CA, USA). The urea assay kit utilizes a chromogenic reagent that forms a colored complex specifically with urea (Jung et al., Reference Jung, Biggs, Erikson and Ledyard1975). Daily plasma glucose levels in control, highly tolerant and lowly tolerant ewes were determined using a rapid multiassay analyzer protocol (reagent GMRD-002A and standard GMRD-011; 8 mmol/l per 144.1 mg/dl) and instrument (Analox Instruments Ltd, London, UK). Samples were analyzed using 10 ml of plasma until duplicate results of ±4.0 mg/dl were reached. Daily plasma cortisol levels in control, highly tolerant and lowly tolerant ewes were analyzed via radioimmunoassay using a TKC05 Cortisol RIA Coat-a-Count kit (Diagnostic Products Corporation, Los Angeles, CA, USA) on a Cobra II autogamma counter (Packard, Downers Grove, IL, USA). All results were compared against internal controls of non-specific bound and standard samples. Retinol levels in control, highly tolerant and lowly tolerant ewes on day 1, 4 and 7 were analyzed on an HPLC (Waters Separation Module 2690) as an indicator of vitamin A in plasma by the Michigan State University’s Diagnostic Center for Population and Animal Health (Lansing, MI, USA). Plasma rather than liver tissue was analyzed for retinol levels due to the limited amount of hepatic tissue available.
Statistical analyses
Change in BW was analyzed for effects of treatment (control or NO3− treated; control, highly tolerant or lowly tolerant), contemporary group and their interaction using PROC GLM of SAS (SAS Institute Inc., Cary, NC, USA). The NO3− treated supplement intake and NO3− intake were analyzed for the fixed effect of treatment (control or NO3− treated; control, highly tolerant or lowly tolerant) and random effects of contemporary group, day, and the interaction of treatment × day as repeated measures using PROC MIXED of SAS. Plasma parameters, including NO2−, urea nitrogen, cortisol, glucose, and retinol, were analyzed for the random effect of treatment (control, highly tolerant or lowly tolerant) and random effects of contemporary group, day, and the interaction of treatment × day also as repeated measures using PROC MIXED of SAS. Mean separation of least-squares means was performed using a least-squares difference with a Tukey’s adjustment with s.e.m.±reported. An α level of 0.05 was assumed. Relationships between plasma analytes (when significance was detected) and supplement intake were determined using PROC CORR of SAS.
Results and discussion
Nitrate levels in bromegrass hay and basal supplement (without added NO3−) were within the range considered safe for ruminant livestock (Table 1) at <4 ppm NO3−. Ewe age did not affect supplement intake (P = 0.54) or weight change (P = 0.35). There were no differences in ewe age or BW between control and NO3− treated ewe groups as age and BW were evenly distributed upon assignment of treatment.
%NO3− levels (dry matter basis) and potential effects on ruminants

Ewes fed the NO3− treated supplement consumed less (P < 0.0001) supplement than controls, but change in BW did not differ (P = 0.97; Table 2). The pH of KNO3 was approximately 8, and its addition did not change the overall pH of the supplement; however, a potential effect of the NO3− on supplement taste or on appetite cannot be ruled out as a possible contributor to the decreased supplement intake in NO3− treated ewes. Highly tolerant ewes did not demonstrate a taste aversion to the NO3− treated supplement as the majority of supplement offered (81.8%) was consumed with no subacute NO3− toxicity signs. Lowly tolerant ewes consumed 23.2% of the NO3− treated supplement offered and demonstrated ⩾2 subacute NO3− toxicity signs. Therefore, the decrease in treated supplement intake of NO3− treated ewes, especially in lowly tolerant ewes, coincides with elevated dietary NO3−. Coefficients of variation (CV) indicated that supplement intake was more variable in NO3− treated ewes (CV = 59.3%) than in control ewes (CV = 13.6%). Furthermore, approximately 74% of NO3− treated ewes (n = 35; Figure 1) ingested 10.1 to 30.0 g/day of NO3−, whereas 17% (n = 8) ingested ⩽10.0 g/day of NO3− and 9% (n = 4) ingested >30.0 g/day of NO3−. This variation in intake may translate to other feedstuffs containing subacute levels of NO3− and may assist livestock producers in recognizing elevated NO3− as a potential culprit in populations experiencing variation in intake and performance, especially in regions prone to high NO3− feedstuffs. Nitrate treated ewes ingested 0.89 ± 0.05% of NO3− or 19.07 ± 1.17% NO3− g/day on a DM basis (Table 2). Supplement intake (control and NO3− treated) tended (P = 0.057) to differ between the two contemporary groups, but there was no treatment × contemporary group interaction effect on supplement (P = 0.28) or NO3− intake (P = 0.10). No ewes exhibited signs of acute NO3− toxicity that required a methylene blue injection. Supplement intake differences between the two contemporary groups may potentially be explained by the large CV and(or) small replicate numbers in the treatment groups, especially the control group.
Mean intake and BW change of control and NO3− treated ewes

1Treated ewes received 300 mg/kg of BW of NO3− daily
2Total NO3− intake from supplement in addition to <4 ppm measured in bromegrass hay.
Average daily NO3− intake distribution among all NO3− treated ewes.

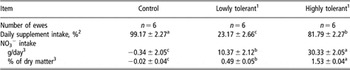
Supplement intake differed (P = 0.0002; Table 3) between control and highly tolerant ewes. Additionally, lowly tolerant ewes consumed less (P < 0.0001) supplement than control and highly tolerant ewes. Control, highly tolerant and lowly tolerant ewes consumed 100% of bromegrass hay offered daily at 2.5% of BW. Nitrate intake differed (P ⩽ 0.008; Table 3) between lowly tolerant and highly tolerant ewes, with lowly tolerant and highly tolerant ewes ingesting 0.49% (10.37 ± 2.12 g/day) and 1.53% (30.33 ± 2.05 g/day) NO3− daily on a DM basis, respectively. Generally, forages containing acutely toxic levels of NO3− on a DM basis range from 1% to 3%, or 10 000 to 30 000 ppm, NO3− (Adams et al., Reference Adams, McCarty and Hutchinson1992). Wright and Davison (Reference Wright and Davison1964) suggested that 0.34% to 0.45% NO3− should be considered toxic, while Case (Reference Case1957) found that forages containing 0.70% NO3− resulted in death. Interestingly, ewes identified as highly tolerant to NO3− in this study were able to tolerate consuming a higher percentage of NO3− with no apparent ill effects compared to lowly tolerant ewes that ingested a significantly reduced percentage of NO3− and yet were noticeably lethargic and had significantly decreased NO3− treated supplement intake. Both highly and lowly tolerant ewes consumed 100% of bromegrass hay offered; therefore, demonstration of health problems were attributed to NO3− toxicosis rather than metabolic needs as the bromegrass hay alone met all nutrient requirements. The difference in percentage NO3− intake between highly tolerant and lowly tolerant ewes in this study, in combination with the reports of Case (Reference Case1957), Wright and Davison (Reference Wright and Davison1964) and Adams et al. (Reference Adams, McCarty and Hutchinson1992), provides further evidence of variation in tolerance to elevated dietary NO3− in ruminant animals.
Mean intake and BW change of selected control, highly tolerant and lowly tolerant ewes

a,b,cMeans with unlike subscripts within row are different (P ⩽ 0.05).
1Highly tolerant and lowly tolerant ewes were offered 300 mg/kg of BW of NO3− daily.
2Percentage of 300 mg/kg of BW of supplement offered daily.
3Total NO3− intake from supplement in addition to <4 ppm measured in bromegrass hay.
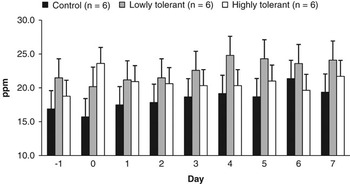
While within day plasma NO2− levels did not differ (P = 0.59) between controls, highly tolerant and lowly tolerant ewes, plasma NO2− was consistently numerically lower in control ewes (19.25 ± 2.33 ppm) and higher in lowly tolerant ewes (23.30 ± 2.53 ppm) during the 8 day treatment period (Figure 2). Lowly tolerant ewes were noticeably lethargic compared to control and highly tolerant ewes and demonstrated signs consistent with NO3− toxicity such as head pressing, listlessness and diarrhea. Thus, behavior displayed by the lowly tolerant ewes may reflect the level of NO3− consumed rather than nutrient or energy deficiency.
Average daily circulating plasma NO2− levels in control, lowly tolerant and highly tolerant ewes did not differ (P = 0.59) from day 1 to 7.

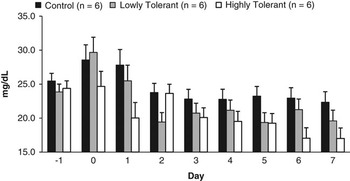
PUN levels were not different between lowly tolerant and control (P = 0.25) or highly tolerant (P = 0.38) ewes (Figure 3); however, PUN levels were lower (P = 0.02) in highly tolerant ewes than control ewes. Circulating plasma NO2− and PUN levels can be indicators of individual NO3− metabolism. PUN levels increase over 50% when glomerular filtration rate is impaired, indicating impaired kidney function (Schnellmann, Reference Schnellmann2008). Interestingly, highly tolerant ewes ingested a significantly higher percentage NO3− than lowly tolerant ewes but had numerically lower PUN and circulating NO2− levels. Additionally, there was a positive and moderate correlation (0.35; P = 0.0005) between PUN levels and percentage NO3− treated supplement intake among selected NO3− ewes, indicating that as NO3− intake increased PUN values also increased. Lowly tolerant ewes displayed a high positive correlation (0.71; P < 0.0001; Figure 4) between PUN levels and treated supplement intake; however, there was no correlation between PUN levels and percentage supplement intake in highly tolerant ewes (0.24; P = 0.10). The regression of PUN values on percentage of NO3− treated supplement intake in highly tolerant and lowly tolerant ewes, respectively, further demonstrates the relationship of PUN levels with NO3− treated supplement intake in lowly tolerant ewes.
Average daily plasma urea nitrogen levels in control, lowly tolerant and highly tolerant ewes from day 1 to 7 only differed (P = 0.02) between control and highly tolerant ewes.

Regression of plasma urea nitrogen levels on daily percentage of NO3− treated supplement intake in lowly tolerant and highly tolerant ewes.

Neither plasma cortisol (P = 0.93; Figure 5) nor glucose levels (P = 0.97; Figure 6) were different among highly tolerant, lowly tolerant and control ewes. Cortisol levels increase when animals are exposed to high levels of NO3− (Yaremcio, Reference Yaremcio1991; Zraly et al., Reference Zraly, Bendova, Svecova, Faldikova, Veznik and Zajicova1997); however, measuring cortisol as an indicator of stress does not identify the nature of the actual stressor. It should be noted that cortisol levels numerically increased (P > 0.10) on day 0 and day 3. During those 2 days, ewes were being weighed, prepared for a liver biopsy, blood sampled, or exposed to extra handling such as shearing of the necks, which may have caused the observed increases in cortisol. Gluconeogenesis is a continual process in ruminants as almost all dietary carbohydrates are fermented to volatile fatty acids in the rumen (Young, Reference Young1976). Therefore, it is difficult to establish how glucocorticoids affect glucose production in ruminant animals. Blood glucose levels in ruminants range from 40 to 60 mg/100 ml and tend to fall after fasting and remain unchanged after feeding (Van Soest, Reference Van Soest1994). Because 100% of the bromegrass hay provided daily was consumed by all ewes, differences in cortisol and glucose levels were not expected between ewe groups.
Average daily cortisol levels in control, lowly tolerant and highly tolerant ewes did not differ (P = 0.93) from day 1 to 7.

Average daily glucose levels in control, lowly tolerant and highly tolerant ewes did not differ (P = 0.97) from day 1 to 7.

Circulating plasma retinol levels on day 1, 4 and 7 did not differ (P = 0.23) between control, highly tolerant and lowly tolerant ewes (Figure 7). Nitrate has been implicated in the reduction of thyroid activity responsible for the conversion of carotene to vitamin A in ruminants. Furthermore, the storage of vitamin A in the liver is reduced by elevated NO2− levels (O’Donovan and Conway, Reference O’Donovan and Conway1967). Circulating retinol levels may not have been affected in this study due to the subacute nature of the NO3− exposure. Bruning-Fann and Kaneene (Reference Bruning-Fann and Kaneene1993) observed a reduction in vitamin A levels upon an acute dose of NO3− in steers fed a high concentrate diet and concluded that a chronic NO3− exposure or an acute NO3− dose is needed to produce noticeable effect on vitamin A or retinol metabolism in cattle and sheep. However, O’Donovan and Conway (Reference O’Donovan and Conway1967) found that ewes grazing a pasture with NO3− content on a DM basis ranging from 0.05% to 1.72% for 5 months did not have significantly reduced vitamin A levels. Furthermore, it can take up to 1 to 2 years for the liver to be fully depleted of vitamin A, which may explain why little change was observed in circulating plasma concentrations of vitamin A in the short term (NRC, 2007). Finally, differences in basal diet in terms of presence or absence of green forages, or providing β-carotene might contribute to differences between studies.
Average circulating retinol levels in control, lowly tolerant and highly tolerant ewes on day 1, 4 and 7 did not differ (P = 0.23).

Overall, there were no differences (P ⩾ 0.25) in plasma analytes between highly tolerant, lowly tolerant and control ewes in this study except for PUN levels between control and highly tolerant ewes (P = 0.02). This may indicate that ewes did not adapt to the higher dietary NO3−, or perhaps were not provided an adequate time to do so. Alternatively, NO3− treated ewes may have been reducing the NO3− at different rates, resulting in plasma analytes that were similar among the selected groups (highly tolerant and lowly tolerant). Therefore, we hypothesize that individual variation in metabolizing NO3− may be genetically based which will be investigated in future gene expression analyses.
Conclusions
This study confirms and quantifies the variation observed among ruminant animals exposed to a short term, subacute NO3− exposure. Variation in NO3− treated supplement intake, NO3− intake and expression of signs associated with NO3− toxicity, combined with no differences in BW change or blood analytes with limited differences in PUN values, indicate that animals do not reach a biological threshold when administered subacute dietary NO3−. These results imply that animals cannot be identified as highly tolerant or lowly tolerant to elevated dietary NO3− based on blood analytes alone. The variation in response to subacute levels of dietary NO3− may help producers recognize NO3− as a potential cause for reduced intake and performance in a herd or flock that is exhibiting disparities in production and behavior traits among individuals. Identification of lowly tolerant ewes according to production and behavior traits may allow producers to employ alternative management strategies for those individuals, eliminate them from their breeding stock, or cull them from the herd or flock. Furthermore, future trait selection based on genomic marker research for tolerance to elevated dietary NO3− in forages would enhance the role for sheep in biological weed and insect pest control and improve profitability in sheep production systems.
Acknowledgements
This research was supported in part by a University of Wyoming Agricultural Experiment Station Competitive Grant. The authors would like to thank Brent Larson and Ed Van Kirk for their assistance with animal care and sample collection.