Introduction
The demand for radiotherapy is ever increasing, with half of all cancer patients in the UK requiring radiotherapy as part of their treatment. 1 To meet this demand, NHS England (NHSE) has recently established 11 operational delivery networks (ODNs) to facilitate a ‘Vision for Radiotherapy 2014–24’ 2 , with a service specification requiring each centre to deliver 9000 attendances per year per linac. 3 Due to a recent merge with a neighbouring centre to create a Satellite Centre, the local service was in a unique position to compare nuances in the clinical workflow between the Main Site and Satellite Site. The RTDS reported that the Satellite Site delivered 7550 fractions per year per linac in 2019 compared to 5940 delivered at the Main Site over a similar working day profile, indicating a potential difference in efficiency levels.
A large efficiency study was conducted by Public Health England where site visits were performed at 54 UK radiotherapy centres over a 10-year period and formed an impetus for this project. 4 Central departmental efficiency issues were highlighted in 43 out of 44 of the published site reports. Staff could identify inefficiencies throughout the departmental workflow but did not have the resource to review their overall approach to service delivery and create an action plan. Other published radiotherapy efficiency studies focus on scheduling appropriate appointment slots and do not look in detail at the workflow within a fraction. The time taken to treat a patient directly affects the daily number of fractions delivered by a linac, therefore influencing waiting times. This project sought to plan local improvements to treatment delivery efficiency and addresses the gap in published literature around this.
Methods
The main method used for this study was a timings audit. A literature review was also undertaken to gain further perspective from other sites on which factors impact treatment delivery efficiency. Approval for this project was gained from the NHS Trust’s Research and Development Department and Sheffield Hallam University.
Timings audit
The sample consisted of 3 Elekta Versa HD linacs (2 at the Main Site and 1 at the Satellite Site). The study focused on the delivery time of radiotherapy to the breast and prostate. The Satellite Site delivered treatment solely to Royal College of Radiologists Category 2 patients, so including these patient groups ensured a fair comparison between sites. Imaging and treatment delivery techniques were identical for prostate treatments consisting of daily Cone Beam Computed Tomography (CBCT) and a single Volumetric Modulated Arc Therapy arc. Breast treatments consisted of tangential intensity-modulated radiotherapy (IMRT) fields and CBCT on the first 3 fractions. Breast fields were either referred for free breathing (FB) or deep inspiration breath-hold (DIBH). The Satellite Site utilised device assistance to achieve DIBH, and the main site used a voluntary technique.
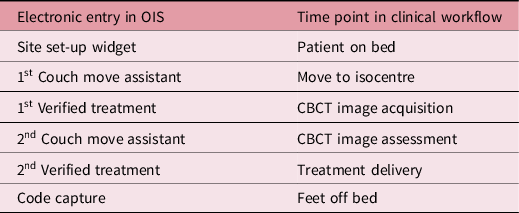
Data were collected retrospectively from the Oncology Information System (OIS); Mosaiq Record and Verify System version 2.64. The ‘Audit’ function was used to ‘View User Log’ and filtered for breast and prostate patients treated at the Main Site and Satellite Site between 2nd March 2020 and 2nd April 2020. Table 1 states the time points used in the OIS.
Key time points in OIS for set-up, imaging and treatment

This was recorded for 103 patients except for 28 non-imaged breast patients where CBCT acquisition and assessment times did not exist. 7 patients were removed from the final analysis as they had nodal involvement which was only treated at the Main Site and could not be compared equitably.
All data were collected by hand and then electronically transcribed onto a spreadsheet using Microsoft Excel 2019. Descriptive statistics were calculated including the mean for central tendency and the standard deviation to measure variability. Percentage differences and the 95% CI (confidence interval) for the difference between the two total treatment time means were calculated.
Literature review
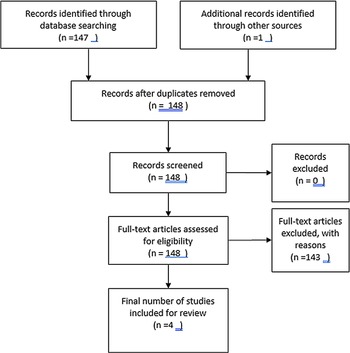
A search utilising variations and combinations of the keywords ‘radiotherapy workflow’, ‘efficiency’, ‘throughput’ and ‘room occupancy’ was performed using the CINAHL Complete and Science Direct databases. Inclusion criteria consisted of peer-reviewed articles between 2015–20 and time and motion primary studies. Screening and quality assessment were performed as per the Preferred Reporting Items for Systematic Reviews and Meta-Analyses (PRISMA) guidelines and are summarised in Figure 1. 5 The remaining papers were included in the review as they were considered the most relevant and of the highest quality.
PRISMA flow diagram.

Results
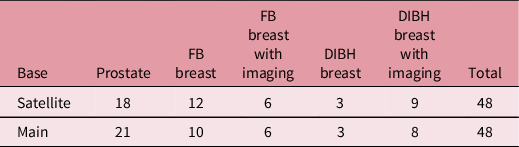
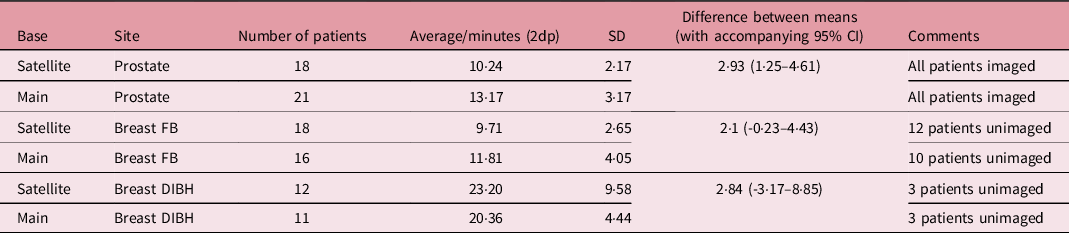
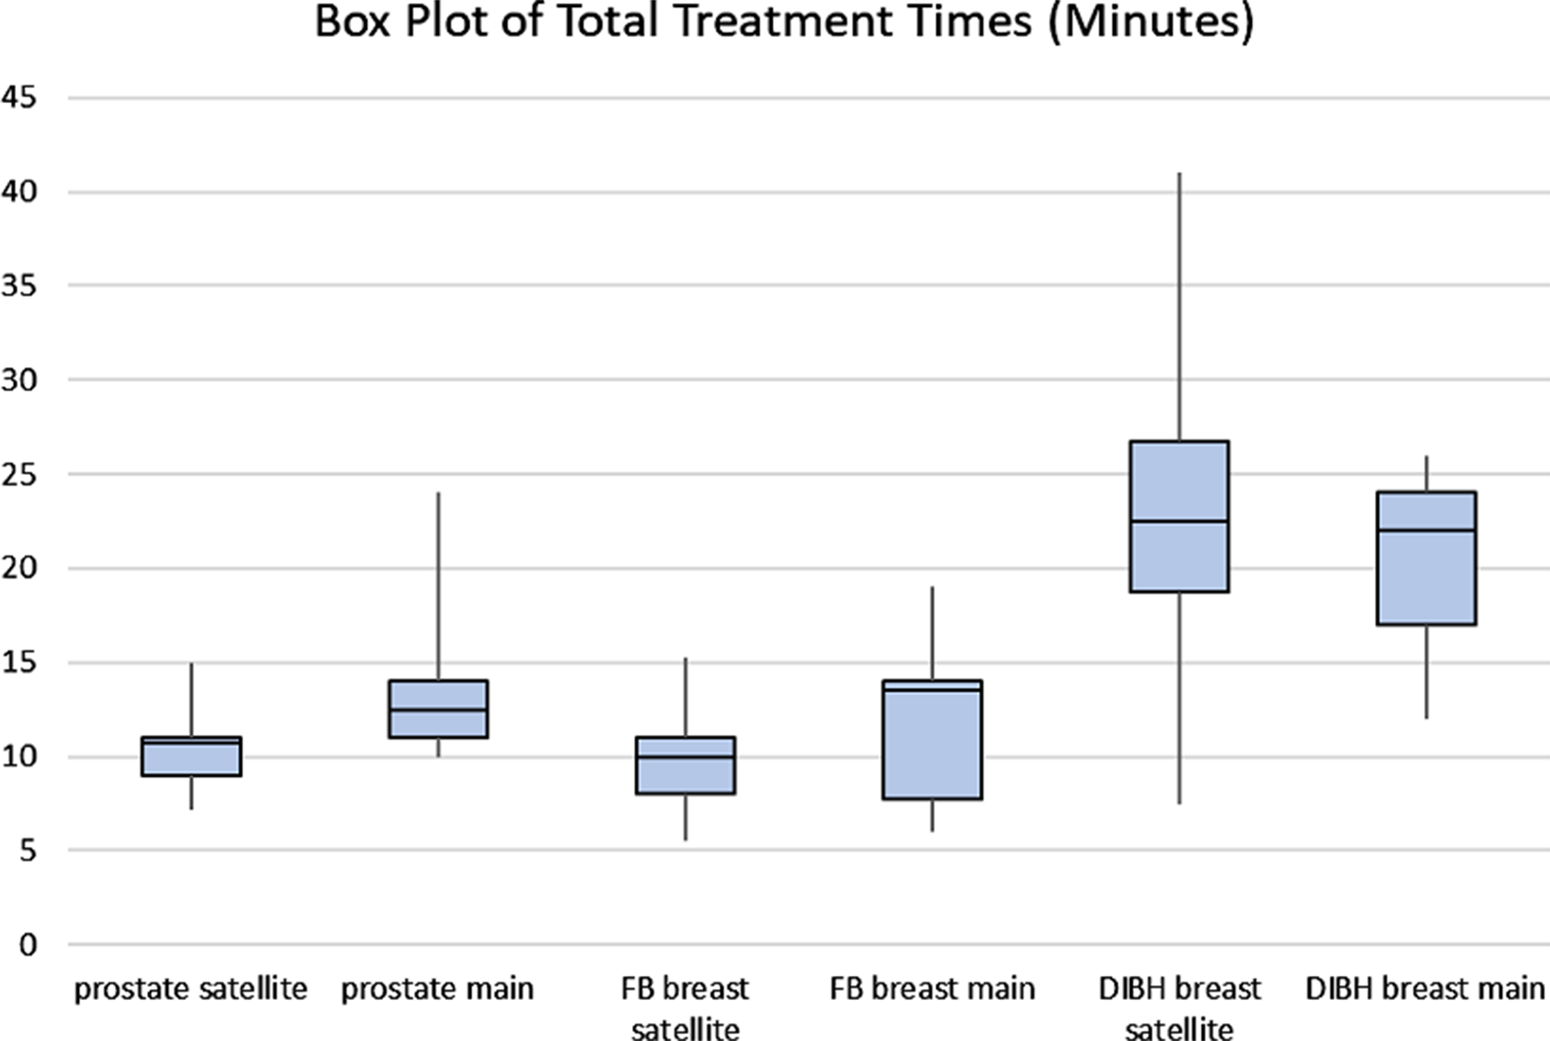
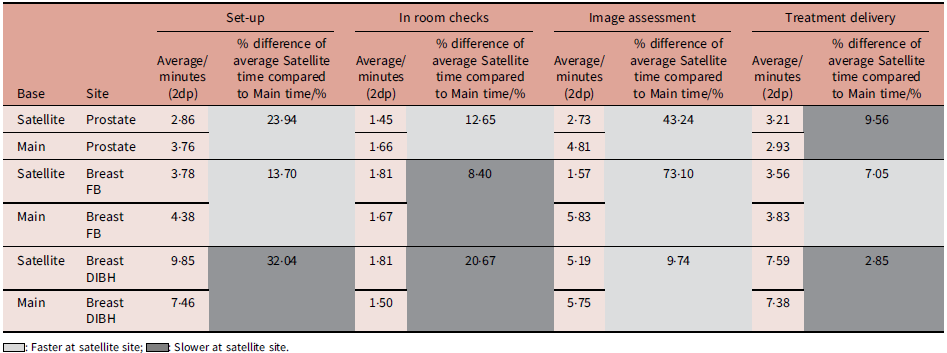
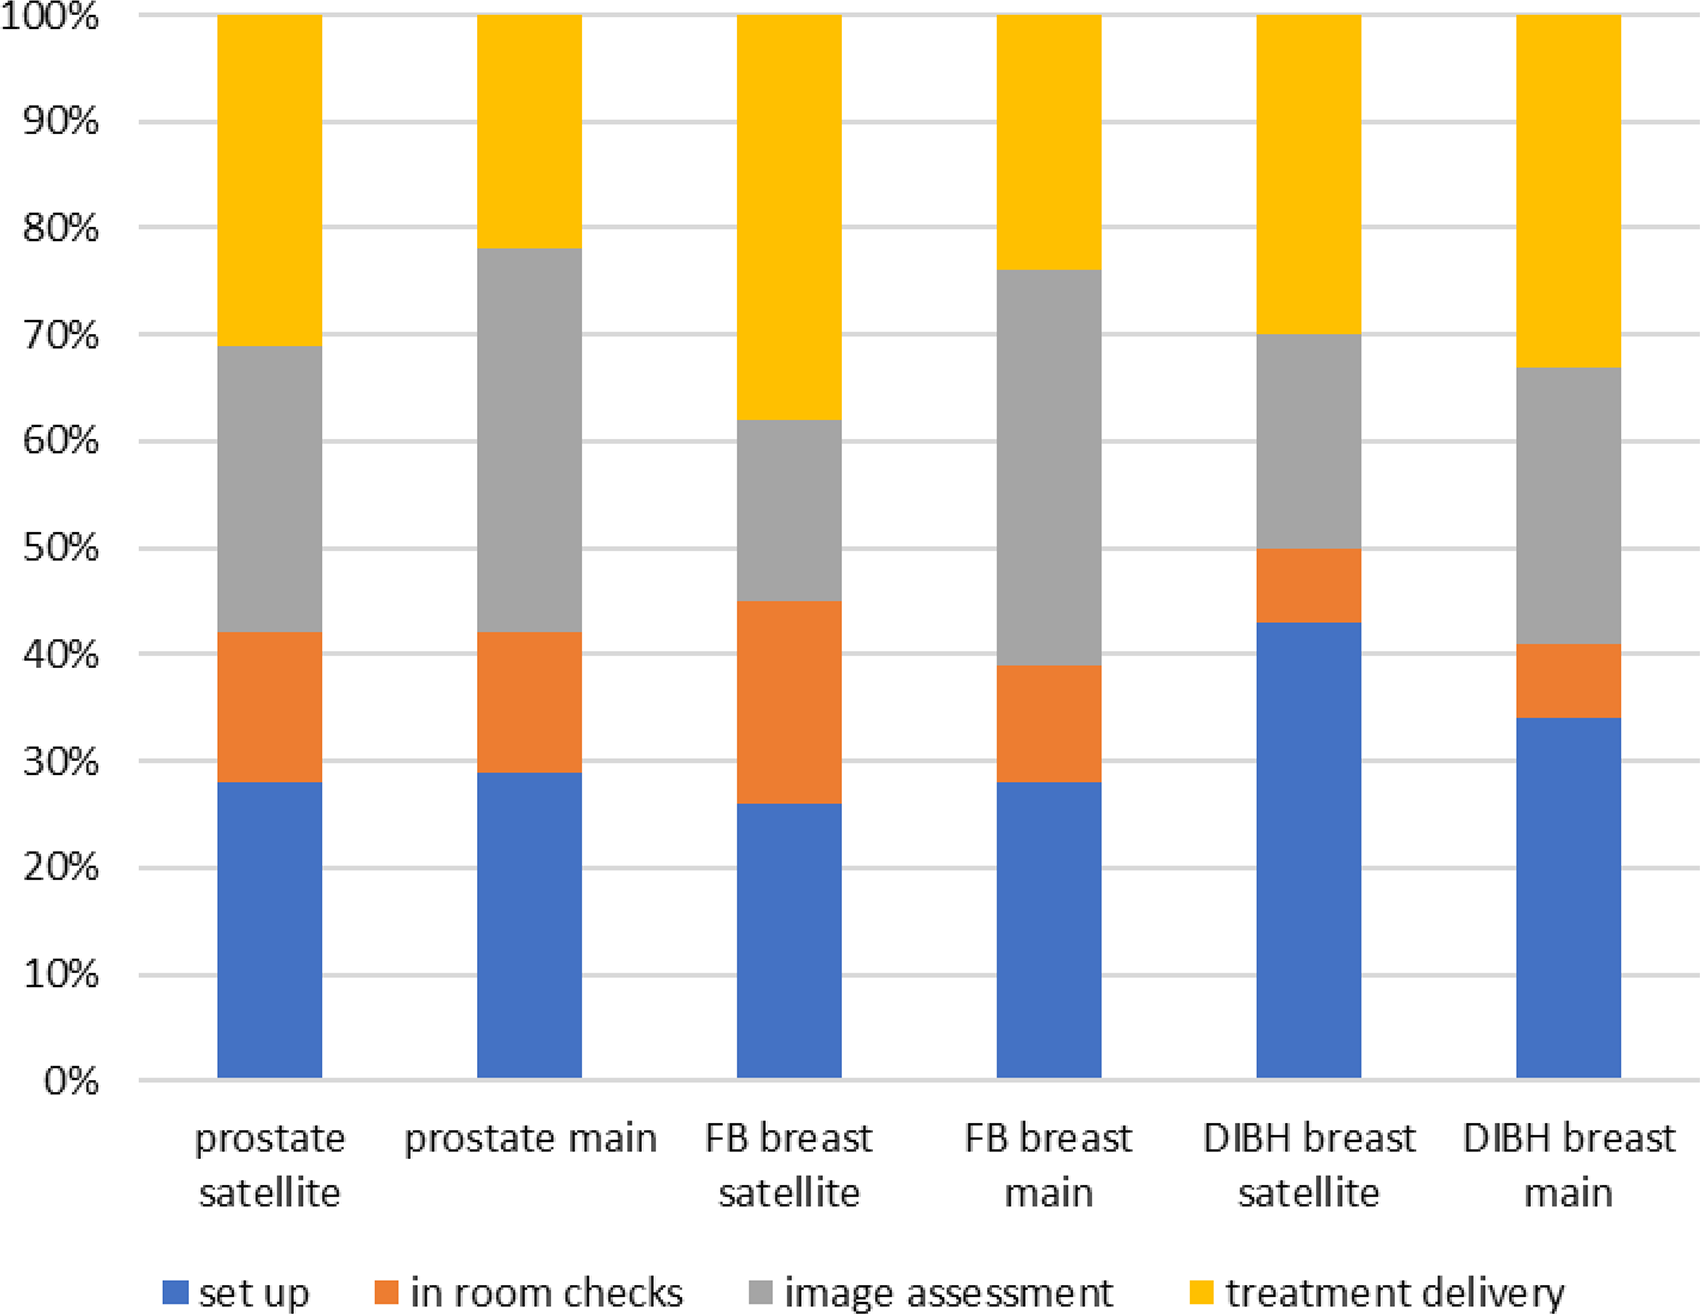
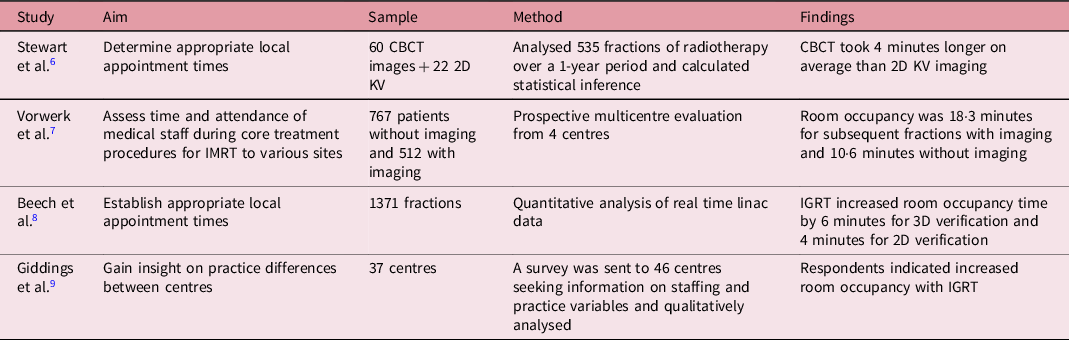
Table 2 shows the number of patients included in the study and the corresponding treatment site which is equitable between the Satellite and the Main Site. A breakdown of the total treatment times for each site is presented in Table 3 where Prostate and Breast FB are faster at the Satellite Site. The Box Plot in Figure 2 demonstrates this further with higher standard deviations at the Main Site. Table 4 breaks down the total treatment times into different points within the treatment workflow which is also illustrated by Figure 3. A summary of key findings from the literature review is shown in Table 5.
Number and treatment site of patients included in study

Total treatment times

Box plot of total treatment times.

Average time for workflow points

Stacked bar chart to show proportions of workflow.

Discussion
A key finding was that the total treatment time was 2·93 minutes faster for prostates at the Satellite Site. FB breast treatments were also found to be faster by 2·1 minutes at the Satellite Site; however, the range in the 95% CI (-0·23–4·43) indicates that there is no effect in the results found. The sample was variable for this group as shown by the high SDs of 4·05 at the Main Site and 2·65 at the Satellite Site. This project inherently compared differences in the clinical workflow making a degree of variability within the sample inevitable. There may also have been technical difficulties on the treatment unit experienced at the time of data collection. This was certainly the case for DIBH breast where a large range in the 95% CI (-3·17–8·85) was found. The equipment used for DIBH at the Satellite Site during this time had connectivity issues with the linac, slowing down the workflow and giving a significant total treatment time SD of 9·58 at the Satellite Site. Prospective data collection at the point of treatment would have allowed observations to be made on specific causes of variability; however, it was not possible to perform in-person data collection for a non-essential task during the COVID-19 Pandemic.
While recognising variability and a reduced degree of confidence for breast results, the data collected indicate a higher degree of efficiency at the Satellite Site. The vast majority of FB breast and prostate treatments were faster at the Satellite Site which merits further discussion. Breaking down the workflow shows that fundamental areas that take more time at the Main Site are set-up and image assessment. Combining key differences in the workflow at each site with a review of the published literature gives two key emergent themes as possible reasons for these findings:
Paperless workflows
Set-up is 23·94% faster for prostate and 13·7% faster for FB breast at the Satellite Site. A polarity between sites is that the Satellite Site is paperless while the Main Site is working towards this. Paper-based practice at the Main Site lends itself to more checking procedures, particularly during set-up. For example, isocentre shifts are checked daily as there is a manual, paper-based process in place for amending shifts, and FSDs are recorded for most fields daily as the paper treatment sheet has a section for recording these, and field borders for breast treatments are checked daily.
Miriyala et al. conducted a study with the purpose of evaluating the impact of paperless workflow management on efficiency in a high-volume UK radiotherapy department. Reference Miriyala, Thakur and Singh10 Records of patients treated over a 2-month period before and after paperless implementation were retrospectively evaluated. Of the 343 cases, paperless workflow management improved overall efficiency from 67 to 79%. Efficiency was defined as the proportion of patients starting without delay and did not analyse fractional timings, but it emphasises the improvement in efficiency that can be achieved with paperless processes.
Public Health England has echoed this finding that key areas of inefficiency were duplication of effort with paper and electronic systems and redundant checking processes. 4 Another smaller-scale study at a large UK radiotherapy centre where a paperless workflow from referral to last fraction had been implemented found that the number of incidents related to transcription errors decreased from 29 to 16% since the paperless change. Reference O’Shoffren, Tsang and Kudhail11 It is imperative that efficiencies in checking procedures are not implemented at the expense of safety. However, the local and national evidence indicates that compared to paper-based methods the workflow can be streamlined and optimised while enhancing safety.
Imaging assessment
The most striking finding was that all the FB breast, DIBH breast and prostate timings for the image assessment were substantially higher at the Main Site. Given that treatment delivery and image acquisition times are identical, it is likely that CBCT review is responsible for this. CBCT review for FB breast and prostate CBCTs was 73·1 and 43·24% faster, respectively, at the Satellite Site and took a much larger proportion of the total fraction workflow at the Main Site, especially for FB breasts where it was 37 versus 17% at the Satellite Site. In practical terms, there is the potential to reduce Main Site image assessment times by 4 and 2 minutes for FB breast and prostate treatments if review processes at each site can be aligned. This is echoed by the international body of evidence summarised in Table 5 which suggests that image assessment in the advent of increased IGRT increases appointment times by approximately 4 to 8 minutes. Reference Stewart, Sun and Kim6–Reference Giddings, Nica, French, Davis, Smoke and Bolderston9
Summary of key findings of literature review *

* The findings of the literature review will be discussed further in the discussion section alongside the results of the audit.
Quality assurance versus efficiency
Advanced imaging in radiotherapy has paved the way for highly accurate treatment techniques that improve patient outcomes. Reference McNair and Buijs12 It is therefore inappropriate to reduce IGRT solely to improve efficiency, but there is scope to review the imaging process, to see where efficiencies could be gained in this area. At both sites, identical soft tissue matching protocols are in place alongside robust IGRT training and radiographers are adept at dealing with issues found on CBCT. However, variance in timings at the Satellite and Main Sites indicates a degree of inconsistency between practices in the management of CBCT information.
A common theme that emerged from the literature was radiographer role development and its impact on decision-making time on CBCTs. Stewart et al. Reference Stewart, Sun and Kim6 performed timings using a stopwatch so could witness first hand that waiting for other staff to make decisions on the imaging slowed down the workflow. Giddings et al. Reference Giddings, Nica, French, Davis, Smoke and Bolderston9 also found daily imaging increased room occupancy due to the decision-making process, and they argued that role definition for radiographers working in supervisory and supporting positions has not kept pace with additional responsibilities in the advent of IGRT. Radiographers working at the single unit Satellite Site are used to looking at specific patients and their anatomy daily, especially breast and prostate scans which constitute the bulk of the workload. Cross-treatment unit and disease site working at the Main Site could slow down the review process.
To empower radiographers to make decisions proficiently on the imaging, there are tools available. Li et al. studied IGRT cases from 4592 patients Reference Li, Jaffray, Wilson and Moseley13 and found that daily IGRT was set-up in a safe and efficient manner and stated that this was due to standardisation of IGRT training, defined workflows and region of interest matching protocols. One such strategy for this is the use of a Traffic Light Protocol (TLP) for image matching. Kwint et al. published the first extensive study of a TLP system. Reference Kwint, Conijn and Schaake14 1793 thoracic CBCTs were systematically analysed and quantified to develop an action level protocol to act as a decision support system to guide radiographers in prioritising any changes noted. Radiographers were trained to act accordingly to these changes using a TLP which led to the protocol being introduced clinically. However, the study applied a TLP to the CBCTs retrospectively which could introduce inaccuracies compared to its prospective application as on set decisions may differ due to time pressures and patient factors. This led the authors to prospectively validate the TLP on 365 lung cancer patients treated between November 2015 and September 2016 at the same centre, and results were presented at the World Lung Conference. Reference Belderbos15 It was found that the TLP enabled radiographers to confidently prioritise decisions on the CBCT.
Bogaert et al. found similar results for cervix treatments when a TLP was introduced to aid soft tissue matching. Reference Chun, Hu and Choy16 The protocol was used prospectively for 206 CBCTs and validated retrospectively to ensure standardisation of its use. It was found that the TLP resulted in faster decision-making and increased radiographer confidence as well as more rigorous re-plan requesting. Image review is largely subjective making studies in this area difficult to analyse quantitatively. However, the collective high patient numbers and multi-departmental nature provide evidence that there are no practical limitations to implement a TLP in other radiotherapy centres.
Conclusion
Internationally, radiotherapy demand is increasing with more complex deliveries and robust IGRT protocols that accompany this. There is a lack of literature looking at the workflow within a fraction and how to refine this as a means of improving efficiency. A local review of fractional processes was therefore deemed beneficial to improve the time taken to treat a patient without jeopardising rigorous safety standards. The key finding is that set-up and image assessment are crucial areas for efficiency improvement. The roll-out of paperless workflows will harness efficiencies during set-up and image assessment as well as justify reduced parameter checking and habitual paper-based recording. The safe and efficient implementation of IGRT must be both thorough and prompt. TLPs for each anatomical site could offer a solution to inconsistencies in the management of information gained by CBCT, improve radiographer confidence and eventually reduce the length of treatment sessions.
Maximising the technical pathway in this way not only represents a cost-effective use of resources but also could improve service user experience with decreased waiting times and improved access to advanced techniques. As professionals who practice at the interface between treatment technology and patients, radiographers are best positioned to optimise the use of technology through MDT collaboration and must continue to investigate and assess its efficacy and efficient use.
Acknowledgements
I would like to acknowledge the support and guidance of all my colleagues in the Radiotherapy Department, particularly Holly Hall and David Driver as well my academic supervisor Cath Holborn.
Financial Support
This research received no specific grant from any funding agency, commercial or not-for-profit sectors.
Conflicts of Interest
The authors declare no conflicts of interest.
Ethical Standards
Approval for this project was sought from the NHS Trust’s Research and Development department and was registered with the Trust’s audit department. No patient data was collected to avoid any breaches in confidentiality.