INTRODUCTION
Continuous rice–wheat cropping system in the Indo-Gangetic Plains (IGP), often with poor management, has resulted in a decline in productivity and crop yields in the highly productive areas (Singh et al. Reference Singh, Tripathi and Kumar2011; Jat et al. Reference Jat, Gathala, Saharawat, Tetarwal, Gupta and Yadvinder-Singh2013). This has also resulted in loss of soil fertility due to emergence of multiple nutrient deficiencies (Dwivedi et al. Reference Dwivedi, Shukla, Singh, Yadav, Subba Rao and Srivastava2001) and deterioration of soil physical properties (Gathala et al. Reference Gathala, Kumar, Sharma, Saharawat, Jat, Singh, Kumar, Jat, Humphreys, Sharma, Sharma and Ladha2013). Besides, this cropping system is input-intensive, i.e. there is demand for high doses of fertilizers, high levels of irrigation and intense tillage practices, which makes it unsustainable. This calls for finding an alternative cropping system and suitable management practice, which can sustain soil and environmental health in addition to improving crop water-use efficiency (WUE) and farm economy (Das et al. Reference Das, Bhattacharyya, Sudhishri, Sharma, Saharawat, Bandyopadhyay, Sepat, Bana, Aggarwal, Sharma, Bhatia, Singh, Datta, Kar, Singh, Singh, Pathak, Vyas and Jat2014).
The fertilizer nitrogen (N) use of rice–wheat cropping system in the IGP is low, ranging from between 21 and 31% in rice and 32–52% in wheat, due to N losses by different pathways (Aulakh & Singh Reference Aulakh and Singh1997). Growing a legume crop in place of rice may have advantages well beyond the N additions through biological N2 fixation, including nutrient recycling from deeper layers, minimizing soil compaction, increasing soil organic matter, facilitating soil aggregation, breaking of weed and pest cycles, minimizing harmful allelopathic effects and also improving WUE and nutrient-use efficiency (Ghosh et al. Reference Ghosh, Bandyopadhyay, Wanjari, Manna, Misra, Mohanty and Subba Rao2007; Thierfelder et al. Reference Thierfelder, Cheesman and Rusinamhodzi2012). Constraints such as the cost of raising a leguminous crop and delays in wheat sowing due to the long duration of monsoon grain legumes restricts the integration of legumes on a large scale (Ali Reference Ali1999; Siddique et al. Reference Siddique, Johansen, Turner, Jeuffroy, Hashem, Sakar, Gan and Alghamdi2012). However, development of short-duration pigeonpea varieties in recent years improves the feasibility of growing pigeonpea instead of rice in the rice–wheat cropping system.
Pigeonpea occupies an area of c. 3·4 million ha with a total production of 2·3 million tonnes (t) and an average productivity of 678 kg/ha (Government of India 2010). Singh et al. (Reference Singh, Dwivedi, Shukla, Chauhan and Yadav2005) reported that the net economic returns under the pigeonpea–wheat system were greater compared with the rice (Oryza sativa L.)–wheat system in this region and the former system had better soil health than the latter. Thus, this system has the capacity for improving the livelihood of the farmers of the region and saving water. However, Singh et al. (Reference Singh, Dwivedi, Shukla, Chauhan and Yadav2005) also conducted a survey and observed that wheat yields in this region were lower (3·3 t/ha) when sown after pigeonpea than after rice (3·7 t/ha). This calls for investigations into the possibilities for enhancing yields of both crops. Since conservation tillage, residue retention and bed planting practices have some advantages such as improved hydraulic properties, aggregation and soil organic carbon (SOC) and N (Bhattacharyya et al. Reference Bhattacharyya, Prakash, Kundu and Gupta2006, Reference Bhattacharyya, Pandey, Bisht, Bhatt, Gupta, Tuti, Mahanta, Mina, Singh, Chandra, Srivastva and Kundu2013a ) and higher WUE (Das et al. Reference Das, Bhattacharyya, Sudhishri, Sharma, Saharawat, Bandyopadhyay, Sepat, Bana, Aggarwal, Sharma, Bhatia, Singh, Datta, Kar, Singh, Singh, Pathak, Vyas and Jat2014), the same practices could improve both wheat and pigeonpea yields.
Conservation agriculture (CA), which involves crop residue retention, no or reduced tillage, crop rotation and controlled traffic that lessens compaction, can help in improving soil health, sustaining crop productivity (Ladha et al. Reference Ladha, Kumar, Alam, Sharma, Gathala, Chandna, Saharawat, Balasubramanian, Ladha, Yadvinder-Singh, Erenstein and Hardy2009; Bhattacharyya et al. Reference Bhattacharyya, Pandey, Bisht, Bhatt, Gupta, Tuti, Mahanta, Mina, Singh, Chandra, Srivastva and Kundu2013a , Reference Bhattacharyya, Das, Pramanik, Ganeshan, Saad and Sharma b ), enhancing input-use efficiency and facilitating C sequestration (West & Post Reference West and Post2002; Bhattacharyya et al. Reference Bhattacharyya, Kundu, Pandey, Singh and Gupta2008, Reference Bhattacharyya, Prakash, Kundu, Srivastva and Gupta2009, Reference Bhattacharyya, Tuti, Kundu, Bisht and Bhatt2012a , Reference Bhattacharyya, Tuti, Bisht, Bhatt and Gupta b ; Kassam & Friedrich Reference Kassam, Friedrich, Pisante and Stagnari2011). Bed planting generally saves irrigation water (Gathala et al. Reference Gathala, Ladha, Saharawat, Kumar, Kumar and Sharma2011; Das et al. Reference Das, Bhattacharyya, Sudhishri, Sharma, Saharawat, Bandyopadhyay, Sepat, Bana, Aggarwal, Sharma, Bhatia, Singh, Datta, Kar, Singh, Singh, Pathak, Vyas and Jat2014; Kukal et al. Reference Kukal, Yadvinder-Singh, Jat and Sidhu2014) and labour without compromising crop productivity (Hobbs & Gupta Reference Hobbs, Gupta and Singh2000; Karunakaran & Behera Reference Karunakaran and Behera2013; Naresh et al. Reference Naresh, Rathore, Kumar, Singh, Singh and Shahi2014). No information is available on system productivity and WUE of the pigeonpea–wheat system in this region as affected by zero tillage (ZT), with or without residue retention. Moreover, no information is available on relative performance of ZT and zero tilled-permanent broad- and narrow-bed sowing with and without residue retention on the performance of the system.
The permanent bed planting technique has been developed for reductions in production costs (Lichter et al. Reference Lichter, Govaerts, Six, Sayre, Deckers and Dendooven2008). Permanent raised beds permit the maintenance of a permanent soil cover on the bed for greater rainwater capture and resource conservation (Govaerts et al. Reference Govaerts, Sayre and Deckers2005, Reference Govaerts, Sayre, Lichter, Dendooven and Deckers2007). The advantages of permanent raised bed planting over ZT with flat planting are that it saves irrigation water, and weeding and fertilization practices are performed easily by traffic in the furrow bottoms (Limon-Ortega et al. Reference Limon-Ortega, Sayre, Drijber and Francis2002; Das et al. Reference Das, Bhattacharyya, Sudhishri, Sharma, Saharawat, Bandyopadhyay, Sepat, Bana, Aggarwal, Sharma, Bhatia, Singh, Datta, Kar, Singh, Singh, Pathak, Vyas and Jat2014). Past research suggests some advantages of broad beds over narrow beds in the maize–wheat system in Mexico and elsewhere. For example, Akbar et al. (Reference Akbar, Hamilton, Hussain and Yasin2007) reported a water saving of c. 36% for broad beds and c. 10% for narrow beds compared with flat sowing and that grain yield increased by 6% for wheat and 33% for maize in Pakistan. In both cases, the furrows act both as pathways for drainage of excess rain and for conservation of rainwater in dry spells (Astatke et al. Reference Astatke, Jabbar, Mohamed Saleem and Erkossa2002). Residue retention generally increases SOC content (Saharawat et al. Reference Saharawat, Singh, Malik, Ladha, Gathala, Jat and Kumar2010; Das et al. Reference Das, Bhattacharyya, Sharma, Das, Saad and Pathak2013) and improves productivity (Verhulst et al. Reference Verhulst, Sayre, Vargas, Crossa, Deckers, Raes and Govaerts2011; Naresh et al. Reference Naresh, Singh and Chauhan2012; Siddique et al. Reference Siddique, Johansen, Turner, Jeuffroy, Hashem, Sakar, Gan and Alghamdi2012). However, there is a need for wider-scale evaluation of these novel technologies under diverse production systems for productivity and WUE, as the CA technologies are site- and crop-specific (Ladha et al. Reference Ladha, Kumar, Alam, Sharma, Gathala, Chandna, Saharawat, Balasubramanian, Ladha, Yadvinder-Singh, Erenstein and Hardy2009).
The present study was conducted under the ‘Challenge Programme on Conservation Agriculture’, which is studying the impacts of several novel agronomic practices under the cotton (Gossypium hirsutum L.)–wheat, pigeonpea–wheat, maize (Zea mays L.)–wheat and rice–wheat cropping systems under irrigated conditions. The results of the cotton–wheat system with similar treatment combinations have already been reported by Das et al. (Reference Das, Bhattacharyya, Sudhishri, Sharma, Saharawat, Bandyopadhyay, Sepat, Bana, Aggarwal, Sharma, Bhatia, Singh, Datta, Kar, Singh, Singh, Pathak, Vyas and Jat2014). In the present study, it was hypothesized that: (i) permanent bed planting (both narrow and broad beds) and residue retention would result in larger crop productivity and system WUE compared with farmers’ practice (CT and no residue addition), (ii) in ZT system, residue retention would improve yield and WUE over the residue removal and (iii) permanent broad beds (PBB) would have different productivity and WUE compared with permanent narrow beds (PNB), due to differences in bed configuration and plant population density. The objectives of the present study were to: (i) evaluate the impacts of CA (permanent beds with and without residue retention) on crop yield and above-ground biomass productivity under a pigeonpea–wheat system of the western IGP; (ii) assess the CA effects on WUE during a 3-year study; and (iii) evaluate the performance of residue retention v. residue removal under permanent beds, and PNB v. PBB on crop productivity and the pigeonpea–wheat system WUE.
MATERIALS AND METHODS
Study site
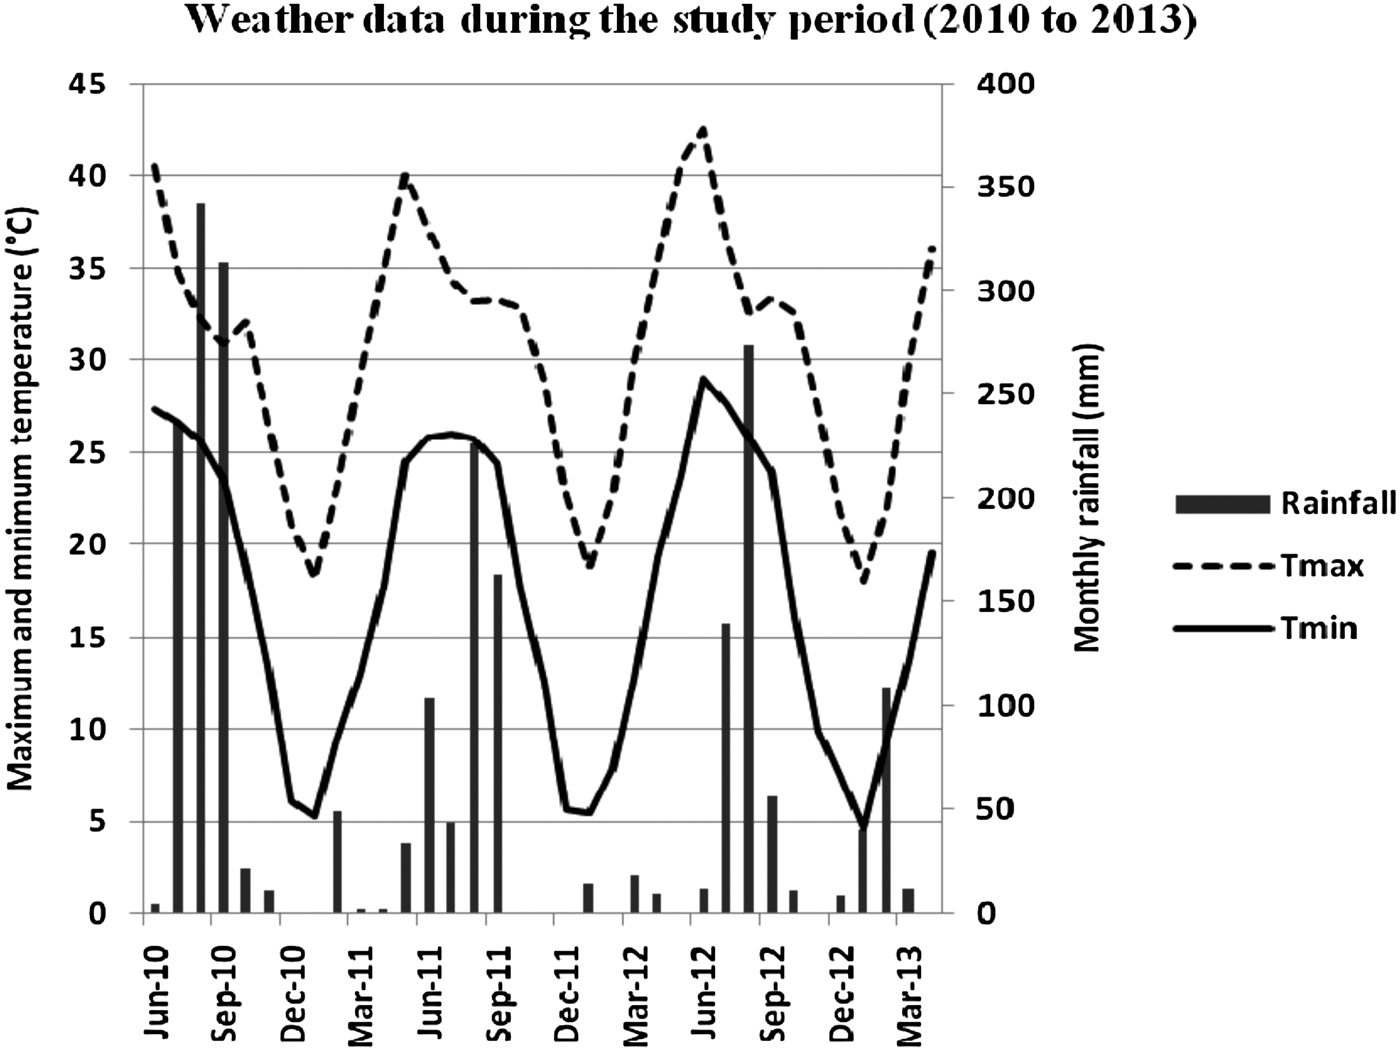
An experiment on pigeonpea–wheat cropping system was conducted during 2010–13 at the research farm of the Indian Agricultural Research Institute (IARI), New Delhi, India (28°35′N, 77°12′E; 228 m a.s.l.). The field was laser-levelled and a uniformity trial on wheat was undertaken during rabi (winter) 2009/10 before the initiation of the experiment to ensure uniform soil fertility across the entire field. The region has a sub-tropical and semi-arid climate with hot, dry summers and cold winters. May and June are the hottest months with mean daily maximum temperature varying from 40 to 46 °C, whereas January is the coldest month with mean daily minimum temperature ranging from 6 to 8 °C. The mean (last 40 years) annual rainfall is 710 mm, of which 80% is received during southwest monsoon from July to September and the rest is received through ‘Western Disturbances’ from December to February. Pan evaporation varies from 3·5 to 13·5 mm/day and reference evapotranspiration from 9 to 15 mm/day. Mean monthly values of meteorological parameters recorded at the IARI meteorological observatory adjacent to the experimental site during the experimental period (June 2010–April 2013) are presented in Fig. 1.
Monthly total rainfall, mean monthly maximum and minimum temperatures during the experimental period (June 2010–April 2013).

The soil (0–15 cm layer) of the experimental site, taken on 7 May 2010 after the uniformity trial, was sandy clay loam in texture with pH 7·7, Walkley and Black C 5·2 g/kg (Walkley & Black Reference Walkley and Black1934), electrical conductivity (EC) 0·64 dS/m, potassium permanganate (KMnO4) oxidizable N 182·3 kg/ha, 0·5 m sodium bicarbonate (NaHCO3) extractable phosphorus (P) 23·3 kg/ha and 1 N ammonium acetate (NH4OAc) extractable potassium (K) 250·5 kg/ha (IARI Reference Kumbhare, Singh, Wason, Sharma, Kumar and Sangeetha2012). The soil contained sufficient amounts of calcium chloride (CaCl2) extractable sulphur (S) and diethylene triamine pentaacetate (DTPA) extractable micronutrients as all of these were above the critical deficiency limits.
Experimental details
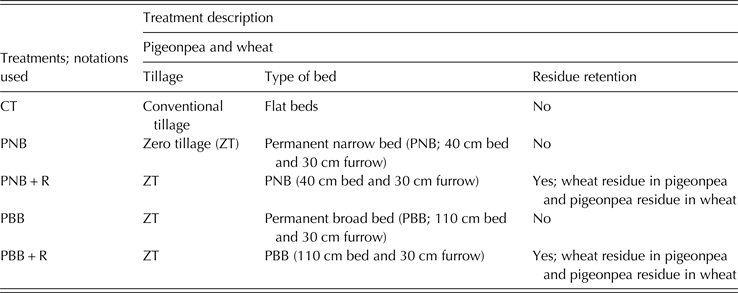
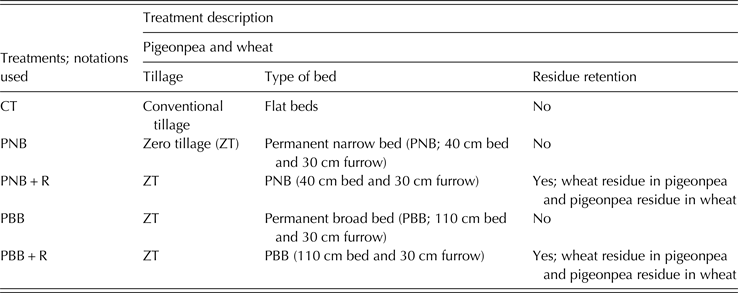
Five treatments were employed with three replications in a randomized block design. These treatments included: conventional tillage and sowing of both crops on flat beds (CT), ZT and sowing of crops on PNB, PNB with residue retention (PNB + R), ZT with sowing on broad beds (PBB), PBB with residue retention (PBB + R). Individual plot size was 9·0 × 8·4 m2. In PNB plots, there were 12 narrow beds and in PBB, there were six broad beds. In PBB plots, there were five wheat rows within ~110 cm broad beds (~110 cm bed and ~30 cm furrow), whereas in PNB plots there were three wheat rows within ~40 cm narrow beds (~40 cm bed and ~30 cm furrow). The details of bed widths and treatments are given in Table 1. Conventional tillage involved three cultivation passes (one with disc plough and two with cultivator) before each crop, while in ZT no tillage was done. Fresh raised beds were prepared during the first year of the study and were reshaped once a year before pigeonpea sowing. Pigeonpea residue involved the leaves and tender twigs, while wheat residue was retained as such after harvesting the crop with a combine harvester. Approximately 0·20 and 0·40 of the pigeonpea and wheat residues, respectively, were retained in all residue retention plots. The entire residues were not retained in the current study, because pigeonpea and wheat residues are used by the farmers as a source of fuel and cattle feed, respectively. Residues of the respective crops were retained on the soil surface at harvest under all residue retention plots, while these were removed under CT.
Treatment details and plot design
Sowing and agro-practices
Pigeonpea (cvar Pusa 992) was sown at 20 kg/ha manually in the last week of May at 70 cm between rows × 10–15 cm between plants and harvested in the last week of November. In all the years and under all plots, pigeonpea was manually seeded using a narrow slit opener, making a very shallow (4–5 cm deep) and narrow slit/furrow/opening on the soil; seeds were dibbled in a continuous manner and later thinned out to maintain the desired population. Wheat cvar HD 2932 in the first year and cvar WR 544 in the second year onwards was sown at 100 kg/ha by the first fortnight of December using a zero-till drill on the flat beds, a turbo seeder on the PBB, and a bed planter on the PNB plots. Cultivar WR 544 is a short-duration wheat variety that can tolerate terminal heat and is very suited to late planting (IARI Reference Kumbhare, Singh, Wason, Sharma, Kumar and Sangeetha2012). HD 2932 was replaced with WR 544, because HD 2932 suffered from drought stress in the early years. A common basal dose of 20 kg N + 60 kg phosphorus pentoxide (P2O5) + 40 kg potassium oxide (K2O)/ha was applied to pigeonpea. For wheat, a common dose of 120 kg N + 60 kg P2O5 + 40 kg K2O/ha was applied, of which the total amount of P and K were applied as a basal dressing along with 0·50 N, while the remaining N was top-dressed in two equal splits after the first and second irrigations. During top dressing, fertilizers were broadcast and care was taken, so that the fertilizers were targeted on the crop rows. The herbicide glyphosate was applied at 1·0 kg/ha in the ZT plots about a week before sowing of both crops. In pigeonpea, a pre-emergence treatment of pendimethalin 1·0 kg/ha was made at 2 days after sowing (DAS), while in wheat, sulfosulfuron 25 g/ha was applied post-emergence at 30 DAS (Das Reference Das and Das2008). In addition, one hand weeding was completed in the first 2 years, while quizalofop-ethyl at 50 g/ha in the third year was applied to pigeonpea at 40 DAS.
Measurement of dry matter yields
At maturity, pigeonpea was harvested manually about 4–5 cm above the ground level in the last week of November each year. Wheat was harvested with a combine about 15–20 cm above the ground level in the second week of April in all years. Seed dry matter yields of pigeonpea and wheat were obtained. Stover/straw weight was determined after oven-drying at 70 °C to a constant weight and expressed on a dry-weight basis. Grain yields of pigeonpea and wheat as well as dry matter of stover/straw were taken from the net plot area after discarding the border rows. In each treatment, there were 12 narrow beds and six broad beds. For pigeonpea and for narrow beds (row to row spacing = 0·7 m), four central beds constituting four 5-m long rows were harvested for yield measurement. Thus, the net plot area for narrow beds was 14 m2 (2·8 × 5·0 m2). For broad beds (row to row spacing = 0·7 m), two beds constituting four 5-m long rows were harvested from the net plot area of 14 m2. For wheat and for narrow beds, four central beds with three wheat rows in each bed (=12 wheat rows) were harvested from a net plot area of 14 m2 (2·8 × 5·0 m2). For broad beds, wheat yield measurements were taken from two central beds with five wheat rows in each bed (=10 wheat rows) from the net plot area of 14 m2. For ZT/CT plots (where conventional flat sowing was done), both pigeonpea and wheat were harvested from an area of 2·8 × 5·0 m2 for yield measurements. Thus, for flat sown ZT/CT plots, four pigeonpea rows and 14 wheat rows were harvested. Grain and straw dry matter yields were added together for both crops to obtain the above-ground biomass.
Estimation of residue inputs
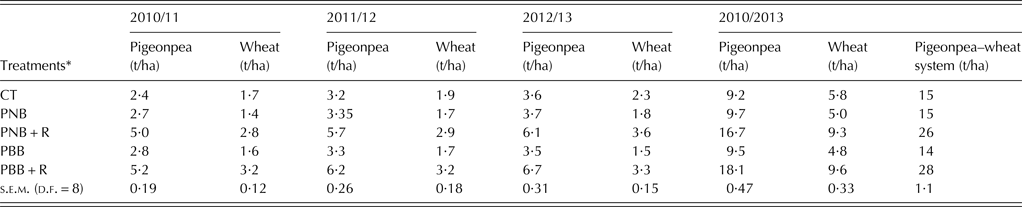
The amounts of residue inputs from pigeonpea and wheat in all years were estimated. Wheat stubble biomass (in the CT plots) were measured during the last year of the experiment and from that treatment-wise stubble:straw ratios were obtained. Wheat biomass data were calculated for all years using those ratios and a uniform value of 0·3 t/ha was considered as the stubble biomass contribution by the previous wheat crop to pigeonpea in the first year. Root biomass data for pigeonpea and wheat crops were estimated using the root:shoot ratios (5·2 for pigeonpea and 7·4 for wheat) from published research (Bolinder et al. Reference Bolinder, Andrén, Kätterer, de Jong, VandenBygaart, Angers, Parent and Gregorich2007). Treatment-wise the below-ground root (and rhizo-deposition) biomass for all crops was computed by assessing the shoot biomass (total above-ground biomass as the sum of grain and stover/straw yields) for both crops. Approximately 0·20 of the pigeonpea stover and 0·40 of the wheat straw biomass were retained in the residue-amended plots (PNB + R and PBB + R). In the first year before initiation of the experiment, the previous wheat crop was harvested and an estimated quantity of c. 2·6 t/ha wheat residue was retained in the PBB + R or PNB + R plots. Wheat straw yield of that year was ~6·5 t/ha. It was estimated that in all years, c. 0·045 of wheat straw remained as stubble in the CT and other residue removal plots. Thus, the estimated amounts of wheat + pigeonpea residues returned to pigeonpea–wheat cropping system are given in Table 2.
Estimated total residue inputs during three years under the different conservation agricultural practices under the pigeonpea–wheat cropping system
* See Table 1 and Materials and Methods section for treatment details.
Measurement of irrigation water, total water applied and water-use efficiency
These parameters were measured during the last 2 years (2011/12 and 2012/13) of the experiments. In both years, five irrigations for pigeonpea and five irrigations for wheat, excluding the pre-sowing irrigation, were applied. The irrigation water depth applied to each experimental plot was measured on an average four times using a digital velocity meter and the wetted area of the field channel. At the start of the experiment, a rating curve was generated showing the relationship between flow depth and discharge in the main channel and then an exponential equation was developed. Afterwards, at every irrigation, only flow depth was measured in the channel and corresponding discharge was determined using either the rating curve or the exponential equation developed. Irrigation water depths indicated by the soil moisture deficit (SMD) in each treatment were calculated using the soil moisture content of before irrigation and root zone depth of plants, besides soil bulk density and time taken to compensate the SMD, using Eqn (1) (Michael Reference Michael and Michael2008):
 $${\rm SMD} = ({\theta _{{\rm Fc}}} - {\rm} {\theta _i}) \times {D_{{\rm RZ}}} \times {B_d}$$
where SMD: soil moisture deficit (mm), θ Fc: soil water content at field capacity (%), θ i : soil water content before irrigation (%), D RZ: root zone depth (mm), B d : bulk density of soil (t/m3). Soil moisture content at any time was measured using a time-domain reflectometer (TDR) that was calibrated previously using the gravimetric method. Daily rainfall data were collected from a rain gauge located at about 1 km southeast of the experimental plots. Effective rainfall was calculated using standard methods given by FAO (2010) and then total water use was computed as the sum of water applied through irrigations and effective rainfall. The system WUE (kg wheat grains/ha × mm of water) of the pigeonpea–wheat system was computed following Bhushan et al. (Reference Bhushan, Ladha, Gupta, Singh, Tirol-Padre, Saharawat, Gathala and Pathak2007).
Statistical analyses
All data were analysed using analysis of variance (ANOVA) for a randomized block design (Gomez & Gomez Reference Gomez, Gomez, Gomez and Gomez1984). Grain and biomass yields of all years and WUE data of 2011/12 and 2012/13 were further analysed to delineate the impacts of bed width and residue retention. Hence, partition of the four treatment degrees of freedom into single degree of freedom contrasts was done. The contrast analysis has a factorial structure with tillage contrast (CT v. CA), residue contrast (residue retention v. residue removal), bed width contrast (PNB v. PBB) and residue × bed width interaction contrast.
RESULTS
Estimated residue inputs
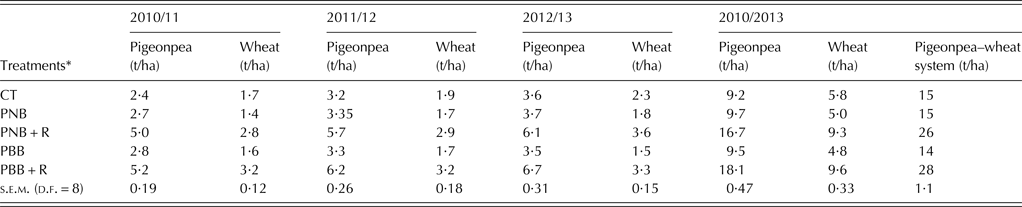
The mean annual input of organic biomass/residues to soil from all crops (Table 2) varied with above-ground yield responses of the crops and treatment. Cumulative residue input from pigeonpea during the 3 years under PBB + R was 18·1 t/ha compared with only 9·2 t/ha for CT plots (Table 2). Roots and rhizodeposition from all crops contributed significant amounts of biomass input to the soil in both crops. Plots under PNB + R and PBB + R had 73 and 86·6% higher estimated residue inputs than CT plots during the 3 years (Table 2).
Grain yield
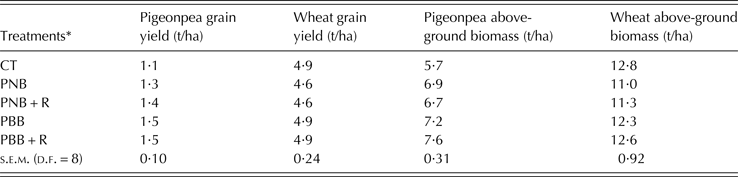
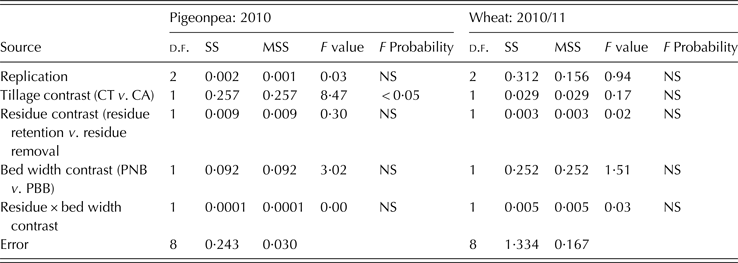
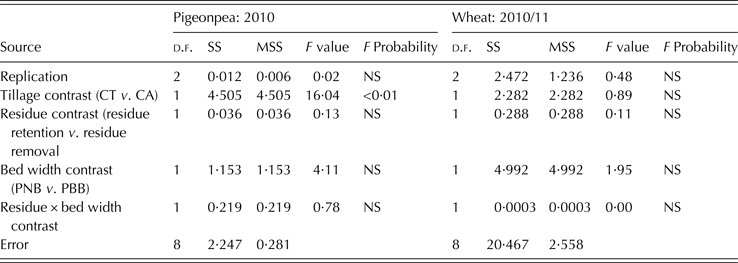
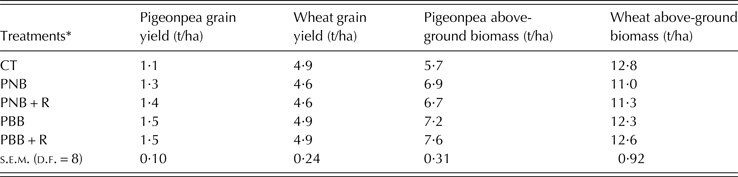
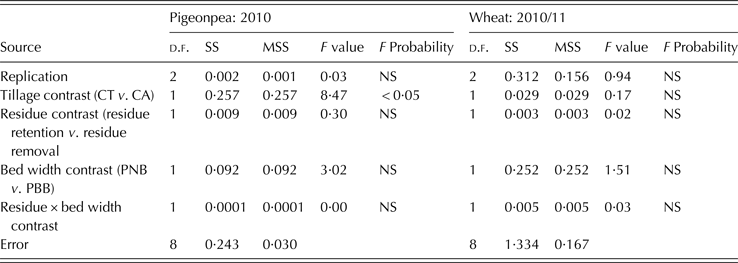
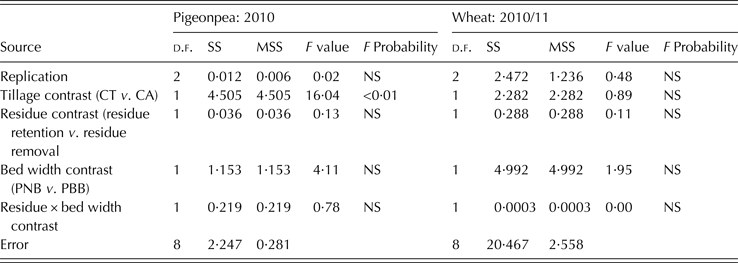
The plots under PBB + R had c. 40% higher pigeonpea grain yield compared with the CT plots (farmers’ practice) during the first year of the study (Table 3). The PBB plots had c. 14% higher pigeonpea grain yield than PNB plots (1·31 t/ha) in the first year. In contrast, the wheat grain yields of PBB + R and CT plots were similar during that year (Table 3). To delineate the impacts of residues and bed width, contrast analyses were performed. Results reveal that all CA plots had 33 and 24% higher pigeonpea grain yield and pigeonpea biomass yields, respectively than CT plots in the first year (Tables 3a and 3b ). All other contrasts (PNB v. PBB, residue retention v. residue removal and their interaction) were not significant.
Productivity (t/ha) of pigeonpea and wheat as affected by conservation agriculture in the western Indo-Gangetic Plains in (2010/11)
* See Table 1 and Materials and Methods section for treatment details.
Factorial analysis of variance of pigeonpea and wheat grain yields (t/ha) in 2010/11
Factorial analysis of variance of biomass productivity (t/ha as dry matter) of pigeonpea and wheat in 2010/11
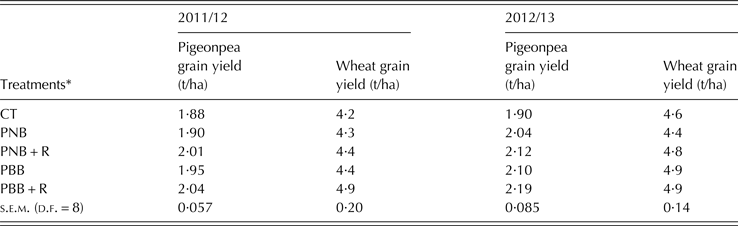
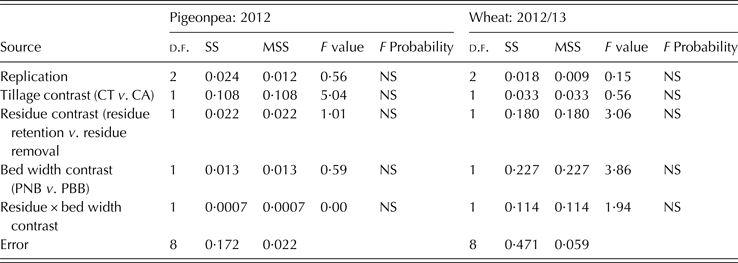
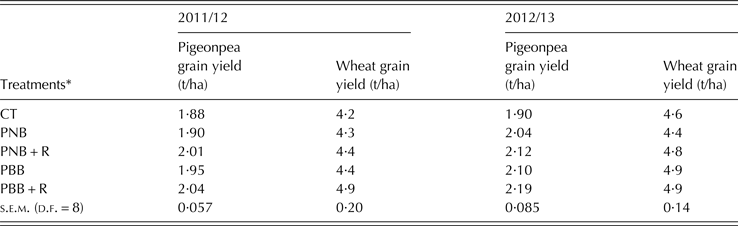
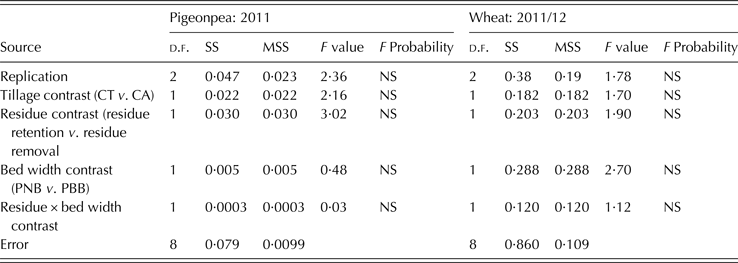
In the second year, all plots had similar pigeonpea grain yield (Table 4) with no significant differences between treatments. The PBB + R plots had c. 16% higher wheat grain yield than CT plots (4·2 t/ha) in the second year. Similarly, wheat grain yield under PBB + R plots was 10% higher compared with PBB (4·4 t/ha) in the second year. Contrast analysis showed that during the second year, the grain yields of wheat for CT v. all CA plots, PNB v. PBB plots, residue retained v. residue removal plots and interaction of bed width × residue management were not significant (Tables 4a and 4b ).
Productivity (t/ha) of pigeonpea and wheat as affected by conservation agriculture in the western Indo-Gangetic Plains during the 2011/12 and 2012/13 seasons
* See Table 1 and Materials and Methods section for treatment details.
Factorial analysis of variance of pigeonpea and wheat grain yields (t/ha) in 2011/12
Factorial analysis of variance of pigeonpea and wheat grain yields (t/ha) in 2012/13
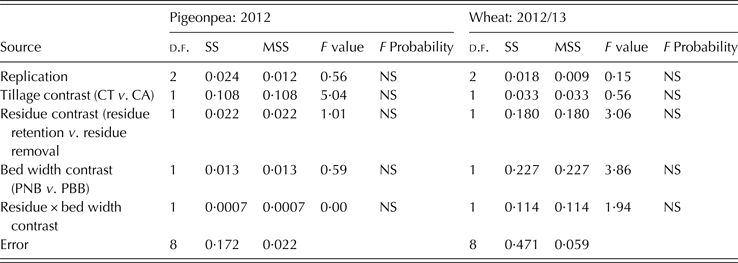
In the third year, plots under PBB + R had 15% higher pigeonpea grain yield compared with CT plots (Table 4). However, PBB + R plots had similar wheat grain yield to CT plots in that year (Table 4).
Above-ground biomass
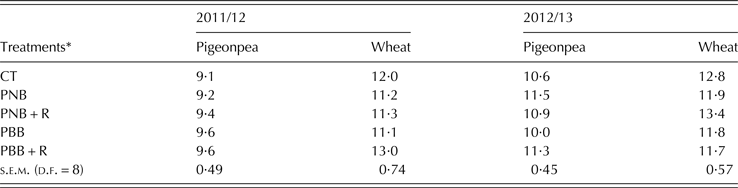
Similar to the pigeonpea grain yield data, PBB + R plots had significantly (P < 0·05) higher pigeonpea biomass than CT and PNB plots in the first year (Table 3). As with pigeonpea grain yield, PBB + R plots had c. 33% higher pigeonpea total above-ground biomass compared with the CT plots in the first year (Table 3). Pigeonpea biomass of PNB + R plots was 13% less than PBB + R plots in that year. Despite similar wheat grain yields in all treatments, plots under PBB + R plots had significantly (P < 0·05) higher wheat biomass yield than PNB and PBB + R plots, indicating superiority of the PBB + R plots in the first year.
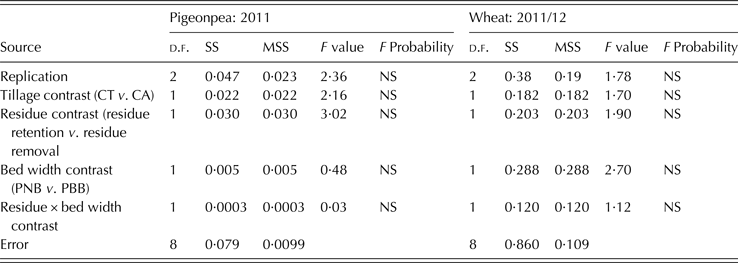
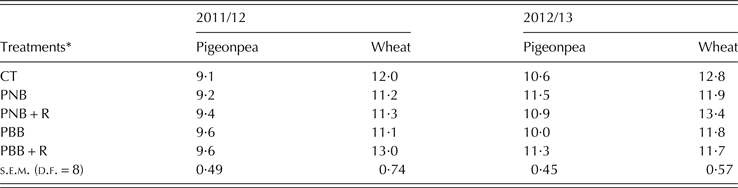
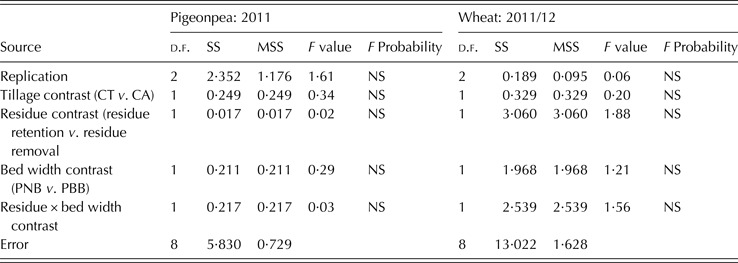
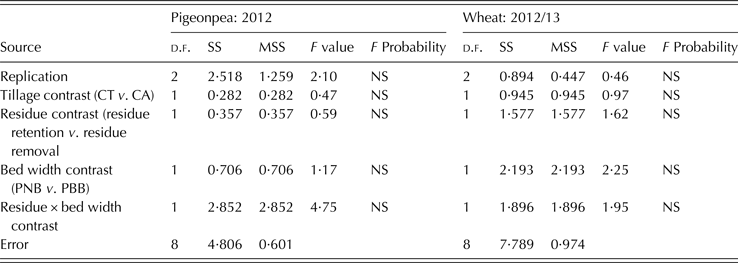
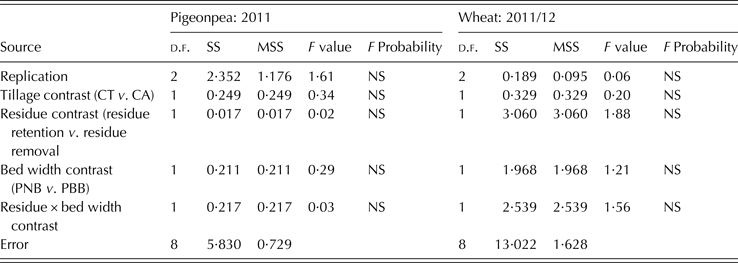
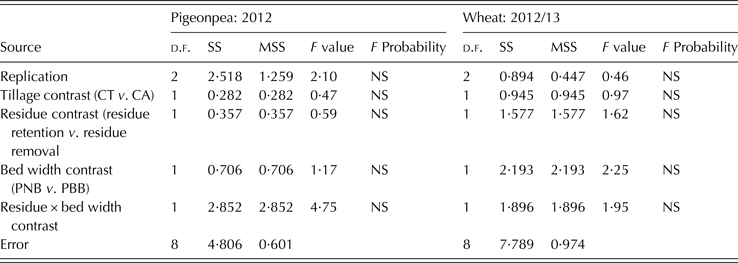
However, all plots had similar pigeonpea biomass both in the second and third years except for PBB + R plots, which had 13% higher pigeonpea biomass than PBB plots in the third year (Table 5). There was no consistent trend among the treatments in terms of wheat biomass yield during the last 2 years. In the second year, although CT plots had similar wheat biomass to PBB + R plots, PBB + R plots had significantly higher wheat biomass yield than PBB, PNB and PNB + R plots (Table 5). However, in the third year, PNB + R plots had ~14% higher wheat biomass than PBB + R plots (Table 5), and PNB + R plots also had higher wheat biomass compared with PNB and PBB plots. All contrasts (CT v. CA; PNB v. PBB, residue retention v. residue removal and the interaction of bed width and residue management) were non-significant for both pigeonpea and wheat biomass in the last 2 years of the study (Tables 5a and 5b ).
Above-ground biomass (t/ha) of pigeonpea and wheat as affected by conservation agriculture in the western Indo-Gangetic Plains
* See Table 1 and Materials and Methods section for treatment details.
Factorial analysis of variance of biomass (t/ha) of pigeonpea and wheat in 2011/12
Factorial analysis of variance of biomass (t/ha) of pigeonpea and wheat in 2012/13
System water-use efficiency
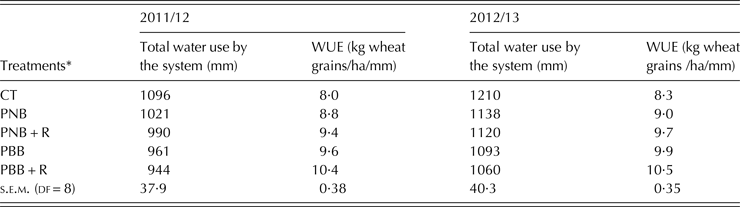
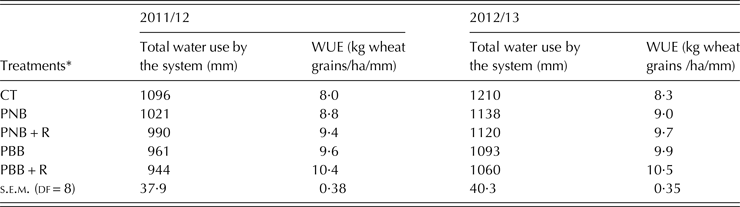
This parameter was not calculated for the first year. Total water use in the pigeonpea–wheat system in the last 2 years was highest in the CT plots, whereas PBB + R plots used the least water in both years (Table 6). The PBB + R plots had water savings of c. 16%, but had c. 30% higher WUE in the second year over CT plots (Table 6). Similarly, the plots under PBB + R had 27% higher WUE compared with CT plots during 2012/13. Despite all CA plots using similar amounts of water in the last 2 years, WUE data of some of these plots were significantly different to one another. For instance, in the second year, PBB + R plots had 9, 11 and 19% higher WUE than PBB, PNB + R and PNB plots, respectively (Table 6). However, in the third year, WUE data of PBB + R, PBB and PNB + R plots were similar, but PBB + R plots had 17% higher WUE than PNB plots (Table 6).
Impacts of conservation agriculture on system water-use efficiency (WUE) (kg wheat grains/ha/mm) under a pigeonpea–wheat system in the western Indo-Gangetic Plains
* See Table 1 and Materials and Methods section for treatment details.
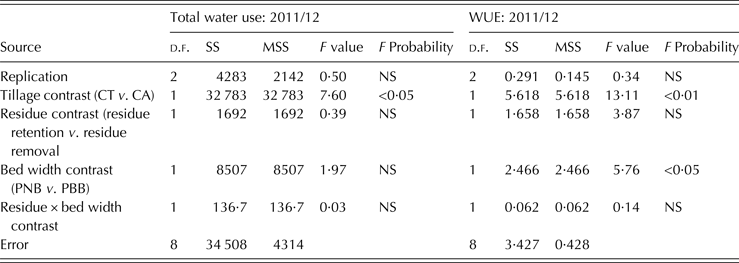
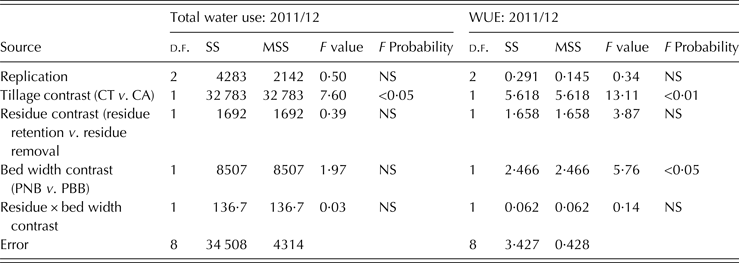
Factorial analysis of variance of total water use and water-use efficiency (WUE) by the pigeonpea–wheat system in 2011/12
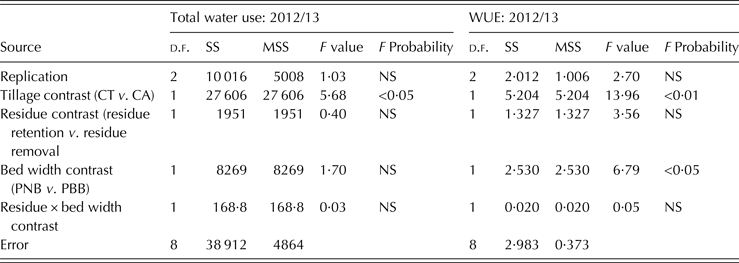
Factorial analysis of total water use and water-use efficiency (WUE) by the pigeonpea–wheat system in 2012/13
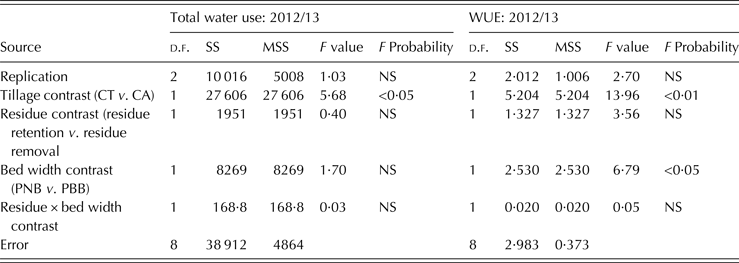
Contrast analysis showed that plots under all CA used 12 and 9% less water in the second and third years, respectively, than CT plots (Tables 6a and 6b ). However, other contrasts (PNB v. PBB, residue retention v. residue removal and interaction of bed width and residue management) were not significant in terms of water use in these years (Tables 6a and 6b ). As for water use, WUE values of CA plots were significantly (P < 0·01) higher than CT plots in both second and third years. Despite similar water use, PBB plots had significantly higher (P < 0·05) WUE values than PNB plots in both years. There was a trend for residue retention under permanent bed planting to increase the WUE values in both the second and third years over residue removal plots, but the differences were not statistically significant (Table 6). The interactions of bed width and residue management in both years were not-significant (Tables 6a and 6b ).
DISCUSSION
In partial accordance with the first hypothesis, ZT with permanent bed planting (broad beds) and residue retention (PBB + R treatment) resulted in larger pigeonpea productivity in the first and third years and higher wheat grain yield in the second year than CT plots. This finding is in agreement with Aquino (Reference Aquino1998), who reported 8% higher yield in wheat grown under bed planting compared with CT in Mexico. Naresh et al. (Reference Naresh, Rathore, Kumar, Singh, Singh and Shahi2014) also observed that wheat grain yield increased by c. 13·5% with raised bed planting compared with flat-bed planting in Meerut, western IGP, in a maize–wheat system. Despite PNB + R plots having higher pigeonpea grain yield than CT plots in the first and third years, wheat yields for these plots were similar. Productivity improvements in PNB/PBB plots with residue retention over CT plots could be due to compound effects of many factors such as addition of nutrients, low weed density, improved soil physical properties, improved water regimes, better water extraction and aeration compared with CT (Unger & Jones Reference Unger and Jones1998; Das et al. Reference Das, Bhattacharyya, Sudhishri, Sharma, Saharawat, Bandyopadhyay, Sepat, Bana, Aggarwal, Sharma, Bhatia, Singh, Datta, Kar, Singh, Singh, Pathak, Vyas and Jat2014). The pigeonpea grain yield increased over the years in all plots, including the PBB + R plots. Thus the impact of this treatment improved with advancing year of adoption. However, wheat yields under different treatments did not increase over the years. As in the present study, Sakala et al. (Reference Sakala, Cadisch and Giller2000) also observed that over time there could be additional yield benefits from the legume (due to N-accumulation through biological N2 fixation and leaf litter), but this did not benefit the wheat crop in subsequent years. In contrast, Das et al. (Reference Das, Bhattacharyya, Sudhishri, Sharma, Saharawat, Bandyopadhyay, Sepat, Bana, Aggarwal, Sharma, Bhatia, Singh, Datta, Kar, Singh, Singh, Pathak, Vyas and Jat2014) observed that a PBB + R management practice produced significantly higher (mean of 3 years) cotton and wheat productivity, respectively, than CT plots in the same area. Thus, the PBB + R management practice under the pigeonpea–wheat system was not as effective as it was under the cotton–wheat system in the same location.
Although there were six wheat rows within a 140 cm width under a narrow-bed plot (PNB or PNB + R) compared with five wheat rows within 140 cm width under a broad-bed plot (PBB or PBB + R), there were no significant differences in wheat grain yield due to the bed configurations (PNB v. PBB plots) in the first 2 years. However, surprisingly, in the third year, plots under PBB had 11% higher wheat grain yield than PNB plots. This was a result under broad beds, of wheat having an increased numbers of spikes per unit area than the plots with narrow beds (mean values of 310 spikes/m2 under PNB and PNB + R plots v. 347 spikes/m2 under PBB and PBB + R plots, in the third year). Again in PNB, there were six rows on 80 cm + 60 cm of furrows (43% of the total 140 cm width), whereas on PBB there were five rows on 100 cm + 40 cm furrow (29% of the total 140 cm width). Hence, there was more bed width hosting the five rows in PBB than the six rows in the PNB. This might have influenced wheat growth and yield favourably under PBB compared with PNB plots, yielding similar yield per unit area despite fewer rows.
It has been reported that during the initial years, crop yields can be reduced under PBB (Yadvinder-Singh et al. Reference Yadvinder-Singh, Bijay-Singh, Ladha, Khind, Khera and Bueno2004). However, the results of the current study indicate that pigeonpea grain yields of CA plots in the first year were not reduced, but rather increased. This could be due to a combination of better release of nutrients from soils under new beds and added residues. Despite plots under CA practices having higher pigeonpea grain yield in the first year than CT, both PBB and PBB + R plots had similar pigeonpea grain yield to CT plots in the second year and only PBB + R plots had higher pigeonpea grain yield than CT plots in the third year. Similarly, both PBB and PBB + R plots had similar wheat grain yield to CT plots even in the third year. In agreement with the current results, Thierfelder & Wall (Reference Thierfelder and Wall2012) observed that the first significant differences in wheat yields were observed after five cropping seasons under CA and continued from there on. So, CA benefits are, in general, not instant and there is some lag phase until the benefits materialize. The lack of immediate yield benefits of CA (as observed for wheat in the current study) has also been highlighted by Giller et al. (Reference Giller, Witter, Corbeels and Tittonell2009) and Gilbert (Reference Gilbert2012) as a major bottleneck for the widespread uptake of CA in many parts of the world, including Southern Africa. However, farmers do not evaluate their cropping systems based only on the grain yield. Other advantages of CA such as reductions in labour (i.e., for land preparation and weeding) as reported by Malawi (Ngwira et al. Reference Ngwira, Thierfelder and Lambert2013) and also observed in the current work, coupled with less water use and no reduction in crop yields of the initial year (rather increased pigeonpea yield) can facilitate faster adoption of CA under many cropping systems.
Contrast analyses showed that apart from the wheat yield in the third year, pigeonpea grain yield was not affected due to residue retention. This finding is in agreement with Sayre & Hobbs (Reference Sayre, Hobbs, Lal, Hobbs, Uphoff and O. Hansen2004), who reported that in the initial years of establishment of permanent bed planting, crop yields can be reduced due to the net N immobilization by microorganisms during residue decomposition. This phenomenon calls for detailed investigation on the N availability and soil health (including soil temperature, aeration, soil aggregation, porosity and pore size distribution including root growth) in the pigeonpea–wheat system under CA in this region.
Results of the present study also revealed that the CT plots consumed c. 100 mm more water than the mean water consumption by PNB and PBB plots in 2 years. Similarly, water use by CT plots was much higher than CA plots in both years of investigation. This was due to the fact that the furrows act as pathways for drainage during excessive rains and conserve rainwater in dry spells (Astatke et al. Reference Astatke, Jabbar, Mohamed Saleem and Erkossa2002). Water use efficiency improved with CA as it allowed for earlier planting, reduced soil evaporation, eased weed management, and increased access to nutrients (Siddique et al. Reference Siddique, Johansen, Turner, Jeuffroy, Hashem, Sakar, Gan and Alghamdi2012). The significantly higher WUE in all CA plots compared with CT plots is also due to a decrease in water use (by 8·4%) under CA compared with the CT plots. Das et al. (Reference Das, Bhattacharyya, Sudhishri, Sharma, Saharawat, Bandyopadhyay, Sepat, Bana, Aggarwal, Sharma, Bhatia, Singh, Datta, Kar, Singh, Singh, Pathak, Vyas and Jat2014) also reported that in the cotton–wheat system, the best treatment, PBB + R, had 14% lower water requirement. In the present study, PBB plots had 30% higher WUE (mean of 2 years) than CT plots. Similarly to the current work, Kumar et al. (Reference Kumar, Singh, Hooda, Khippal and Singh2003) reported that permanent raised bed system saved irrigation water and increased irrigation WUE compared with conventional flat system by 41% in wheat. From a study at New Delhi (India), Aggarwal & Goswami (Reference Aggarwal and Goswami2003) also reported that grain yields of wheat were similar under raised beds and conventional flat systems, but WUE was ~18·5% higher with raised beds. Significantly higher system WUE data under PBB plots compared with PNB plots were very interesting and the reason could be that PBB plots had non-significant but higher crop yields and less water use in both study years than PNB plots. Detailed studies of radiation use efficiency, evaporation and root water uptake may give more insights on these differences.
Contrast analyses also delineated that the WUE values in last 2 years with residue retention were higher (but not significantly) than the residue removal treatments. This was mainly attributed to combined effects of numerically less irrigation water applied with residue retention than residue removal, non-significant but higher grain yields of both crops with residue retention compared with residue removal and the impacts of residues in soil moisture conservation. It should be noted that during the three study years, bed planting + residue retained plots received >85% higher residue load than only bed planting plots. Munkholm et al. (Reference Munkholm, Hansen and Olesen2008) also observed that ZT with residue removal often leads to poorer soil structural quality (more compact), yield and WUE reduction compared with ZT with residue retention. However, the current authors found little information on CA (ZT and residue retention) impacts on WUE under a pigeonpea–wheat system. Several studies under a rice–wheat cropping system have shown that mulching in wheat had a positive effect on soil water conservation under CA and the effect was more pronounced in dry periods (Sidhu et al. Reference Sidhu, Manpreet-Singh, Humphreys, Yadvinder-Singh, Balwinder-Singh, Dhillon, Blackwell, Bector, Malkeet-Singh and Sarbjeet-Singh2007; Chakraborty et al. Reference Chakraborty, Garg, Tomar, Singh, Sharma, Singh, Trivedi, Mittal, Sharma and Kamble2010; Verhulst et al. Reference Verhulst, Sayre, Vargas, Crossa, Deckers, Raes and Govaerts2011). Chakraborty et al. (Reference Chakraborty, Garg, Tomar, Singh, Sharma, Singh, Trivedi, Mittal, Sharma and Kamble2010) demonstrated that rice straw mulch increased mean wheat grain yield in this region by 17·1%, reduced crop water use by 3–5% and improved WUE by 38·3% compared with no mulch; they also observed that mulch produced 25% higher root length and 40% higher root length densities compared with no mulch in lower layers (>15 cm), probably due to greater soil moisture retention.
CONCLUSION
The plots under PBB with residue retention (PBB + R) showed higher pigeonpea grain yields in the first and third years and wheat grain yields in the second year than the plots with CT (farmers’ practice). All CA plots had higher pigeonpea grain and biomass yields compared with CT plots in the first year. That PBB + R plots also had significantly higher WUEs than the CT plots in the last 2 years. Moreover, the PBB + R plots had significantly higher WUE than PNB + R and PNB plots. In fact, all CA plots had significantly higher WUE than CT plots in both years. Both pigeonpea and wheat grain yields, biomass productivities and WUE due to residue retention and removal were similar. But WUE for permanent bed planting + residue retention plots were significantly higher than residue removal (permanent bed planting only) plots. Despite plots with PBB having similar water use and crop productivities to PNB plots, WUE values of the former treatment were significantly higher than PNB-treated plots. However, bed width × residue management interactions for all parameters were not significant. These results are of tremendous importance and are very novel in South Asia. Thus, either PBB or PBB + R management practice may be adopted by farmers (depending upon their resources) for improving productivity and WUE under this cropping system. However, the long-term impact (in terms of productivity and ecology) of PBB and PBB + R management practices is a key future research issue.
The authors gratefully acknowledge the contributions of the Indian Agricultural Research Institute (IARI), New Delhi for approving this research project (Challenge Programme on Conservation Agriculture) and providing necessary services and supplies during the course of investigation. The concerned Divisions of IARI, New Delhi, contributing towards successful conduct of this project are also duly acknowledged. Besides, the initial support received from the International Maize and Wheat Improvement Centre (CIMMYT), through WHEAT CRP is gratefully acknowledged.