1. Introduction
When a shock wave impinges upon an interface separating two fluids of different property, initial perturbations at the interface first grow linearly, then nonlinearly over time. In the nonlinear regime, the interface undergoes significant distortion, characterised by the formation of spikes (heavy fluid penetrating into light fluid) and bubbles (light fluid rising into heavy fluid), which could potentially lead to a transition to turbulent mixing. This type of hydrodynamic instability is usually referred to as the Richtmyer–Meshkov instability (RMI) (Richtmyer Reference Richtmyer1960; Meshkov Reference Meshkov1969). A similar yet distinct instability is the Rayleigh–Taylor instability (RTI), which occurs as the interface is subjected to continuous acceleration. The RMI exists widely in scientific and industrial fields with scales spanning from millimetre (e.g. inertial confinement fusion, ICF) (Murakami & Nishi Reference Murakami and Nishi2017; Li, Samtaney & Wheatley Reference Li, Samtaney and Wheatley2018) to light year (e.g. supernova explosions) (Kuranz et al. Reference Kuranz2018). For example, in ICF, instability growth at both the exterior ablator–shell interface and the interior shell–fuel interface (Li et al. Reference Li, Yan, Zhao, Zheng, Zhang and Lu2022b ; Samulski et al. Reference Samulski, Srinivasan, Manuel, Masti, Sauppe and Kline2022) dramatically enhances the mixing between the inner fuel and the outer ablator, leading to a reduction in energy yield or even ignition failure (Lindl et al. Reference Lindl, Landen, Edwards, Moses and Team2014). However, in scramjets, the mixing of fuel and air, enhanced by RMI, is beneficial for improving combustion efficiency (Urzay Reference Urzay2018).
As a fundamental problem, RMI at a single-mode interface under single shock impact has attracted much attention, and comprehensive reviews have been published on this topic (Zabusky Reference Zabusky1999; Brouillette Reference Brouillette2002; Ranjan, Oakley & Bonazza Reference Ranjan, Oakley and Bonazza2011; Zhou Reference Zhou2017a ,Reference Zhoub). In previous studies, the growth of instability across the linear, nonlinear and turbulent mixing stages has been extensively investigated through experiments (Jacobs et al. Reference Jacobs, Jenkins, Klein and Benjamin1995; Sadot et al. Reference Sadot, Erez, Alon, Oron, Levin, Erez, Ben-Dor and Shvarts1998; Jacobs & Krivets Reference Jacobs and Krivets2005; Aure & Jacobs Reference Aure and Jacobs2008; Balakumar et al. Reference Balakumar, Orlicz, Tomkins and Prestridge2008b ; Morgan et al. Reference Morgan, Aure, Stockero, Greenough, Cabot, Likhachev and Jacobs2012; Mansoor et al. Reference Mansoor, Dalton, Martinez, Desjardins, Charonko and Prestridge2020), simulations (Cloutman & Wehner Reference Cloutman and Wehner1992; Youngs Reference Youngs1994; Latini, Schilling & Don Reference Latini, Schilling and Don2007; Youngs & Williams Reference Youngs and Williams2008) and theoretical analyses (Zhang & Sohn Reference Zhang and Sohn1997; Mikaelian Reference Mikaelian2005; Dimonte & Ramaprabhu Reference Dimonte and Ramaprabhu2010; Zhang, Deng & Guo Reference Zhang, Deng and Guo2018). By modelling the shock impact as an impulsive acceleration (i.e. a Dirac delta function), Richtmyer (Reference Richtmyer1960) developed an impulsive model that provides a simplified yet useful prediction of early-time perturbation growth for single-mode RMI. As nonlinear effects become significant, new harmonics are generated, which feed back into the fundamental mode and gradually reduce its growth rate. To describe nonlinear growth, various theoretical models have been proposed, including perturbation expansion models (Zhang & Sohn Reference Zhang and Sohn1997; Vandenboomgaerde et al. Reference Vandenboomgaerde, Gauthier and Mügler2002Reference Vandenboomgaerde, Cherfils, Galmiche, Gauthier and Raviart2003; Zhang et al. Reference Zhang, Deng and Guo2018), potential flow models (Alon et al. Reference Alon, Hecht, Ofer and Shvarts1995; Sohn Reference Sohn2003; Zhang & Guo Reference Zhang and Guo2016), vortex models (Samtaney & Zabusky Reference Samtaney and Zabusky1994; Jacobs & Sheeley Reference Jacobs and Sheeley1996; Samtaney, Ray & Zabusky Reference Samtaney, Ray and Zabusky1998; Sohn Reference Sohn2011) and empirical models (Dimonte & Ramaprabhu Reference Dimonte and Ramaprabhu2010). However, these linear and nonlinear models are limited to single-mode RMI driven by a single shock.
In practical applications, material interfaces typically exhibit multi-mode or random perturbations. Unlike single-mode RMI, the multi-mode case introduces additional complexities, including mode-coupling effects such as harmonic generation and bubble merging, leading to significantly more intricate flow phenomena (Luo et al. Reference Luo, Liu, Liang, Ding and Wen2020). These complexities exceed the applicability of existing models developed for single-mode RMI. Furthermore, in real-world scenarios, the incident shock wave, after interacting with a perturbed interface, may reflect from either a geometric centre or a solid wall, subsequently re-impacting the interface. To date, only a preliminary understanding of reshocked RMI mechanisms has been achieved through a limited number of experimental and numerical studies. For small-amplitude single-mode interfaces, shock-tube experiments by Weber et al. (Reference Weber, Haehn, Oakley, Anderson and Bonazza2012) and Zhang et al. (Reference Zhang, Zhao, Ding and Luo2023b ) demonstrated a strong dependence of the post-reshock growth rate on pre-reshock conditions, including interface morphology and growth rate. Similarly, Guo et al.’s (Reference Guo, Si, Zhai and Luo2022b ) experiments with large-amplitude single-mode interfaces confirmed this significant dependence. In contrast, studies on reshocked RMI at random multi-mode interfaces, such as those by Vetter & Sturtevant (Reference Vetter and Sturtevant1995) and Leinov et al. (Reference Leinov, Malamud, Elbaz, Levin, Ben-Dor, Shvarts and Sadot2009), revealed that the post-reshock growth rate is independent of the pre-reshock interface shape and growth rate. This behaviour is particularly challenging to reconcile with the widely accepted view that RMI evolution is highly sensitive to initial conditions prior to shock impact. Recent experiments have further revealed complex behaviours in reshocked RMI at multi-mode interfaces. Ferguson & Jacobs (Reference Ferguson and Jacobs2024) investigated the interaction of successive shocks with a multi-mode interface, highlighting the significant influence of shock-to-reshock time on the large-scale Reynolds number. Sewell et al. (Reference Sewell, Ferguson, Krivets and Jacobs2021) examined the growth rates of randomly perturbed multi-mode interfaces subjected to a reflected shock, finding different growth exponents for small- and large-amplitude perturbations. By using Faraday waves to create a three-dimensional random interface, Jacobs, Krivets & Tsiklashvili (Reference Jacobs, Krivets and Tsiklashvili2013) identified two distinct power-law regimes before reshock, followed by a consistent linear growth after reshock. Balakumar et al. (Reference Balakumar, Orlicz, Tomkins and Prestridge2008a ) investigated light–heavy–light gas curtains subjected to incident and reflected shocks, observing significant increases in mixing width and mixing level immediately after reshock. Balasubramanian et al. (Reference Balasubramanian, Orlicz, Prestridge and Balakumar2012) used a movable end wall to control reshock timing, finding that high-wavenumber perturbations accelerate turbulence onset. A subsequent study by Balakumar et al. (Reference Balakumar, Orlicz, Ristorcelli, Balasubramanian, Prestridge and Tomkins2012) quantified the post-reshock velocity and density statistics. Also, Mohaghar et al. (Reference Mohaghar, Carter, Musci, Reilly, McFarland and Ranjan2017Reference Mohaghar, Carter, Pathikonda and Ranjan2019) explored reshock-induced RMI at single- and multi-mode interfaces, focusing on the effects of initial conditions, Mach number and interface morphology on turbulent transition. More recently, Noble et al. (Reference Noble, Ames, McConnell, Oakley, Rothamer and Bonazza2023) examined the evolution of turbulent kinetic energy and scalar spectra after reshock, demonstrating that scalar spectra adhere to a scaling consistent with the Gibson relation (Gibson Reference Gibson1968). In multi-mode RMI, nonlinear effects are more pronounced, adding further complexity to theoretical analysis. Under reshock conditions, the interplay between nonlinearity and reshock effects creates even more intricate flow regimes. As a result, the underlying mechanisms of multi-mode RMI under reshock remain poorly understood, highlighting the need for further investigation and motivating the present study.
Several empirical models have been developed to predict the perturbation growth rate following reshock. A simple linear superposition model, proposed by Mikaelian (Reference Mikaelian1985), sums the growth rates induced by both the incident and reflected shocks. This model suggests that the post-reshock growth rate is influenced by both the pre-reshock growth rate and the interface shape. Similarly, numerical studies by Charakhch’An (Reference Charakhch’An2000) confirmed a strong correlation between the post-reshock growth rate and the pre-reshock growth rate, although the dependence on the pre-reshock interface shape was found to be weak. Based on these findings, Charakhch’An (Reference Charakhch’An2000) proposed an empirical model applicable under specific conditions outlined in their study. In contrast, Mikaelian (Reference Mikaelian1989) observed that for reshocked RMI at initially three-dimensional multi-mode interfaces, the post-reshock growth rate can be independent of both the pre-reshock interface shape and growth rate. This underscores the existence of more complex relationships between the post-reshock growth rate and pre-reshock variables under certain conditions. Currently, a unified model capable of explaining these diverse observations is lacking, further motivating the present study.
In this work, we will investigate reshocked RMI through high-fidelity shock-tube experiments using interfaces with precisely controlled perturbation spectra, including single-, dual- and triple-mode configurations. These experiments reveal both the perturbation growth patterns and their dependence on initial conditions. Building on these observations, we develop a theoretical model that incorporates mode-coupling effects to predict post-reshock perturbation growth. Furthermore, by deriving a theoretical formula that links the empirical coefficient in Charakhch’An’s (Reference Charakhch’An2000) model to the characteristics of the initial perturbations, we provide a unified framework to explain the varying sensitivity of post-reshock growth rates to pre-reshock morphology observed in prior experiments.
Schematic diagrams showing (a) the formation of the initial interface and (b) the generation of the reflected shock.

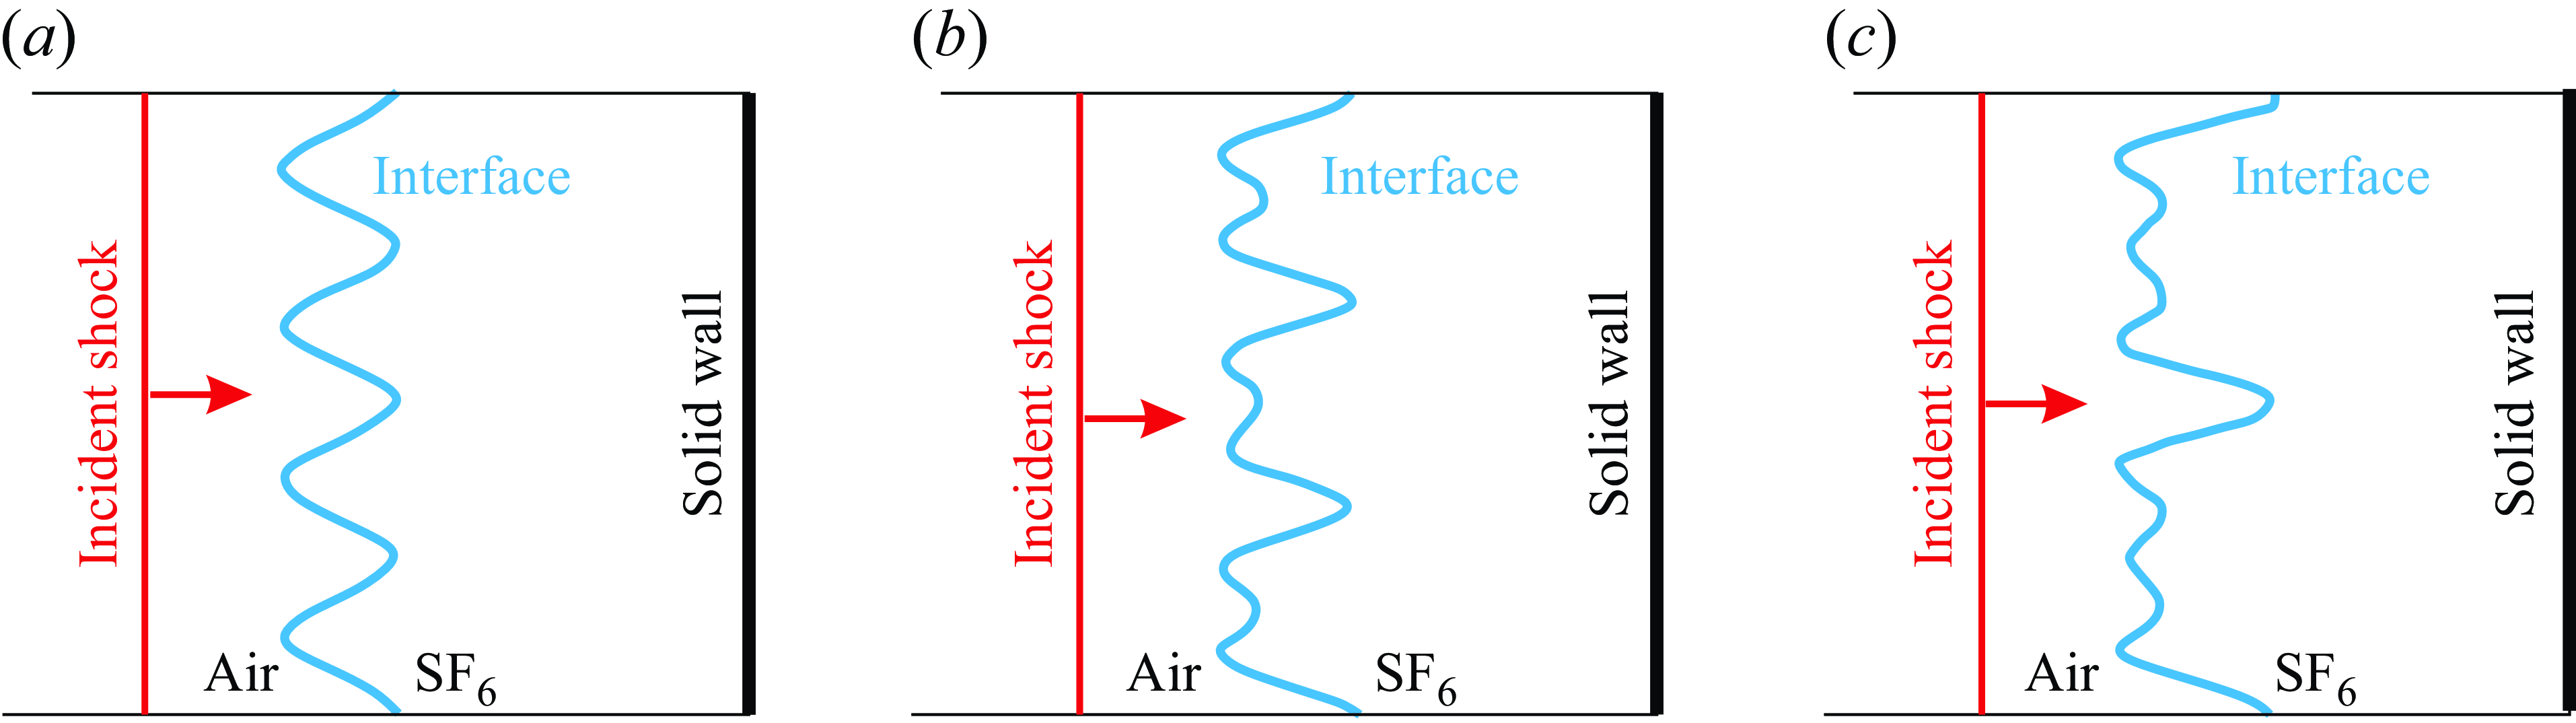
Sketches of the experimental set-up for the reshocked RMI at (a) a single-mode interface, (b) a dual-mode interface and (c) a triple-mode interface.

2. Experimental methods
The experiments are carried out in a horizontal shock tube consisting of three sections: a 1700.0 mm long driver section, a 3900.0 mm long driven section and a 1000.0 mm long test section. The test section has a cross-sectional area of 120.0
 $\times$
6.0 mm
 $^2$
. A soap-film technique developed by Liu et al. (Reference Liu, Liang, Ding, Liu and Luo2018) is adopted to generate well-characterised discontinuous interfaces that are free of short-wavelength perturbations, three-dimensional effects and diffusion layers. As depicted in figure 1(a), two transparent devices, each with an inner height of 6.0 mm and a width of 120.0 mm, are fabricated using 5.0 mm thick acrylic plates. Their adjacent boundaries are engraved carefully to present a desired shape. Two thin filaments, matching the shape of these boundaries, are attached to the upper and lower surfaces of device II, acting as constraints. The protruding height of the filaments into the test section is approximately 0.2 mm, producing a negligible influence on the flow. To facilitate interface formation, the filaments are pre-wetted with a small amount of soap solution composed of 60 % distilled water, 20 % sodium oleate and 20 % glycerine. As a small rectangular frame, dipped with moderate soap solution, is pulled along the upper and lower filaments, a soap film is immediately formed that mirrors the shape of the filaments. To create an air/SF
 $_6$
interface, SF
 $_6$
gas is injected into device II through an inflow hole, while air is exhausted through an outflow hole. To ensure efficient venting of air and also to minimise the influence of the holes on the flow, the radii of the outflow and inflow holes are set to be 1.0 and 0.5 mm, respectively. In experiment, an oxygen concentration detector is placed at the exit of the outflow hole to continuously monitor the oxygen volume fraction in the exhausted gas. Once the measured volume fraction meets the experimental criterion (below 2 %), devices II and I are inserted successively into the test section to initiate the experiment. Note that the small height of the test section helps to significantly reduce three-dimensionality of the initial interface.
An acrylic block is placed inside device II to facilitate the formation of a reflected shock, as depicted in figure 1(b). When an incident shock passes across the gas interface and strikes the inserted block, a reflected shock wave is immediately generated. This reflected shock then propagates upstream, re-accelerating the gas interface in the direction opposite to that of the incident shock. As illustrated in figure 2, in a Cartesian coordinate system, the single-, dual- triple-mode interfaces can be described by
 \begin{equation} y=\sum _{i=1}^n a_{i}^0 \cos(i k x+\phi _i),\quad (n=1,2,3), \end{equation}
where
 $k$
is the wavenumber of the first mode (
 $k=2\pi /\lambda$
, with
 $\lambda$
being the wavelength, which varies across different cases),
 $a^0_{i}$
(
 $i=1$
, 2, 3) denotes the initial amplitude of the
 $i$
th mode with wavenumber
 $ik$
. In this work, we set
 $a^0_{i}= 1.0$
mm for all constituent modes. In the present experiment, the time when the reflected shock encounters the interface is precisely controlled by adjusting the distance between the block and the initial interface. The incident shock propagates in air at a Mach number of 1.30
 $\pm$
0.02. The ambient pressure and temperature are 101.3 kPa and 293.8
 $\pm$
2.8 K, respectively. These carefully controlled initial conditions ensure high reproducibility of the experimental results. The flow, illuminated by a DC-regulated light source (DCR III, SCHOTT North America, Inc.), is captured using a high-speed video camera (FASTCAM SA5, Photron Limited) equipped with schlieren photography. The high-speed camera operates at a frame rate of 60 000 f.p.s. with a shutter time of 1
 $\unicode {x03BC}$
s.
Since the incident shock is weak, during most of the experimental period, the post-shock flow can be treated as incompressible (particular after the shock wave departs from the interface) and laminar (except during the later stages following reshock). Consequently, the thickness of the boundary layer in the post-shock flow (Kundu, Cohen & Dowling Reference Kundu, Cohen and Dowling2012) can be estimated as follows:
 \begin{equation} \delta ^*=1.72\sqrt {\frac {\mu x}{\rho \Delta V}}, \end{equation}
where
 $x \approx 120.0$
mm represents the maximum distance travelled by the interface during the experimental period. Under the experimental temperature and pressure conditions, the viscosity coefficient and the density of air (SF
 $_6$
) are
 $\mu = 1.83 \times 10^{-5}$
Pa
 $\cdot$
s (
 $=1.60\,{\times}10^{-5}$
Pa s) and
 $\rho= 1.204\,\textrm{kg m}^{-3}$
(
 $=6.143$
kg m
 $^{-3}$
), respectively. The velocity of the post-shock flow is
 $\Delta V=106.2\,\textrm{m s}^{-1}$
. According to (2.2), the maximum thickness of the boundary layer in the post-shock air (SF
 $_6$
) flow is calculated to be approximately 0.23 mm (0.09 mm). This value is much smaller than the inner height of the test section (6.0 mm), indicating that the boundary layer has a negligible influence on the interface development during the experimental period. Note that the post-shock flow Mach number in air (reflection side) and SF
 $_6$
(transmission side) are 0.27 an 0.73, respectively. While the Mach number in SF
 $_6$
exceeds the conventional incompressible threshold, the interface evolves smoothly without signs of compressibility-related effects. Moreover, previous experiments on RMI at classical single-mode air/SF
 $_6$
interfaces under similar initial conditions (Liu et al. Reference Liu, Liang, Ding, Liu and Luo2018) demonstrated excellent agreement with predictions from incompressible models, further supporting this approximation. Also, previous numerical studies (Ding et al. Reference Ding, Si, Chen, Zhai, Lu and Luo2017a
; Li et al. Reference Li, Ding, Luo and Zou2022a
) have successfully reproduced experimental results using inviscid Euler solvers, suggesting that boundary-layer effects are not dominant within the temporal and spatial scales of interest. Nevertheless, after the passage of the reflected shock, the boundary layer may become more chaotic or even transition to turbulence. One noticeable effect is an increased interface thickness following reshock. The interaction between reflected shock waves and boundary layers generates additional vorticity that would influence instability growth, particularly during the reshock phase (Balakumar et al. Reference Balakumar, Orlicz, Tomkins and Prestridge2008; Mohaghar et al. Reference Mohaghar, Carter, Pathikonda and Ranjan2019; Ferguson & Jacobs Reference Ferguson and Jacobs2024
b). A more complete understanding of reshocked RMI requires a quantitative comparison between vorticity deposited by boundary-layer interaction and that arising from shock-interface interaction. Such analysis necessitates advanced diagnostics, such as particle image velocimetry (PIV) applied perpendicular to the current field of view, as demonstrated in recent work by Ferguson & Jacobs (Reference Ferguson and Jacobs2024), who highlighted its strong potential in capturing boundary-layer-induced vorticity. However, in our experiments, the application of PIV has proven challenging due to intense light scattering from residual soap-film droplets, yielding unreliable velocity data. Nevertheless, schlieren images still reveal that vorticity generated by shock–boundary-layer interaction enhances flow three-dimensionality, as evidenced by significant interface thickening observed after reshock. Since our current analysis focuses on evolution of the largest flow structures (i.e. the interface width) during the short period following reshock, we believe the influence of additional vorticity is limited. To mitigate boundary-layer influences in our current analysis, the post-shock amplitude is measured at the centre of the interface region, between the tips of spike and bubble, which minimises sensitivity to boundary-layer-induced vertical distortions. To overcome current limitations in flow diagnostics, we are developing a membrane-free interface generation technique using an automatically retractable plate. By eliminating soap droplets and uncontrolled diffusion layers, this method enables the formation of a sharp, membraneless interface with controllable long-wavelength perturbations. It has recently been successfully applied to planar laser-induced fluorescence measurements in converging shock-driven turbulence (Zhao et al. Reference Zhao, Ding, He, Zhou and Luo2025). In the near future, we aim to extend the technique to PIV measurements to directly quantify wall-induced vorticity.
The mass fraction of SF
 $_6$
on the right side of the interface is estimated using the following method. As a planar shock collides with a flat light/heavy interface, the resulting flow is composed of four uniform regions delineated by a reflected shock, a transmitted shock and the interface. According to one-dimensional gas dynamics theory, we can establish definite relations between the flow parameters on both sides of the reflected and transmitted shocks. Additionally, a compatibility condition exists across the interface, ensuring the continuity of velocity and pressure. Using these relationships, the following equation can be derived:
 \begin{equation} \left [\frac {\left (\Lambda _2-1\right ) \rho _1}{\left (\Lambda _1-1\right ) \rho _2}\right ]^{1 / 2} \frac {P_t-1}{\left (P_t \Lambda _2+1\right )^{1 / 2}}=\frac {P_i-1}{\left (P_i \Lambda _1+1\right )^{1 / 2}}-\left (\frac {\rho _1}{\rho _1^{\prime }}\right )^{1 / 2} \frac {P_t-P_i}{\left (P_t \Lambda _1+P_i\right )^{1 / 2}}, \end{equation}
where
 \begin{equation} \left .\begin{array}{c} \Lambda _1=(\gamma _1+1)/(\gamma _1-1)\\[2 mm] \Lambda _2=(\gamma _2+1)/(\gamma _2-1)\\[2 mm] P_i=1+2\gamma _1/(\gamma _1+1)\left (M_i^2-1\right )\\[2 mm] \rho _1/\rho _1^{\prime }=\left[(\gamma _1-1) M_i^2+2\right]/\left[(\gamma _1+1) M_i^2\right] \end{array}\right \rbrace . \end{equation}
Here,
 $\gamma _1$
and
 $\rho _1$
represent the specific heat ratio and density on the side of the interface where the incident shock is initially located, while
 $\gamma _2$
and
 $\rho _2$
denote the specific heat ratio and the density on the other side,
 $P_i$
(
 $P_t$
) refers to the pressure ratio across the incident shock (transmitted shock),
 $\rho _1^{\prime }$
to the fluid density behind the incident shock and
 $M_i$
to the Mach number of the incident shock. In experiment, the gas on the left side of the interface is pure air. The velocity of the incident shock is measured to be 446.6
 $\pm$
7.8 m s−1, corresponding to
 $M_i$
= 1.30
 $\pm$
0.02. Given the measured speeds of the incident and transmitted shocks, the mass fraction of SF
 $_6$
can be calculated using an iterative method. Specifically, specifying an arbitrary initial value between 0 and 1 for the mass fraction of SF
 $_6$
on the right side of the interface, the flow parameters on that side (such as
 $\rho _2$
and
 $\gamma _2$
) can be determined. Substituting these parameters into (2.3), the pressure ratio across the transmitted shock (
 $P_t$
) can be solved, providing the strength of the transmitted shock. If the calculated Mach number of the transmitted shock exceeds the measured value, the mass fraction is slightly reduced; conversely, if the calculated Mach number is lower, the mass fraction is increased. This iterative process continues until the calculated Mach number closely matches the measured one, with a difference of less than 0.1 %. The accuracy of this concentration calculation method has been thoroughly validated in recent studies (Zhang et al. Reference Zhang, Ding, Si and Luo2023a
,Reference Zhang, Zhao, Ding and Luob). It is worth noting that the shock impact can cause the soap film to atomise into small droplets, which are subsequently entrained in the flow. The relationship between the size of the soap droplets and the incident shock strength has been investigated by Cohen (Reference Cohen1991) and Ranjan et al. (Reference Ranjan2008). According to their work, the mean radius of the soap droplets is estimated to be approximately 30
 $\unicode {x03BC}$
m for the shock wave of Ma
 $\sim$
1.3 in the present experiments. These micron-sized droplets absorb negligible energy from the shock wave and exert minimal influence on the interface evolution. A series of previous studies (Ranjan et al. Reference Ranjan, Oakley and Bonazza2011; Wang, Si & Luo Reference Wang, Si and Luo2013; Ding et al. Reference Ding, Si, Chen, Zhai, Lu and Luo2017a
,Reference Ding, Si, Yang, Lu, Zhai and Luo
b
; Liu et al. Reference Liu, Liang, Ding, Liu and Luo2018) on RMI adopting such a soap-film technique have reported good agreement with theoretical and numerical results, confirming the negligible influence of soap droplets during the experimental time scale.
3. The RMI at a single-mode interface with reshock
As a basic problem, the reshocked RMI at a single-mode interface is first investigated. To explore the dependence of instability growth on initial conditions, both the amplitude of the initial interface and the reflection distance (defined as the distance between the initial interface and the inserted block) are varied. In this study, two reflection distances are considered: 40 and 80 mm, referred to as the short (
 $S$
) and long (
 $L$
) reflection distances, respectively. Detailed parameters corresponding to the initial conditions for each case are listed in table 1. The notation for each case comprises three components: the first indicates the total number of constituent modes, the second specifies the wavelength and the third denotes the reflection distance. For example, in case M1-60-
 $S$
, the initial perturbation consists of a single mode (M1) with a wavelength of 60 mm, and the reflection distance is short (40 mm). Note in case M1-60-
 $L^+$
, a significantly larger reflection distance of 160 mm is used to ensure that the interface reaches the nonlinear stage by the time the reshock occurs.
Detailed parameters corresponding to the initial conditions for each case. Here,
 $L$
refers to the distance between the interface and the end wall,
 $\lambda$
to the wavelength,
 $ka^-_{r}$
to the product of the wavenumber and pre-reshock amplitude, Vfra(SF
 $_6$
) to the volume fraction of SF
 $_6$
on the right side of the interface,
 $\Delta V_2$
to the interface velocity jump caused by reshock,
 $A^+$
and
 $A_r^+$
to the post-shock and post-reshock Atwood numbers, respectively,
 ${\textrm{d}a_1}/{\textrm{d}t}$
and
 ${\textrm {d}a_2}/{\textrm{d}t}$
stand for the pre-reshock and post-reshock growth rates, respectively,
 $V_s^{{lin}}$
is the linear growth rate predicted by (3.2) and
 $V^{{lin}}$
is post-reshock growth rate calculated with (3.3).

Sequences of schlieren images illustrating the instability growth for various single-mode cases: IS, incident shock; II, initial interface; SI, shocked interface; TS
 $_1$
, the first transmitted shock; TS
 $_2$
, the second transmitted shock; RTS, reflected transmitted shock; RW
 $_1$
, the first rarefaction wave. The numbers are in
 $\unicode {x03BC}$
s.

Sequences of schlieren images illustrating the evolutions of wave pattern and interface morphology for typical cases are displayed in figure 3. Here, we take case M1-40-
 $L$
as an example to detail the evolution process. In this work, the time origin is defined as the moment when the incident shock reaches the mean position of the initial perturbed interface (i.e. the position of an unperturbed interface). At the beginning (−13
 $\unicode {x03BC}$
s), an incident shock (IS), together with an initial interface (II), is clearly discerned. After the IS passes across the II, it splits immediately into an upstream-moving reflected shock (RS
 $_1$
) and a downstream-moving transmitted shock (TS
 $_1$
). Afterwards, the shocked interface (SI) moves downstream, presenting a clear and distinct single-mode shape (47
 $\unicode {x03BC}$
s). This confirms the reliability of the present experimental methods. Meanwhile, the interface amplitude continues to increase over time, driven by the baroclinic vorticity deposited at the interface during the shock-interface interaction. Later, nonlinearity becomes pronounced and new harmonics are generated, causing the interface to deviate from a sinusoidal shape. Subsequently, the transmitted shock TS
 $_1$
propagates forward and collides with the inserted block, generating a reflected transmitted shock (RTS, 567
 $\unicode{x03BC}$
s). At 627
 $\unicode {x03BC}$
s, the RTS interacts with the deforming interface, bifurcating into a second transmitted shock (TS
 $_2$
) and a reflected rarefaction wave (RW
 $_1$
). Following this interaction, the interface amplitude suffers a quick decay to zero by 727
 $\unicode {x03BC}$
s, a phenomenon known as phase inversion, and subsequently increases with an opposite phase. As time proceeds, the rarefaction wave RW
 $_1$
propagates toward the end wall of the shock tube. Upon reaching the wall, this wave returns as a secondary rarefaction wave, which subsequently re-accelerates the interface. The resulting wave pattern continues to reflect back and forth between the wall and the interface, thereby influencing the instability evolution. To address this concern, we have plotted
 $x$
–
 $t$
diagrams to show the evolution of the interface and wave patterns under different reflection distances, as shown in figure 4. It is clearly shown that increasing the distance between the interface and the end wall leads to a longer interface evolution period prior to the arrival of the reflected rarefaction wave (denoted as RRW
 $_1$
). It is important to note that the post-reshock growth rates reported hereinafter are extracted from the interface evolution before the reflected rarefaction wave arrives. Therefore, the observed growth behaviour can be attributed solely to reshock effects and is not influenced by subsequent wave reflections.
An
 $x$
–
 $t$
diagram showing the trajectories of the interface and waves for different reflection distances (a) 40 mm, (b) 80 mm and (c) 160 mm.

Previous studies have shown that, following reshock, the interface amplitude increases with time in a quasi-linear manner. Recent experiments by Zhang et al. (Reference Zhang, Zhao, Ding and Luo2023b ) demonstrated that the linear superposition model, originally proposed by Mikaelian (Reference Mikaelian1985), can effectively predict the post-reshock growth rate, provided that the instability evolution remains within the linear regime prior to reshock. The model is expressed as
 \begin{equation} \frac {\textrm { d}a_2}{\textrm { d}t}=k a_{r}^+ A_r^+\Delta V_2 -\frac {\textrm { d}a_1}{\textrm { d}t}, \end{equation}
where
 $a_{r}^+$
refers to the post-reshock amplitude of the interface,
 $\Delta V_2$
to the velocity jump of the interface caused by reshock and
 $A_r^+$
to the post-reshock Atwood number. The subscripts
 $1$
and
 $2$
denote the stages before and after reshock, respectively. The original model of Mikaelian (Reference Mikaelian1985) is applicable only to light/heavy interfaces. To extend its applicability to heavy/light interfaces, based on the work of Vandenboomgaerde, Mügler & Gauthier (Reference Vandenboomgaerde, Mügler and Gauthier1998) and Zhang et al. (Reference Zhang, Zhao, Ding and Luo2023b
) proposed a modified version
 \begin{equation} \frac {\textrm { d}a_2}{\textrm { d}t}=k\Delta V_2\left( \frac {A_r^+ a_{r}^+ +A_r^- a_{r}^-}{2} \right)-\frac {\textrm { d}a_1}{\textrm { d}t}, \end{equation}
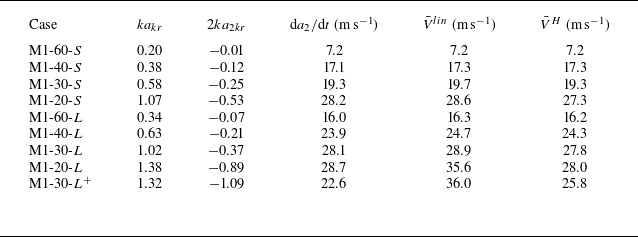
where the superscripts ‘−’ and ‘+’ denote the moments just before and after reshock, respectively. As shown in table 1, (3.2) usefully predicts the post-reshock growth rate for small-amplitude cases, where
 ${ka_{r}^-}\lt 0.38$
. However, as the amplitude-to-wavelength ratio become larger at the time of reshock, the model tends to overestimate the post-reshock growth rate. Building on several earlier studies (Dimonte & Ramaprabhu Reference Dimonte and Ramaprabhu2010; Buttler et al. Reference Buttler2012; Probyn et al. Reference Probyn, Williams, Thornber, Drikakis and Youngs2021), Guo et al. (Reference Guo, Si, Zhai and Luo2022b
) attributed this overestimation primarily to the large-amplitude effect, which is not accounted for in the model. To address this issue, we incorporate a correction factor
 $R^{{Guo}}$
into (3.2), as suggested by Guo et al. (Reference Guo, Si, Zhai and Luo2022b
), to account for the large-amplitude effect. The revised model is expressed as follows:
 \begin{equation} \frac {\textrm { d}a_2}{\textrm { d}t}=R^{{Guo}}k\Delta V_2\left( \frac {A_r^+ a_{r}^+ +A_r^- a^-_{r}}{2} \right)-\frac {\textrm { d}a_1}{\textrm { d}t}, \end{equation}
where
 \begin{equation} R^{{Guo}}= \begin{cases}1 & (k{a_r^-} \lt 0.38) \\ \dfrac {{1}}{{1.2+(ka^-_{r})^2/1.5}} & (k{a_r^-} \geqslant 0.38)\end{cases}. \end{equation}
Note that the current formulation of the correction factor in (3.3) is not mathematically continuous at
 ${ka_{r}^-}= 0.38$
. The correction factor for
 ${ka_{r}^-} \geqslant 0.38$
is empirically fitted based on experimental data and prior insights. For
 $k{a_r^-} \lt 0.38$
, due to limited experimental resolution and lack of detailed data, a constant correction factor of 1 is applied here. This highlights the need for future investigations into the transitional
 $k{a_r^-}$
regime though additional experiments to refine the discontinuity. Despite this, as shown in table 1, (3.3) provides significantly improved predictions compared with the original model, particularly for large-amplitude cases.
Morphologies of the whole interface extracted from schlieren images and the basic modes obtained with Fourier analysis at the time of reshock for (a) case M1-40-
 $S$
, (b) case M1-40-
 $L$
, (c) case M1-20-
 $L$
and (d) case M1-30-
 $L^{+}$
.

As the amplitude-to-wavelength ratio increases further (e.g. cases M1-20-
 $L$
and M1-30-
 $L^+$
), (3.3) fails to provide accurate predictions. Notably, cases M1-20-
 $L$
and M1-30-
 $L^+$
share identical
 $ka^-_{r}$
values, implying that they should exhibit similar growth rates according to the model. However, experimental measurements reveal significant differences in their growth rates, highlighting a limitation of the revised model in predicting reshocked RMI at large-amplitude interfaces. This discrepancy suggests that current models may overlook crucial physical mechanisms in large-amplitude cases. Our limited understanding of reshocked RMI mechanisms, particularly in the nonlinear regime, impedes the identification and incorporation of these missing factors into theoretical models.
As illustrated in figure 3, when either the reflection distance or the initial amplitude-to-wavelength ratio increases, the interface no longer maintains a single-mode shape upon the arrival of the reflected shock. An image-processing program is utilised to extract the interface morphology from schlieren images. By performing Fourier decomposition on the extracted morphologies, the amplitudes of harmonics at the time of reshock are available, as plotted in figure 5. It is observed that as
 $ka_{r}^-$
increases, higher harmonics become more pronounced. Although cases M1-30-
 $L^+$
and M1-20-
 $L$
share the same amplitude-to-wavelength ratio prior to reshock, the former exhibits more significant harmonics (indicating stronger nonlinearity) than the latter. We realise that the lower post-reshock growth rate in case M1-30-
 $L^+$
may be attributed to the stronger coupling effect between the fundamental mode and the second (even higher) harmonic, a factor not accounted for in existing models. To validate this hypothesis, experiments on the reshocked RMI at dual- and triple-mode interfaces, which involves stronger nonlinearity, are desired.
4. The RMI at a dual-mode interface with reshock
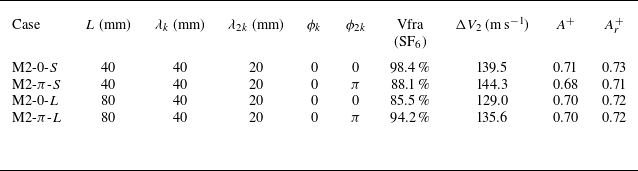
In this section, the reshocked RMIs at four types of dual-mode interfaces, which possess various mode compositions and phase differences, are examined. The phase of the second mode relative to the first one is set to be either
 $0$
or
 $\pi$
, corresponding to in-phase and anti-phase cases, respectively. Detailed parameters corresponding to the initial conditions for each case are listed in table 2. Developments of the interface morphologies and wave patterns for the dual-mode cases are displayed in figure 6. Unlike the single-mode case, the dual-mode interface exhibits asymmetry at the beginning. The mixing width, defined as the maximum distance between the spike and bubble tips (i.e.
 $h=2a$
), can be accurately measured from schlieren images. As the reflection distance increases, the shock-accelerated interface experiences a longer evolution period between the initial shock passage and reshock arrival, resulting in a larger mixing width prior to reshock. Additionally, the roll-up of the spike becomes more pronounced, indicating stronger nonlinearity compared with the single-mode case. This is consistent with the previous findings on multi-mode RTI (Ofer et al. Reference Ofer, Alon, Shvarts, McCrory and Verdon1996).
Sequences of schlieren images for various dual-mode cases. The unit of numbers is
 $\unicode {x03BC}$
s. The symbols are the same as those in figure 3.

Detailed parameters corresponding to the initial conditions for dual-mode cases. Here,
 $L$
refers to the distance from the interface to the end wall,
 $\lambda$
to the wavelength,
 $\phi$
to the perturbation phase, Vfra(SF
 $_6$
) to the volume fraction of SF
 $_6$
on the right side of the interface,
 $\Delta V_2$
to the velocity jump of the interface caused by reshock and
 $A^+$
and
 $A_r^+$
to the post-shock and post-reshock Atwood numbers, respectively.

A distinct feature of dual-mode RMI is its reduced periodicity along the transverse direction compared with the single-mode case. Specifically, in case M2-0-
 $L$
, after the shock impact, the larger bubble grows significantly faster than the smaller ones, i.e. the absolute growth rate of the larger bubble is higher than that of the smaller one. As time progresses, the larger bubble gradually encroaches on the adjacent smaller ones, and, consequently, the spikes develop with an apparent inclination to the large bubble (519
 $\unicode {x03BC}$
s). For case M2-
 $\pi$
-
 $L$
with anti-phase perturbations, all bubbles initially have the same shape and size, evolving symmetrically over time. The spikes, despite having two different initial sizes, also exhibit symmetric evolution. Eventually, the larger spike rolls up noticeably, similar to that seen in single-mode RMI, while the growth of the smaller spike is significantly suppressed, leading to the absence of roll-up structures. Furthermore, it is observed that this non-periodic characteristic of the interface structure persists even after the reshock impact. Following reshock, the interface undergoes phase inversion (i.e. spikes transform into bubbles and vice versa) due to the deposition of reverse vorticity. Although the post-inversion interface structure remains asymmetric, the amplitude differences between spikes and between bubbles are significantly reduced. For case M2-0-
 $L$
, prior to reshock (519
 $\unicode {x03BC}$
s), the interface exhibits two large bubbles alongside three smaller ones. After phase inversion (736
 $\unicode {x03BC}$
s), while morphological distinctions persist, the amplitude differences among the inverted structures are notably diminished. Specifically, the previously larger bubbles develop into smaller, flat-topped spikes, while the smaller bubbles evolve into larger, sharp-topped spikes. This characteristic phase inversion behaviour is observed across all experimental cases. As the reflection distance increases, this non-periodicity becomes more pronounced. The present results manifest the evident dependence of reshocked RMI on initial perturbation spectra. Despite this, it is important to note that this sensitivity diminishes after reshock.
Morghologies of the whole interface extracted from schlieren images and the basic modes obtained with Fourier analysis at the time of reshock for (a) case M2-0-
 $S$
, (b) case M2-
 $\pi$
-
 $S$
, (c) case M2-0-
 $L$
and (d) M2-
 $\pi$
-
 $L$
.

Previous experiments on reshocked RMI at random multi-mode interfaces have shown that the impact of the reflected shock can cause a rapid transition to turbulent mixing (Leinov et al. Reference Leinov, Malamud, Elbaz, Levin, Ben-Dor, Shvarts and Sadot2009). In those experiments, characterising the perturbation spectrum at initial multi-mode interfaces is challenging, hindering flow decomposition. In the present experiment, the clear and distinct interface contours extracted from the high-fidelity schlieren images enable us to conduct Fourier analysis, thereby facilitating the analysis on the generation and growth of harmonics, as shown in figure 7. Here, the interface contours extracted from schlieren images are represented by the hollow circles, while the harmonics obtained through Fourier analysis are depicted by lines. Note the interface contours are extracted from the central region of the schlieren images, as indicated by the white dashed lines in figure 6, effectively minimising the influence of the sidewall. Notably, the mixing width at the time of reshock remains invariant across all cases. In all cases, the second harmonic exhibits a considerably large amplitude, demonstrating evident nonlinear behaviour in dual-mode cases. As shown in § 3, for an initial single-mode interface, the instability growth after reshock is still dominated by the fundamental mode of the initial interface. However, for dual-mode cases, the coupling between the harmonics and basic modes would play a significant role in instability growth. Previous studies have shown that for interfaces with a dominant mode before reshock, the post-reshock growth rate exhibits only a very weak correlation with
 $ka_{r}^-$
(Charakhch’An Reference Charakhch’An2000; Ukai, Balakrishnan & Menon Reference Ukai, Balakrishnan and Menon2011). Furthermore, for interfaces with random multi-mode perturbations, the post-reshock growth rate is almost independent of
 $ka_{r}^-$
(Leinov et al. Reference Leinov, Malamud, Elbaz, Levin, Ben-Dor, Shvarts and Sadot2009). These observations may be attributed to mode-coupling effects. The high-fidelity experimental results obtained here enable us to perform a detailed analysis on the harmonic growth such that a more in-depth understanding of the regimes of reshocked RMI can be gained.
Under the assumptions of incompressible, irrotational and inviscid flow, Haan (Reference Haan1991) developed a modal model for the RTI at a three-dimensional multi-mode interface using the perturbation expansion method. This model incorporates mode-coupling effects and is expressed as
 \begin{align} \ddot {a}_{{k}}&= \gamma (k)^2 a_{{k}}+ k A \sum _{{k}^{\prime } }\left \{\ddot {a}_{{k}^{\prime }} a_{{k-k^{\prime }}}\big(1-\hat {\boldsymbol{k}}^{\prime } \cdot \hat {\boldsymbol{k}}\big)\right . \nonumber \\ &\quad \left .+\,\dot {a}_{{k}^{\prime }} \dot {a}_{{k-k^{\prime }}}\left [\frac {1}{2}-\hat {\boldsymbol{k}}^{\prime } \cdot \hat {\boldsymbol{k}}-\frac {1}{2} \hat {\boldsymbol{k}}^{\prime } \cdot \big(\boldsymbol{\hat{k}}-\boldsymbol{\hat{k}}^{\prime}\big)\right]\right\}\kern-2.5pt, \end{align}
where
 $\gamma (k)^2 a_{{k}}$
is the linear growth rate and
 $\hat {\boldsymbol{k}}$
is the unit vector
 $\boldsymbol{k}/k$
. In the case of two-dimensional perturbations, Ofer et al. (Reference Ofer, Alon, Shvarts, McCrory and Verdon1996) derived a second-order analytical solution for the growth of perturbation amplitude with time
 \begin{equation} a_k(t)=a_k^{{lin}}(t)+\frac {1}{2} k A\left (\sum _{k^{\prime }} a_{k^{\prime }}^{{lin}}(t) a_{k+k^{\prime }}^{{lin}}(t)-\frac {1}{2} \sum _{k^{\prime }\lt k} a_{k^{\prime }}^{{lin}}(t) a_{k-k^{\prime }}^{{lin}}(t)\right ). \end{equation}
Luo et al. (Reference Luo, Liu, Liang, Ding and Wen2020) and Chen et al. (Reference Chen, Wang, Zhai and Luo2024) have applied this model to predict RMI at perturbed interfaces under a single shock. To quantify the mode-coupling effects in reshocked RMI, we follow the approach of Luo et al. (Reference Luo, Liu, Liang, Ding and Wen2020) and Chen et al. (Reference Chen, Wang, Zhai and Luo2024) by taking the second-order time derivative of (4.2)
 \begin{align} \ddot {a}_k(t)&=\ddot {a}_k^{{lin}}(t)+\frac {1}{2} k A\left [\sum _{k^{\prime }} (\ddot {a}_{k^{\prime }}^{{lin}}(t) a_{k+k^{\prime }}^{{lin}}(t)+2\dot {a}_{k^{\prime }}^{{lin}}(t) \dot {a}_{k+k^{\prime }}^{{lin}}(t)+{a}_{k^{\prime }}^{{lin}}(t) \ddot {a}_{k+k^{\prime }}^{{lin}}(t))\right . \nonumber\\ &\quad \left .-\frac {1}{2} \sum _{k^{\prime }\lt k} (\ddot {a}_{k^{\prime }}^{{lin}}(t) a_{k-k^{\prime }}^{{lin}}(t)+2\dot {a}_{k^{\prime }}^{{lin}}(t) \dot {a}_{k-k^{\prime }}^{{lin}}(t)+{a}_{k^{\prime }}^{{lin}}(t) \ddot {a}_{k-k^{\prime }}^{{lin}}(t))\right ]. \end{align}
Chen et al. (Reference Chen, Wang, Zhai and Luo2024) simplified (4.3) by replacing the term
 $2\dot {a}_{k^{\prime }}^{{lin}}(t) \dot {a}_{k+k^{\prime }}^{{lin}}(t)$
with linear growth rates measured from RMI experiments. Time integration of the modified equation yields a growth rate that contains a temporal term
 $2V_{k^{\prime }}^{{lin}} V_{k+k^{\prime }}^{{lin}}t$
, suggesting that mode-coupling effects evolve with time. While this approach has been validated for single-shock impacts on small-amplitude interfaces, its application to reshocked RMI presents significant challenges. For reshock cases, interfaces develop larger amplitudes and higher growth rates, causing the term
 $ 2V_{k^{\prime }}^{{lin}} V_{k+k^{\prime }}^{{lin}}t$
to exhibit strong temporal dependence, significantly influencing the growth rate evolution. However, as shown in figure 12(b), the interface exhibits an almost linear growth following reshock, indicating low sensitivity to time. This discrepancy suggests that the conventional derivations fail to capture the fundamental physics of reshocked RMI. This inconsistency motivates our development of a new time-independent modal model specifically for reshock conditions.
It is important to note that Richtmyer’s impulsive model (Richtmyer Reference Richtmyer1960) is naturally an extension of the linear theory of RTI for the case of a single-mode interface. In his seminar work, Richtmyer approximated the shock impact as a delta-function-like impulse, leading to a simplified impulsive model for the post-shock interface evolution. In this work, we adopt a similar approach for the multi-mode case. Specifically, we starts from the well-established weakly nonlinear RTI framework formulated by Haan (Reference Haan1991), and then introduce the impulsive acceleration (i.e. Dirac delta function) to represent the shock impact. This yields a weakly nonlinear model for early-time multi-mode RMI. Specifically, substituting the initial conditions below for RTI flows into the above equation
 \begin{equation} a(t)=e^{\sqrt {kAg}t},\dot {a}(t)=\sqrt {kAg}a(t),\ddot {a}(t)=kAga(t), \end{equation}
we obtain
 \begin{align} \ddot {a}_k(t)&=kAga_k^{{lin}}(t)+ \frac {1}{2} k A \left \{ \sum _{k^{\prime }} \left [{k^{\prime }Ag{a}_{k^{\prime }}^{{lin}}(t) a_{k+k^{\prime }}^{{lin}}(t)+2\sqrt {k^{\prime }(k+k^{\prime })}Ag{a}_{k^{\prime }}^{{lin}}(t) {a}_{k+k^{\prime }}^{{lin}}(t) }\right .\right .\nonumber \\ &\left . \qquad +(k+k^{\prime })Ag{a}_{k+k^{\prime }}^{{lin}}(t){a}_{k^{\prime }}^{{lin}}(t) \right ] \nonumber \\ &\quad -\frac {1}{2} \sum _{k^{\prime }\lt k} \left [{k^{\prime }Ag{a}_{k^{\prime }}^{{lin}}(t) a_{k-k^{\prime }}^{{lin}}(t)+2\sqrt {k^{\prime }(k-k^{\prime })}Ag{a}_{k^{\prime }}^{{lin}}(t){a}_{k-k^{\prime }}^{{lin}}(t) }\right .\nonumber \\ &\left .\left .\qquad +(k-k^{\prime })Ag{a}_{k-k^{\prime }}^{{lin}}(t){a}_{k^{\prime }}^{{lin}}(t)\right ] \right \}. \end{align}
This expression incorporates both linear growth terms and nonlinear mode-coupling terms, as indicated by the summation over different wavenumbers. For the RMI, the acceleration can be modelled as an impulsive function
 \begin{equation} g=\Delta v \delta (t), \quad \delta (t)= \begin{cases}0 & (t \neq 0) \\ 1 & (t=0)\end{cases}. \end{equation}
By substituting (4.6) into (4.5) and integrating the resulting expression with respect to time, an analytical solution that accounts for mode-coupling effects is obtained, enabling the calculation of the growth rate of mode
 $k$
for RMI. The solution is expressed as
 \begin{align} V_k^M&=V_k^{{lin}}+\frac {1}{2}Ak\left \{\sum _{k^{\prime }}\left [\left (1+\sqrt {\frac {k+k^{\prime }}{k^{\prime }}}\right ) V_{k^{\prime }}^{{lin}} a_{k+k^{\prime }}^++\left (1+\sqrt {\frac {k^{\prime }}{k+k^{\prime }}}\right ) V_{k+k^{\prime }}^{{lin}}a_{k^{\prime }}^+\right ]\right . \nonumber\\ &\quad \left . -\frac {1}{2} \sum _{k^{\prime }\lt k}\left [\left (1+\sqrt {\frac {k-k^{\prime }}{k^{\prime }}}\right ) V_{k^{\prime }}^{{lin}} a_{k-k^{\prime }}^++\left (1+\sqrt {\frac {k^{\prime }}{k-k^{\prime }}}\right ) V_{k-k^{\prime }}^{{lin}} a_{k^{\prime }}^+\right ]\right \}. \end{align}
Here,
 $V_k^{{lin}}$
is the linear growth rate of mode
 $k$
calculated using (3.3) and
 $a_k^+$
denotes the post-shock amplitude. Equation (4.7) yields a time-independent coupled growth rate, consistent with the present experimental observations.
Fourier analysis of the extracted interface morphologies enables the decomposition of the interface into its constituent modes. This enables us to track the evolution of each harmonic over time and analyse their individual growth rates. Here, we consider the coupling effect among only the first four harmonics on the growth of each fundamental mode. According to (4.7), the growth rates of the basic modes (
 $k$
and
 $2k$
) following reshock can be calculated as
 \begin{align} V_k^M=V_k^{{lin}}&+\frac {1}{2}A_r^+k_1\left[\left(1+\sqrt {2}\right) V_{k}^{{lin}} a_{2k}^++\left(1+\frac {\sqrt {2}}{2}\right) V_{2k}^{{lin}} a_{k}^+\right]\nonumber \\ &+\frac {1}{2}A_r^+k_1\left[\left(1+\sqrt {\frac {3}{2}}\right) V_{2k}^{{lin}} a_{3k}^++\left(1+\sqrt {\frac {2}{3}}\right) V_{3k}^{{lin}} a_{2k}^+\right]\nonumber \\ &+\frac {1}{2}A_r^+k_1\left[\left(1+\sqrt {\frac {3}{4}}\right) V_{3k}^{{lin}} a_{4k}^++\left(1+\sqrt {\frac {3}{4}}\right) V_{4k}^{{lin}} a_{3k}^+ \right], \end{align}
 \begin{align} V_{2k}^M=V_{2k}^{{lin}}&-A_r^+k_2 V_{k}^{{lin}} a_{k}^+\nonumber \\ &+\frac {1}{2}A_r^+k_2\left[\left(1+\sqrt {3}\right) V_{k}^{{lin}} a_{3k}^++\left(1+\sqrt {\frac {1}{3}}\right) V_{3k}^{{lin}} a_{k}^+\right]\nonumber \\ &+\frac {1}{2}A_r^+k_2\left[\left(1+\sqrt {2}\right) V_{2k}^{{lin}} a_{4k}^++\left(1+\frac {\sqrt {2}}{2}\right) V_{4k}^{{lin}} a_{2k}^+\right], \end{align}
where the amplitude and growth rate of the
 $3k$
and
 $4k$
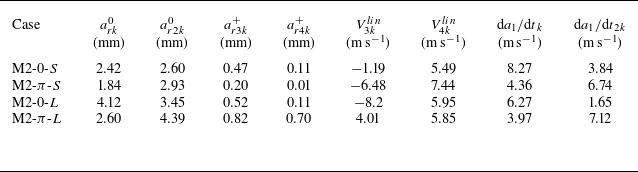
modes after reshock are measured from experiment, as presented in table 3.
Detailed parameters corresponding to the initial conditions for dual-mode cases. Here,
 $a_{r}^0$
refers to the interface amplitude at the moment before the reshock,
 $a_{r}^+$
to the interface amplitude at the moment after the reshock,
 $ V^{{lin}}$
to the post-reshock growth rate of the interface and
 ${\textrm {d}a_1}/{\textrm{d}t}$
to the pre-reshock growth rate of the interface. The symbols ‘+’ and ‘−’ indicate whether the phase is in phase with the first-order fundamental mode (+) or out of phase (−).

The amplitude growths of modes
 $k$
(a) and 2
 $k$
(b) for dual-mode cases following reshock.

As shown in figure 8, the predictions of the modal mode deviate from the experimental results. For instance, in case M2-0-
 $L$
, a notable discrepancy is observed between the model predictions and experimental data for the
 $k_{40}$
mode, with smaller deviations also present for other modes. The primary reason for this discrepancy is given below. As can be seen from the present schlieren images, after the reflected shock interacts with the interface, phase inversion occurs and the amplitude growth restarts from near zero. Consequently, in the early stages, the amplitude remains very small, and the effects of mode coupling are negligible. This is consistent with the observation that Haan (Reference Haan1991), who pointed out that, for RMI or RTI at a multi-mode interface, each mode evolves independently within the linear regime. Inspired by the concept of asymptotic matching, we propose an empirical model that matches the initial linear growth rate and the late asymptotic growth rate that accounts for mode-coupling effects. The model is expressed as
 \begin{equation} V^{H}(t)=\frac {20 t+\frac {L}{\left |V^{\mathrm{M}}\right |}}{20 t+\frac {L}{\left |V^{{lin}}\right |}}V^{\mathrm{M}}, \end{equation}
where
 $L$
is the length scale, corresponding to the width of the test section (120 mm in this work). By substituting (4.8) and (4.9) into (4.10), the amplitude growth of each fundamental mode after reshock can be estimated, as given in figure 8. Here,
 $t_r^\ast$
denotes the moment at which phase reversion ends and
 $a_r^\ast$
is the amplitude at
 $t_r^\ast$
. This new model provides reliable predictions for the growth of fundamental modes across all cases examined in this study. To the authors’ knowledge, this represents the first modal model developed for reshocked RMI at multi-mode interfaces. Note that (4.10) is physically motivated, as it is constructed to capture the transition from linear to nonlinear growth, although the exact coefficients are empirically calibrated against experimental data. The error bars in figure 8 represent uncertainties associated with the extraction of interface profiles, rather than statistical variations from repeated experiments. These uncertainties primarily arise from experimental limitations, including the spatial resolution of the imaging system, interface broadening caused by fragmented soap-film droplets and three-dimensional effects.
5. The RMI at a triple-mode interface with reshock
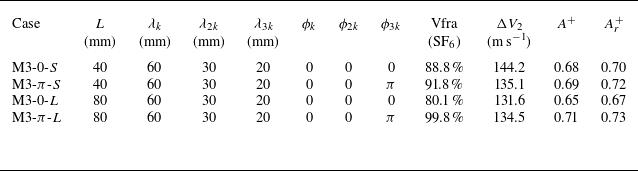
To further validate the developed model and explore mode-coupling effects in reshocked RMI in greater depth, four sets of triple-mode interfaces are examined. Similar to the dual-mode case, various reflection distances and phase differences are considered. Detailed parameters for these cases are listed in table 4. The evolutions of interface morphologies and wave patterns for these cases, illustrated by schlieren images, are presented in figure 9. The amplitudes of the fundamental modes and harmonics at the time of reshock, obtained through Fourier decomposition of the extracted interface morphologies, are plotted in figure 10. In this figure, the circle symbols represent the extracted interface contours, while the solid lines depict the fundamental modes obtained through Fourier decomposition. These cases exhibit comparable amplitudes at any given time following reshock.
Detailed parameters corresponding to the initial conditions for triple-mode cases. Here,
 $L$
refers to the distance from the interface to the end wall,
 $\lambda$
to the wavelength,
 $\phi$
to the perturbation phase, Vfra(SF
 $_6$
) to the volume fraction of SF
 $_6$
on the right side of the interface,
 $\Delta V_2$
to the interface velocity jump caused by reshock and
 $A^+$
and
 $A_r^+$
to the post-shock and post-reshock Atwood numbers, respectively.

Sequences of schlieren images for various triple-mode cases. The unit of numbers is
 $\unicode {x03BC}$
s. The symbols are the same as those in figure 3.

Morphologies of the interface extracted from schlieren images and the basic modes obtained with Fourier analysis at the time of reshock for (a) case M3-0-
 $S$
, (b) case M3-
 $\pi$
-
 $S$
, (c) case M3-0-
 $L$
and (d) case M3-
 $\pi$
-
 $L$
.

By incorporating the coupling effects between the first to sixth harmonics on the growth of each fundamental mode, the growth of the three fundamental modes can be described by the following equations:
 \begin{align} V_k^M=V_k^{{lin}}&+\frac {1}{2}A_r^+k_1\left[\left(1+\sqrt {2}\right) V_{k}^{{lin}} a_{2k}^++\left(1+\frac {\sqrt {2}}{2}\right) V_{2k}^{{lin}} a_{k}^+\right]\nonumber\\ &+\frac {1}{2}A_r^+k_1\left[\left(1+\sqrt {\frac {3}{2}}\right) V_{2k}^{{lin}} a_{3k}^++\left(1+\sqrt {\frac {2}{3}}\right) V_{3k}^{{lin}} a_{2k}^+\right]\nonumber\\ &+\frac {1}{2}A_r^+k_1\left[\left(1+\sqrt {\frac {3}{4}}\right) V_{3k}^{{lin}} a_{4k}^++\left(1+\sqrt {\frac {3}{4}}\right) V_{4k}^{{lin}} a_{3k}^+\right]\nonumber\\ &+\frac {1}{2}A_r^+k_1\left[\left(1+\sqrt {\frac {5}{4}}\right) V_{4k}^{{lin}} a_{5k}^++\left(1+\sqrt {\frac {4}{5}}\right) V_{5k}^{{lin}} a_{4k}^+\right]\nonumber\\ &+\frac {1}{2}A_r^+k_1\left[\left(1+\sqrt {\frac {6}{5}}\right) V_{5k}^{{lin}} a_{6k}^++\left(1+\sqrt {\frac {5}{6}}\right) V_{6k}^{{lin}} a_{5k}^+\right], \end{align}
 \begin{align} V_{2k}^M=V_{2k}^{{lin}}&-A_r^+k_2 V_{k}^{{lin}} a_{k}^+\nonumber\\ &+\frac {1}{2}A_r^+k_2\left[\left(1+\sqrt {3}\right) V_{k}^{{lin}} a_{3k}^++\left(1+\sqrt {\frac {1}{3}}\right) V_{3k}^{{lin}} a_{k}^+\right]\nonumber\\ &+\frac {1}{2}A_r^+k_2\left[\left(1+\sqrt {2}\right) V_{2k}^{{lin}} a_{4k}^++\left(1+\frac {\sqrt {2}}{2}\right) V_{4k}^{{lin}} a_{2k}^+\right]\nonumber\\ &+\frac {1}{2}A_r^+k_2\left[\left(1+\sqrt {\frac {5}{3}}\right) V_{3k}^{{lin}} a_{5k}^++\left(1+\sqrt {\frac {3}{5}}\right) V_{5k}^{{lin}} a_{3k}^+\right]\nonumber\\ &+\frac {1}{2}A_r^+k_2\left[\left(1+\sqrt {\frac {3}{2}}\right) V_{4k}^{{lin}} a_{6k}^++\left(1+\sqrt {\frac {2}{3}}\right) V_{6k}^{{lin}} a_{4k}^+\right], \end{align}
 \begin{align} V_{3k}^M=V_{3k}^{{lin}}&-\frac {1}{2}A_r^+k_3\left[\left(1+\sqrt {2}\right) V_{k}^{{lin}} a_{2k}^++\left(1+\frac {\sqrt {2}}{2}\right) V_{2k}^{{lin}} a_{k}^+\right]\nonumber\\ &+\frac {1}{2}A_r^+k_3\left(3 V_{k}^{{lin}} a_{4k}^++\frac {3}{2} V_{4k}^{{lin}} a_{k}^+\right)\nonumber\\ &+\frac {1}{2}A_r^+k_3\left[\left(1+\sqrt {\frac {5}{2}}\right) V_{2k}^{{lin}} a_{5k}^++\left(1+\sqrt {\frac {2}{5}}\right) V_{5k}^{{lin}} a_{2k}^+\right]\nonumber\\ &+\frac {1}{2}A_r^+k_3\left[\left(1+\sqrt {2}\right) V_{3k}^{{lin}} a_{6k}^++\left(1+\frac {\sqrt {2}}{2}\right) V_{6k}^{{lin}} a_{3k}^+\right]. \end{align}
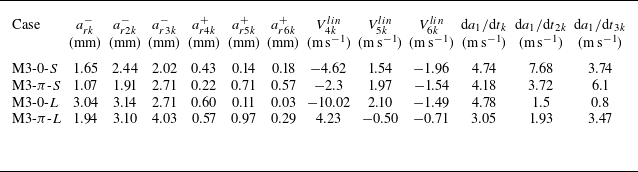
Similarly, by employing asymptotic matching as in (4.10), the post-reshock growth rates of the fundamental modes can be calculated. Note that, in the calculation, the amplitudes of the fourth, fifth and sixth harmonics are measured experimentally, as listed in table 5. The temporal variations of the amplitudes of the three fundamental modes after reshock are plotted in figure 11. As shown, the model provides accurate predictions for the growth of all fundamental modes. An exception is the growth of the
 $3k$
mode in case M3-
 $\pi$
-
 $L$
after 150
 $\unicode {x03BC}$
s. This deviation is ascribed to stronger nonlinearity in this case, as evidenced by earlier saturation, which exceeds the application range of the present model. Specifically, the pre-reshock amplitude-to-wavelength ratio of the
 $3k$
mode for case M3-
 $\pi$
-
 $L$
is 1.27. This higher ratio leads to a rapid approach to nonlinear saturation due to the high initial growth rate, which contradicts the current model. Equations (4.8) and (4.9) do incorporate a second-order approximation of mode-coupling effects, based on the assumption that these interactions occur primarily during the reshock event. This approximation captures the early post-reshock evolution reasonably well, particularly when the interface amplitude is still small and the nonlinear interactions are relatively weak. However, as the interface evolution enters a strongly nonlinear regime, higher-order mode interactions become increasingly significant and are no longer adequately represented by the simplified coupling terms derived under impulsive assumptions. In particular, these equations, which are derived from Haan’s second-order weakly nonlinear model, fail to account for the sustained mode interactions and vortex-merging dynamics that persists long after the passage of the shock. Therefore, while (4.8) and (4.9) account for initial mode coupling, their assumptions break down at later times, explaining the model–data discrepancy in the strongly nonlinear phase.
Main parameters corresponding to the perturbation growth in triple-mode cases. Here,
 $a_{r}^-$
refers to the interface amplitude at the moment before the reshock,
 $a_{r}^+$
to the interface amplitude at the moment after the reshock,
 $ V^{{lin}}$
to the post-reshock growth rate of the interface,
 ${\textrm{d}a_1}/{\textrm{d}t}$
to the pre-reshock growth rate of the interface and ‘ +’ and ‘−’ denote whether the phase is in phase with the first-order fundamental mode (+) or out of phase with it (−).

The amplitude growths of modes (a)
 $k$
, (b) 2
 $k$
and (c) 3
 $k$
for triple-mode cases following reshock.

6. Correlation between the post-reshock growth rate and the pre-reshock interface shape
The above results demonstrate that mode-coupling effects play a crucial role in the evolution of reshocked RMI at both dual- and triple-mode interfaces. Additionally, the results for single-mode RMI reveal that as harmonic amplitudes become relatively large, existing models that ignore harmonic generation become less accurate. These findings suggest that neglecting mode-coupling effects could be a crucial factor for the failure of model prediction. To validate this hypothesis, we use Fourier analysis to examine the mode compositions of all interfaces considered in this study at the time of reshock. Three single-mode cases with relatively strong nonlinearity are first examined, and their amplitude growths are compared with model predictions. As depicted in figure 12(a), the new modal model, which incorporates mode-coupling effects, provides significantly improved predictions compared with the original model. Considering the predicted growth rate is time-dependent, an average growth rate,
 $\bar {V}^H$
, is calculated for each case to facilitate comparison, as detailed in table 6. The comparison between the linear mode and modal mode predictions demonstrates that as higher harmonics emerge, mode-coupling effects become significant and must be accounted for. The time at which the reflected rarefaction wave interacts with the interface under short, long and extended reflection distances marked in figure 12(a) indicates that nonlinear growth of the interface is already evident in all cases before the arrival of RRW
 $_1$
. This exludes the possibility that the post-reshock growth rate is influenced by the subsequent wave interactions. Similar interface growth behaviour following reshock has been observed across diverse shock-tube experiments and simulations (Vetter & Sturtevant Reference Vetter and Sturtevant1995; Bin et al. Reference Bin, Xiao, Shi, Zhang and Chen2021; Guo et al. Reference Guo, Si, Zhai and Luo2022b
; Wang et al. Reference Wang, Ding, Si and Luo2022; Cao et al. Reference Cao, Chen, Wang, Zhai and Luo2024; Xie et al. Reference Xie, Qi, Xiao, Zhang and Zhao2025). This behaviour is likely associated with the onset of turbulent mixing (Thornber et al. Reference Thornber2017; Kokkinakis, Drikakis & Youngs Reference Kokkinakis, Drikakis and Youngs2020; Soulard & Griffond Reference Soulard and Griffond2022; Zhou, Ding & Cheng Reference Zhou, Ding and Cheng2024).
The growth of the mixing width for (a) single-mode, (b) dual-mode and triple-mode interfaces. The solid lines denote the prediction of (3.3), the dash-dot-dotted lines denote the prediction of (4.10), and the dashed lines indicate the time at which the reflected rarefaction wave (RRW
 $_1$
) interacts with the interface. Note that the time at which the reflected rarefaction wave interacts with the interface under short, long and extended reflection distances, are respectively labelled as RRW-
 $S$
, RRW-
 $L$
and RRW-
 $L_x$
.

Detailed parameters corresponding to the initial conditions for single-mode cases. Here,
 $ka_{kr}$
refers to the product of wavenumber and amplitude at reshock for low-order interface,
 $2ka_{2kr}$
to the product of wavenumber and amplitude at reshock for second-order interface, ‘−’ indicates the opposite phase of the low-order interface,
 ${\textrm{d}a_2}/{\textrm {d}t}$
refers to the post-reshock growth rate of the interface,
 $V^{{lin}}$
to growth rate after reshock calculated with (3.3) and
 $\bar {V}^H$
to the average growth rate after reshock calculated with (4.10).

Temporal variations of the interface amplitude for the dual- and triple-mode cases are plotted in figure 12(b). It is observed that the dual- and triple-mode interfaces with different mode compositions and phase combinations present nearly identical growth rates after reshock. This observation is consistent with the previous findings of Leinov et al. (Reference Leinov, Malamud, Elbaz, Levin, Ben-Dor, Shvarts and Sadot2009) regarding reshocked RMI at initial random multi-mode interfaces. However, for the single-mode case, the post-reshock growth rate is closely related to the initial interface morphology, consistent with recent findings (Guo et al. Reference Guo, Cong, Si and Luo2022a ; Zhang et al. Reference Zhang, Zhao, Ding and Luo2023b ). This raises an interesting yet crucial question: Under what conditions does the post-reshock growth rate depend on the pre-reshock interface morphology?
Charakhch’An (Reference Charakhch’An2000) found that the post-reshock growth rate shows a weak dependence on the pre-reshock amplitude and wavenumber, but is closely related to the pre-reshock growth rate. Based on this finding, an empirical model was proposed
 \begin{equation} \frac {\textrm { d}h_2}{\textrm { d}t}= \beta \Delta V_2 A_r^+ -\frac {\textrm { d}h_1}{\textrm { d}t}, \end{equation}
where
 $h_2$
is the overall width of the mixing zone (i.e. the distance between the spike and bubble tips) and
 ${\textrm{d}h_1}/{\textrm{d}t}$
is the growth rate of the mixing width just before reshock. The value of
 $\beta = 1.25$
, which represents the average of
 $\beta$
values ranging from 0.53 to 1.5 across various cases, was suggested.
The post-reshock growth rate for the basic modes and harmonics can be predicted by the modal model:
 $ V_{r}(t)={V}_{k}^H(t)\cos (k x+\phi _k)+\sum _{n\gt 1} {V}_{nk}^H(t)\cos (n k x+\phi _{nk})$
, where
 ${V}^H(t)$
is the growth rate after reshock calculated using (4.10). Based on (6.1),
 $\beta$
can be expressed as
 \begin{equation} \beta ^H(t)=\frac {(|{V}_{r}^{{max}}(t)|+|{V}_{r}^{{min}}(t)|)+(|V_{1}^{{max}}|+|V_{1}^{{min}}|)}{\Delta V_2 A_r^+}, \end{equation}
with
 $V_{1}={\textrm {d}a_1}/{\textrm{d}t}_{k}\cos (k x+\phi _k)+\sum _{n\gt 1} {\textrm {d}a_1}/{\textrm{d}t}_{nk}\cos (n k x+\phi _{nk}), (n=1,2,3)$
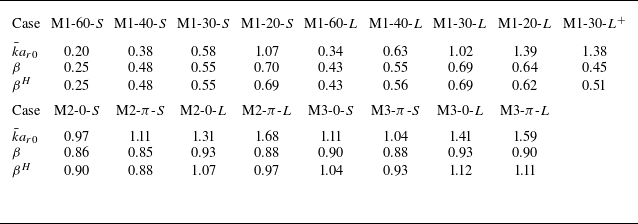
representing the interface growth rate prior to reshock. As indicated in table 7, (6.2) provides reasonable predictions for the value of
 $\beta$
across all single-, dual- and triple-mode cases examined in this study.


The variation of
 $\beta$
with
 $\bar ka_{r0}$
.

To facilitate comparison among the single-, dual- and triple-mode cases, the experimental data are normalised using the method of Gowardhan, Ristorcelli & Grinstein (Reference Gowardhan, Ristorcelli and Grinstein2011). For a multi-mode interface, the characteristic wavenumber is calculated by the weighted average wavenumber
 \begin{equation} \bar k = \sqrt {\frac {\sum _{i=1}^n a_{ik}^2 k_{ik}^2}{\sum _{i=1}^n a_{ik}^2}}. \end{equation}
The relationship between
 $\beta$
and
 $\bar ka_{r0}$
for all cases is shown in figure 13. As we can see, for the single-mode case,
 $\beta$
is closely related to
 $\bar {k} a_{r0}$
, whereas for the multi-mode case, where nonlinearity becomes more pronounced,
 $\beta$
shows only a weak dependence on
 $\bar {k} a_{r0}$
. The present finding provides a sound explanation for the varying degrees of dependence of
 $\beta$
on
 $\bar ka_{r0}$
in single- and multi-mode configurations under reshock conditions.
7. Conclusions
This work presents a comprehensive experimental and theoretical investigation of reshocked RMI. Through a soap-film technique, we achieve unprecedented control over initial interface shape, successfully generating well-defined single-, dual- and triple-mode air/SF
 $_6$
interfaces. The reflected shock is created by an acrylic block inserted into the test section. This experimental design facilitates precise control over both interface morphology and reshock timing, enabling a systematic exploration of the relationship between post-reshock instability growth and initial perturbation spectra.
The results reveal distinct dependencies of the post-reshock growth rate on the pre-reshock interface morphology across different configurations. For single-mode interfaces, the post-reshock growth rate strongly correlates with pre-reshock conditions. In contrast, for multi-mode interfaces, this dependence weakens significantly. This is attributed to enhanced mode-coupling effects in multi-mode configurations, a crucial physical mechanism that has been inadequately addressed in existing theoretical models. To bridge this gap, we develop an empirical modal model that matches the initial linear growth and the asymptotic growth rate accounting for mode-coupling effects. The model demonstrates excellent predictive capability across all experimental configurations, from single-mode to more complex triple-mode cases. Furthermore, a unified formula relating the empirical coefficient
 $\beta$
in Charakhch’An’s model (Charakhch’An Reference Charakhch’An2000) to initial perturbation characteristics is derived. This provides, for the first time, a coherent theoretical framework that explains the varying dependence of post-reshock growth rates on pre-reshock morphology observed across different experimental configurations. The comprehensive understanding gained through this work has significant implications for applications involving reshocked RMI, particularly in ICF and supersonic combustion systems. Our future work will focus on extending this framework to more complex interface configurations and investigating the transition to turbulent mixing under reshock conditions.
Funding
This work was supported by the National Natural Science Foundation of China (nos. 12388101, 12402259), the National Key Research and Development Program of China (2022YFF0504500), the Strategic Priority Research Program of Chinese Academy of Science (XDB1100120, XDB0500301) and the Laoshan Laboratory (LSKJ202300305).
Declaration of interests
The authors report no conflict of interest.