Implications
Today, most reference populations consist exclusively of proven bulls. Moving forward, selection for new functional traits using genomic selection requires additional reference animals to achieve higher accuracies of the direct genomic values and higher genetic gains. If all cows in the population have phenotypic records on the new functional trait, these additional reference animals could be test bulls and/or cows. However, if the new trait is recorded on a small scale, a reference population of all phenotyped cows gives the best result.
Introduction
The accuracy of genomic selection comes from estimated associations between genotypes and phenotypes in the reference population (Meuwissen et al., Reference Meuwissen, Hayes and Goddard2001). Today, almost all reference populations consist of progeny tested bulls (e.g. Hayes et al., Reference Hayes, Bowman, Chamberlain and Goddard2009; Lund et al., Reference Lund, de Roos, de Vries, Druet, Ducrocq, Fritz, Guillaume, Guldbrandtsen, Liu, Reents, Schrooten, Seefried and Su2010), because the accuracy of the direct genomic values (DGV) depends on the accuracy of the phenotypic information, and progeny testing has been the only way to achieve high accuracies for traits with a low heritability. In addition, relatively high costs of genotyping have so far called for reference populations of progeny tested bulls. However, variation is lost when lots of phenotypic data from cows are summarized in few estimated breeding values (EBV) of their sires. Thus, it may be beneficial to include cows in the reference population, especially if the phenotype is expensive to measure and/or if the costs of genotyping decrease.
Until now, the implementation of genomic selection has focused on traits that have been recorded and included in the routine genetic evaluation for a long time, because all past and present progeny tested bulls could be included in the reference population. However, the technological development enables recording of new (often functional) traits that have economic importance, and therefore should be included in the breeding goal. These new measurements may be more useful than the traditional measurements because they are closer to the biology of the traits of interest. Examples of new traits could be occurrence of hoof diseases reported by hoof trimmers (Buch et al., Reference Buch, Sørensen, Lassen, Berg, Eriksson, Jakobsen and Sørensen2011a) and progesterone-based measures obtained from milk samples (Petersson et al., Reference Petersson, Berglund, Strandberg, Gustavsson, Flint, Woolliams and Royal2007). Older progeny tested bulls do not have reliable EBV for these new traits, as they were not measured on their daughters. Thus, a different strategy is required to build up a reference population for genomic selection for new traits.
Breeding schemes, where genomically enhanced breeding values (GEBV) are used to select sires at an early age, realize the full potential of genomic selection (Buch et al., Reference Buch, Sørensen, Berg, Pedersen and Sørensen2011b). Thus, it is most likely that this type of scheme, which we call a turbo scheme, is going to be used in the long term. Schaeffer (Reference Schaeffer2006) and Buch et al. (Reference Buch, Sørensen, Berg, Pedersen and Sørensen2011b) found that a turbo scheme results in higher annual genetic gains of the aggregate genotype than other types of breeding schemes. However, the accuracies of the GEBV and DGV in both of these studies (0.75 and 0.71, respectively) correspond to the accuracies of the DGV for traits that have been recorded for a long time, such as milk yield. Genomic selection has already caused changes in most dairy cattle breeding schemes. One example is that fewer young bulls are progeny tested than before, because young bulls are pre-selected more accurately on the basis of GEBV than on the basis of parent average breeding values (PABV). Thus, both the current progeny testing scheme and the turbo scheme result in fewer bulls with both marker information and phenotypic information that could eventually be included in the reference population. One way to solve this problem could be to include test bulls in the reference population. In this context, test bulls have only a limited number of progeny for the sole purpose of maintaining the reference population.
So far, most traits are recorded on the majority of the cows in the population, for example, milk production traits and somatic cell score. It is likely that this practice is going to change and that new functional traits are recorded on a smaller part of the population, for example, only on cows that are milked in automatic milking systems. However, the number of phenotypic records that are used to estimate the marker effects has a favourable effect on the accuracy of genomic selection (Hayes et al., Reference Hayes, Bowman, Chamberlain and Goddard2009). The heritability of the trait also plays an important role for the accuracy of genomic selection, as more phenotypic records are required to achieve a given accuracy when the heritability is low (Hayes et al., Reference Hayes, Bowman, Chamberlain and Goddard2009). Thus, the accuracies of the DGV may be lower for new functional traits than for traits that have been recorded for a long time.
We consider two kinds of traits: one that is recorded as standard on a large proportion of the cows in the population, that is, on a large scale, and another that is only recorded on few cows under specific conditions, for example, in experimental farms, that is, on a small scale. For new functional traits, we expect that the value of cows in the reference population depends on the availability of phenotypic records. In other words: (i) for large-scale recording, if the number of bulls with proofs is large, the accuracy of the DGV will only increase marginally when phenotyped cows are included in the reference population and (ii) a reference population of cows will result in the highest accuracy of the DGV if few cows in the population have phenotypic records for the new functional trait. The objective of this study was to test the two expectations by predicting accuracies of DGV, given different strategies of building up a reference population over a 10-year period.
Material and methods
Population structure
The population consists of 30 000 new first-parity cows per year. On the basis of PABV, the best 2000 bull calves are genotyped. The 30 best sexually mature bulls are selected on the basis of GEBV and used directly as sires, that is, progeny testing results are not available when the sires are selected. Thus, the breeding scheme is a turbo scheme.
Scenarios for large-scale recording
To test the first hypothesis, four different strategies of building up a reference population were compared (Table 1). A common characteristic of the four scenarios is that all cows in the population have phenotypic records on the new trait. In addition, it is not possible to genotype animals other than male selection candidates. However, in scenarios S-C (sires-cows) and S-C-TB (sires-cows-test bulls), the 2000 best one-year-old females are genotyped in addition to males in order to select bull dams.
The total number of reference animals in the first year, and the number of phenotyped cows that the daughter yield deviations are based on within the three groups of reference animals. The phenotyped cows are either daughters of the male reference animals or reference animals

S = sires; S-TB = sires-test bulls; S-C = sires-cows; S-C-TB = sires-cows-test bulls.
1The reference population consists of 30 sires in the first year.
2The reference population consists of 30 sires and 170 test bulls in the first year.
3The reference population consists of 30 sires and 2000 cows in the first year.
4The reference population consists of 30 sires, 2000 cows and 170 test bulls in the first year.
S (sires)
A total of 30 genotyped sires, each with a daughter yield deviation (DYD) based on 1000 daughters, were added to the reference population every year. Thus, the reference population consisted of 30 sires after 1 year and 300 sires after 10 years. This scenario was used to study the effect of including sires only in the reference population.
S-TB (sires-test bulls)
A total of 30 genotyped sires, each with a DYD based on 717 daughters, and 170 genotyped test bulls, each with a DYD based on 50 daughters, were added to the reference population every year. The scenario was used to study the effect of supplementing the reference population by test bulls.
S-C
A total of 30 genotyped sires, each with a DYD based on 933 daughters, and 2000 genotyped cows with phenotypic records were added to the reference population each year. This scenario was used to study the effect of adding cows to the reference population.
S-C-TB
A total of 30 genotyped sires, each with a DYD based on 650 daughters, 2000 genotyped cows with phenotypic records and 170 genotyped test bulls, each with a DYD based on 50 daughters, were added to the reference population every year. The scenario was used to study the effect of supplementing the reference population by both cows and test bulls.
Scenarios for small-scale recording
To test the second hypothesis, two strategies were compared. A common feature of the two scenarios is that the new functional trait is only recorded on 2000 first-parity cows per year. Consequently, the reference population consisted of 2000 cows with phenotypic records (COWS) or the sires of these cows (SIRES).
COWS
A total of 2000 genotyped cows with phenotypic records on the functional trait were added to the reference population each year. This scenario was used to study the effect of a reference population of cows.
SIRES
A total of 30 genotyped sires, each with a DYD based on 67 daughters, were added to the reference population every year. The scenario was used to study the effect of summarizing the phenotypic information by including the sires of the cows in the reference population.
Accuracy of the DGV
We evaluated the scenarios by comparing the correlation between true breeding values and DGV, also referred to as the accuracy of DGV. Goddard (Reference Goddard2009) presented a deterministic model for predicting this accuracy (r(T, I)). It is important to notice that the accuracy of the DGV is based on marker data and it is independent of pedigree relationships, that is, only information that comes from linkage disequilibrium (LD) across the population is quantified. In our study, a normal distribution of quantitative trait loci (QTL) effects was assumed.
If the reference population consists of a single group of animals, then the accuracy of the DGV was calculated using the following formula (Goddard, Reference Goddard2009):

where r 2(T, Tm) is the proportion of variance of the true breeding value, which is explained by the markers, and r 2(Tm, I) is the proportion of variance of the DGV, which is explained by the markers.
On the assumption that all chromosome segments have the same effect, r 2(T, Tm) equals the expectation of r 2 that is a measure of LD. The approximate expectation of r 2 is (Sved, Reference Sved1971)

where Ne is the effective population size and c is the average recombination frequency between neighbouring loci, that is, the length of the genome in Morgans divided by the number of informative markers. Given the population parameters and the choice of single nucleotide polymorphism (SNP) chip, r(T, Tm) gives the upper bound for the accuracy of the DGV.
The proportion of variance of the DGV, which is explained by the markers, was calculated using the formula of Goddard (Reference Goddard2009):

where N is the number of animals in the reference population, a = 1+2λ/N, λ = Ve ,DYD/Vb for bulls (Ve ,DYD is the variance of the DYD given the true breeding value of the sire and Vb is the variance explained by each effective marker) and λ = Ve/Vb for cows (Ve is the residual variance of the trait).
The variance of the DYD, given the true breeding value of the sire, (Ve ,DYD) was calculated by means of the following formula:

where  is the reliability of the DYD for bulls, Nd is the number of daughters with phenotypic records per animal in the reference population, h 2 is the heritability of the trait and Va is the genetic variance of the trait.
The variance of the trait explained by each effective marker (Vb) was calculated using the following formula (Goddard, Reference Goddard2009):

where k = 1/(loge(2Ne)) and Me is the effective number of loci.
The effective number of loci in a random mating population is (Goddard, Reference Goddard2009)

where L is the length of the genome in Morgans.
If the reference population consists of n groups of animals with different information contents in their phenotypes, then the proportion of variance of the DGV, which is explained by the markers, was calculated using the following formula derived from selection index theory:

where P is a n-by-n (co)variance matrix consisting of r 2(Tm, I) on the diagonal and their products on the off-diagonals, and G was a n-by-1 vector of r 2(Tm,I).
Then the accuracy of the DGV was calculated by substituting  for r 2(Tm, I) in equation (1).
Parameter assumptions
We assumed that the length of the genome was 30 Morgans, and that the trait was a functional trait with a heritability of 0.05 or 0.15. The historical effective population size was set to 750 animals. We determined this number by varying the historical effective population size in the deterministic prediction model of Goddard (Reference Goddard2009), until it gave accuracies similar to those found by Lund et al. (Reference Lund, de Roos, de Vries, Druet, Ducrocq, Fritz, Guillaume, Guldbrandtsen, Liu, Reents, Schrooten, Seefried and Su2010). Lund et al. (Reference Lund, de Roos, de Vries, Druet, Ducrocq, Fritz, Guillaume, Guldbrandtsen, Liu, Reents, Schrooten, Seefried and Su2010) found differences between reliabilities of the genomic predictions and the pedigree indices in the range from 0.17 to 0.42 for Nordic validation bulls by using a reference population of approximately 10 000 bulls and a chip with 50 000 SNP. We also assumed that the animals in the reference population were genotyped for approximately 50 000 genome-wide markers of which 38 000 markers were informative, and that the cows in the reference population did not have daughters with phenotypic records.
Results
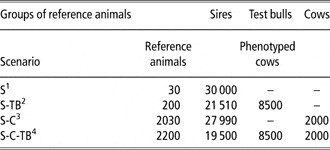
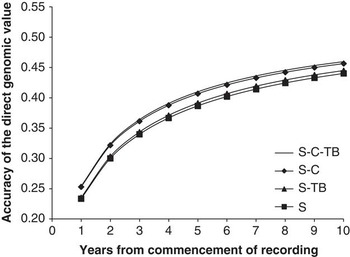
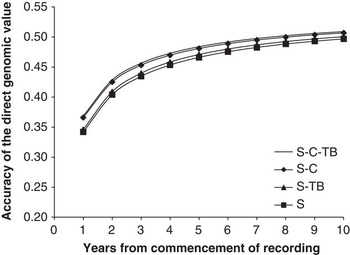
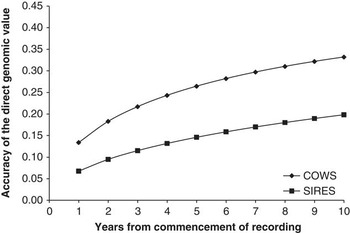
The accuracy of the DGV increased over time as more and more information about the marker effects became available, regardless of the heritability of the trait and the scale of the recording of phenotypes (Figures 1 to 4).
The accuracy of the direct genomic value for a trait with a heritability of 0.05 in a dairy cattle breeding scheme where 30 sires (S), 30 sires and 170 test bulls (S-TB), 30 sires and 2000 cows (S-C) or 30 sires, 2000 cows and 170 test bulls (S-C-TB) were added to the reference population every year.

The accuracy of the direct genomic value for a trait with a heritability of 0.15 in a dairy cattle breeding scheme where 30 sires (S), 30 sires and 170 test bulls (S-TB), 30 sires and 2000 cows (S-C) or 30 sires, 2000 cows and 170 test bulls (S-C-TB) were added to the reference population every year.

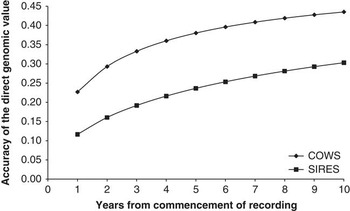
The accuracy of the direct genomic value for a trait with a heritability of 0.05 in a dairy cattle breeding scheme where 2000 cows (COWS) or 30 sires each with 67 daughters (SIRES) were added to the reference population every year.

The accuracy of the direct genomic value for a trait with a heritability of 0.15 in a dairy cattle breeding scheme where 2000 cows (COWS) or 30 sires each with 67 daughters (SIRES) were added to the reference population every year.

Recording on a large scale
The accuracy of the DGV increased rapidly in all scenarios, as 75% of the accuracy in year 10 after the commencement of recording is achieved within 2 to 3 years (Figure 1). The diminishing return of additional phenotypic records is because of a rapid approach to r(T,Tm), which has a value 0.54 in this study. This value gives the upper bound for the accuracy of the DGV, even with infinite phenotypic information, and indicates that the limiting factor after a few years of data collection is the number of SNP. The increase over time was almost equal for all scenarios. The highest accuracy of the DGV was achieved for a reference population of sires, cows and test bulls. A reference population of sires and cows resulted in a higher accuracy of the DGV than a reference population of sires and test bulls. The lowest accuracy was achieved for a reference population of sires only. For a trait with a heritability of 0.05, one has to genotype approximately 12 times as many cows as test bulls with 50 daughters to achieve the same accuracy of the DGV (results not shown).
The accuracy of the DGV rose to 75% of the accuracy in year 10 after 1 to 2 years of recording (Figure 2). Thus, the accuracy of the DGV increased even faster when the heritability of the trait was 0.15 compared with 0.05. The highest accuracy of the DGV was achieved for a reference population of sires, cows and test bulls, and the lowest accuracy was achieved for a reference population of sires. Furthermore, a reference population of sires and cows resulted in a higher accuracy of the DGV than a reference population of sires and test bulls. In general, the size of the heritability had a favourable effect on the accuracy of the DGV, and the difference between the four scenarios decreased as the heritability of the trait increased (Figures 1 and 2). If the heritability of the trait is 0.15, one has to genotype approximately 11 times as many cows as test bulls with 50 daughters to achieve the same accuracy of the DGV (results not shown).
Recording on a small scale
The accuracy of the DGV is higher if the reference population consists of 2000 cows instead of the sires of these cows, and the difference increases with time (Figure 3). It took 5 to 6 years to achieve 75% of the accuracy that was achieved in year 10. Thus, the increases in accuracy over time are more linear when the new trait is recorded on a small scale than when it is recorded on a large scale (Figures 1 and 3). This is because of the fact that the number of phenotypes is the limiting factor for a longer period of time before the number of SNP becomes limiting.
For both COWS and SIRES, the accuracies are higher for a trait with a heritability of 0.15 than for a trait with a heritability of 0.05 (Figures 3 and 4). The difference between the accuracies in the two scenarios is the same within each year, except the first and the last 2 years (Figure 4). The difference in accuracies between a reference population of cows and a reference population of the sires of the cows is greater if the heritability is 0.15 instead of 0.05 (Figures 3 and 4).
Discussion
We have shown that the inclusion of cows in the reference population increases the accuracy of the DGV for new functional traits considerably. Within a few years from commencement of recording, it is possible to establish a reference population including cows and to select for traits that are otherwise expensive or difficult to obtain phenotypes on. For small-scale recording the accuracy of the DGV will continue to increase for several years, whereas the increases in the accuracy of the DGV quickly decrease with large-scale recording. Our results also indicate that if fewer phenotypic records are available there is a larger effect of including cows in the reference population. In addition, a higher heritability will benefit a reference population of cows more than a reference population of bulls.
It is important to keep in mind that the accuracies of the DGV found in this study are not comparable with the correlations between DGV and deregressed proofs from validation studies on the basis of field data. The reason for this is that the information quantified in this study is based on LD information alone, whereas the markers used for prediction of DGV capture information on the genetic relationship and LD (Habier et al., Reference Habier, Fernando and Dekkers2007).
In a stochastic simulation study, Lillehammer et al. (Reference Lillehammer, Meuwissen and Sonesson2011) used a base reference population of 3000 progeny tested bulls to reflect the change from a progeny testing scheme to a breeding scheme with genomic selection. Their results showed that the accuracy decreases slightly over time in a turbo scheme where tens of bulls with daughter information are added to the reference population every year (Lillehammer et al., Reference Lillehammer, Meuwissen and Sonesson2011). This is because of the fact that the number of bulls added to the reference population every year in a turbo scheme is lower than the number of progeny tested bulls in the breeding scheme before genomic selection was introduced. The deterministic prediction model from Goddard (Reference Goddard2009) does not take into account the fact that animals in the reference population become less informative as time goes by. Thus, several years after the commencement of recording, the accuracies of the DGV may be lower in reality than the ones we present here. However, we believe that the shapes of the curves in Figures 1 to 4 are correct, as a historical reference population of progeny tested bulls does not exist for new traits.
The value of phenotypic information used for estimating marker effects increases relatively more for cows than it does for bulls as the heritability of the trait increases. This is the reason why the difference between a reference population of cows and a reference population of the sires of the cows increased in the scenarios with small-scale recording (Figures 3 and 4).
In a turbo scheme, offspring of a particular bull are selected before the daughters of that bull have phenotypic records. That is, the selection of young animals is based on the information on their grandparents. On the contrary, when a cow's offspring is about to be selected, the cow already has phenotypic information and it could be included in the reference population. Thus, the young animals are more closely related to the animals in the reference population if the reference population consists of cows or a combination of bulls and cows instead of bulls alone. The accuracy decreases as the number of generations between the selection candidates and the animals in the reference population increases (Meuwissen et al., Reference Meuwissen, Hayes and Goddard2001). We are not able to mimic this fact in the calculations set out above. However, we believe that reference populations of bulls alone would result in lower accuracies of the DGV in real life than the ones we calculated because of this time lag between information on bulls and selection candidates.
Large-scale recording
We took a chip with 50 000 SNP as our starting point. However, there are other types of chips on the market, for example, a low-density chip containing 3000 SNP and a high-density chip containing 800 000 SNP. It is likely that the accuracy of the DGV decreases if some of the animals in the reference population are genotyped with a low-density chip. This expectation is based on the fact that the proportion of SNP genotypes imputed correctly is high but less than unity. By way of example, the mean allele error rates were 4.0% and 2.1% in the Nordic and the French Holstein populations when imputing genotypes from a low-density chip to a chip with 50 000 SNP (Dassonneville et al., Reference Dassonneville, Brøndum, Druet, Fritz, Guillaume, Guldbrandtsen, Lund, Ducrocq and Su2011). Thus, before marker information based on a low-density chip is collected on a large scale, one has to decide whether the saving on costs of genotyping more than compensates for the decline in accuracies of the DGV.
In the long run, the costs of genotyping animals will most likely be reduced even further. In that case, it may become economically viable for the dairy farmers to genotype the production cows and the potential bull dams. By doing so, it may be possible to use DGV as a management tool for selecting replacement heifers on dairy farms using sexed semen or for using genomic optimum contribution selection in the most effective way (Weigel et al., Reference Weigel, de los Campos, Vazquez, Van Tassel, Rosa, Gianola, O'Connell, VanRaden and Wiggans2010). In addition, these cows should be included in the reference population. The accuracy of the DGV is 0.25 if the heritability of the trait is 0.05, and the reference population consists of 30 sires and 2000 cows. In comparison to that, the accuracy of the DGV is 0.46 or 0.49 if the heritability of the trait is 0.05, and the reference population consists of 30 sires with 500 daughters and 100 000 or 200 000 cows (results not shown). Thus, it is possible to achieve a reasonably high accuracy of the DGV for a new trait with a low heritability in a relatively short time if the costs of genotyping cows become low.
The artificial insemination (AI) companies have already spent money on genotyping, as we assume that the selection candidates are genotyped before selection. However, if the genotyping strategy for selection purposes is the same as the genotyping strategy used to add information to the reference population, then there is no additional cost. This is the case if males are genotyped and the reference population consists solely of sires, as in S, or if males and females are genotyped and the reference population consists of a combination of sires and the highest-ranking cows, as in S-C. Thus, these scenarios save on costs compared with S-C-TB and S-TB, which may be the most expensive scenarios among the ones we tested. The costs of S-C-TB and S-TB are high because it is expensive for an AI company to buy additional 170 bull calves and to stall them until they reach sexual maturity.
It is important that the prediction of genetic values for new traits remains accurate even when there are several generations between the selection candidates and the oldest animals in the reference population. For the accuracy of the DGV to persist across generations, Meuwissen and Goddard (Reference Meuwissen and Goddard2010) imply that the marker density needs to be high and that the reference population needs to consist of animals that are as distantly related to each other as possible. Therefore, it may not be the optimal solution to include the highest-ranking cows in the reference population, as the genotyped females are selected on the basis of PABV and consequently they are more closely related to each other than the population as a whole. Thus, in addition to the 30 sires, it may be a better strategy to include 2000 cows representing the entire population in the reference population, but it is also more costly than to include the 2000 highest-ranking cows, which are assumed to be already genotyped.
For large-scale recording, we assumed that the highest-ranking one-year-old females in the population were genotyped and subsequently included in the reference population when they have phenotypic records. However, it is most likely that dairy farmers consciously or unconsciously focus their attention on these cows as they are potential bull dams. Consequently, preferential treatment may be a problem. Thus, there is a lot to be said in favour of genotyping cows for the reference population that represent the entire population and already have phenotypic records. This could be done by random sampling of cows for genotyping or by using procedures that select cows for genotyping so that the genetic relationship between genotyped animals is minimized.
Small-scale recording
The accuracy of the DGV is higher for a reference population of cows than for a reference population of bulls. Therefore, it is most likely that a reference population of cows also results in a higher response to selection. The genotyped cows that have phenotypic records on the new trait can also contribute to the accuracy of the DGV for the traits that have been recorded for a long time. Thus, the costs of genotyping cows do not have to be covered by the genetic gain in the new trait alone.
The number of markers has a favourable effect on the accuracy of the DGV, because a higher marker density increases the likelihood of finding markers in strong LD with the QTL (Hayes et al., Reference Hayes, Bowman, Chamberlain and Goddard2009). Thus, it may be advisable to genotype the animals in the reference population with a high-density chip if the trait is recorded on a small scale and has a low heritability. We found that the accuracy of the DGV is 0.13 if the number of effective markers is 38 000, the heritability of the trait is 0.05, and the reference population consists of 2000 cows. All other things being equal, the accuracy of the DGV is 0.23 if the number of effective markers is 600 000 (results not shown). Thus, it is possible to achieve a substantial increase in the accuracy of the DGV by using a high-density chip. However, the benefit of using a high-density chip depends on the costs of genotyping and the costs of recording alike.
Validity of assumptions
The deterministic prediction model we used is relatively sensitive to small changes in the historical effective population size. Consequently, the assumed value of 750 in this study needs to be proven reasonable. The amount of LD over short distances is a function of the effective population size many generations back in time (Sved, Reference Sved1971). Hayes et al. (Reference Hayes, Visscher, McPartlan and Goddard2003) suggested to approximate the age of conserved segments by (2c)−1, where c is the length of the segment in Morgans. In this study, the average segment length is 7.9 × 10⁻⁴ M. Hence, the time elapsed over which these segments are expected to be conserved is therefore 633 generations. According to de Roos et al. (Reference de Roos, Hayes, Spelman and Goddard2008) and Kim and Kirkpatrick (Reference Kim and Kirkpatrick2009), the effective population size in cattle 633 generations ago was well above 750. Hence, the assumed value of 750 is a better estimate of the effective population size causing the present LD over short distances than estimates of the current effective population size in cattle populations. These are often smaller and will therefore overpredict the accuracy of the DGV.
We used a population of 30 000 first-parity cows in this study. For a larger population of cows, the reliability of the DYD for sires ( ) came close to one. When this happens, even small changes in
 are translated into proportionally large changes in Ve ,DYD, therefore the prediction formula is overly sensitive to
 when
 is close to one.
Acknowledgement
This research was financed by a grant from the Danish Ministry of Science, Technology and Innovation and Knowledge Centre for Agriculture, Cattle.