


Introduction
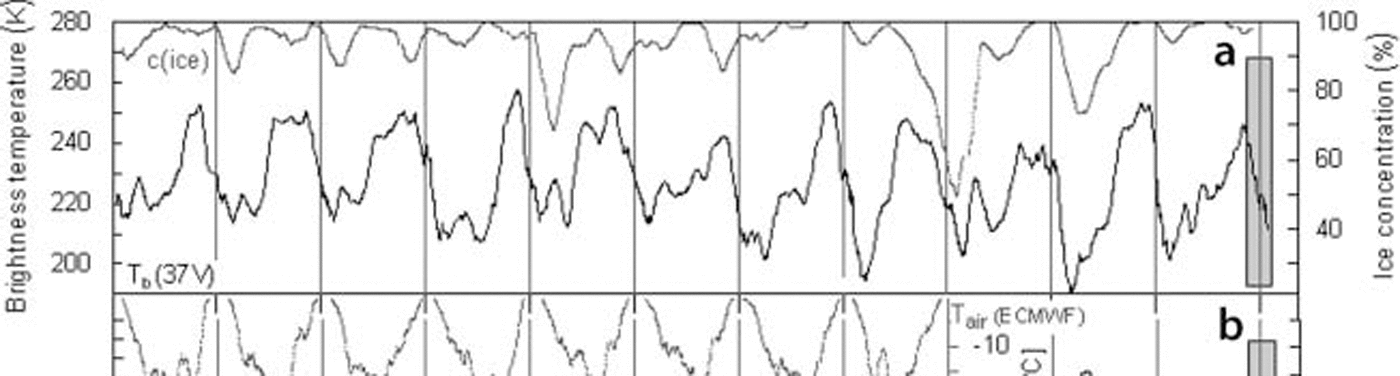
The seasonal cycle of microwave Surface Signatures has been Subject to Several Studies monitoring melt onset and freeze-up on Sea ice in the arctic (Reference AndersonAnderson, 1997; Reference Ulaby, K.Moore and K.FungWinebrenner and others, 1998; Reference Drinkwater and LiuDrobot and anderson, 2001) and antarctic (Reference Drinkwater and JeffriesDrinkwater and liu, 2000; Reference Gow, F.Ackley, R.Buck and M.GoldenHaas, 2001). once air temperatures approach or exceed the freezing point, melting causes the formation of liquid water within the Snowpack, which leads to the attenuation of microwaves and the increase of Surface emissivity (ε). this results in a conspicuous decrease in backscatter coefficients and increase in brightness temperatures, a feature that has been found to be characteristic for Summer Sea ice in the arctic. however, as Stated by Reference Davis, Dozier and A.T.C.Drinkwater (1998) and Reference Gow, F.Ackley, R.Buck and M.GoldenHaas (2001), the meltwater-induced decrease of radar Signals is not observed on perennial antarctic Sea ice. instead, Summer values of backscatter even exceed winter values, So the Summer Signal evolution is the opposite of what is found in most arctic Sea-ice regions (Reference Barber, Thomas, Papakyriakou, Tsatsoulis and KwokBarber and others, 1998; Reference Ulaby, K.Moore and K.FungWinebrenner and others, 1998). long-term Studies of passive-microwave data on Sea ice in the weddell Sea, antarctica, reveal the Same contradiction for the evolution of Surface brightness temperatures (Reference Jeffries, A.Shaw, Morris, L.Veazey and R.KrouseKern and heygster, 2001). the Seasonal cycle of Sea-ice brightness temperatures (T b) is characterized by a Sharp drop in Surface emissivity from the beginning of Summer to minimum values in late Summer, and a Subsequent increase during fall and winter to the maximum in Spring (fig. 1). the T b decrease cannot be exclusively triggered by low Sea-ice concentrations Since it is also found when ice concentrations are close to 100%.
(a) Seasonal cycles of SsM/I T b(37V) (bold line) and Bootstrap Sea-ice concentration (grey line), 1994–2005, at 66˚ S, 54˚W; 31 day moving averages. (b) Seasonal cycles of European Remote-sensing Satellite (ERs) 40˚ backscatter (C-band; 1994–2000) and QuiksCAT backscatter (Ku-band; 2000–05) (bold line), and T air from European Centre for Medium-Range Weather Forecasts (ECMWF) ERA-40 re-analyses (grey line), 1994–2001; 31 day moving averages. The IsPOL observational period is highlighted by a grey box.
One of the processes that generate the Specific evolution of Summer Signals in the antarctic is the metamorphosis of Snow, together with the formation of ice layers and Superimposed ice. the latter is triggered by internal Snow-melt, which eventually causes meltwater to percolate downwards and refreeze at the Snow/ice interface (Reference HaasHaas and others, 2001). the resulting metamorphous overlying Snow with increased grain Sizes and ice layers enlarges the microwave volume- and Surface-scattering intensities (Reference Gow, F.Ackley, R.Buck and M.GoldenHaas, 2001) and reduces the emissivity Significantly. the formation of Superimposed ice from Snow has been observed at the Snow/ice interface of drifting pack ice in the antarctic during Several field campaigns (Reference Garrity and CarseyGow and others, 1987; Reference Ackley and SullivanAckley and Sullivan, 1994; Reference Hellmer, Dieckmann, Haas and SchröderJeffries and others, 1994; Reference Drobot and AndersonEicken, 1998; Reference HaasHaas and others, 2001). however, extensive ponding and complete melting of the Snow cover, as observed in the arctic, are rarely reported from antarctic Sea-ice regions. this discrepancy in Surface processes during Summer between arctic and antarctic (Reference Kern and HeygsterNicolaus and others, 2006) is expressed in the different evolution of T b and radar backscatter. therefore, to identify melt-specific patterns on antarctic Sea ice from remote-sensing data, the processes involved in the Summer-season evolution of T b and backscatter need to be closely investigated.
In this Study, we report results from comprehensive physical investigations of ice and Snow properties, atmospheric conditions, as well as Satellite-derived T b of Sea ice. the measurements were performed in the western weddell Sea during a 5 week drift Station in the 2004/05 austral Summer. these time Series provide insight into Snow and Sea-ice Surface processes at the transition to Summer. based on our data, we presume that freeze–thaw cycles, Snow metamorphosis, grain-size growth and the formation of ice layers cause the high variability and observed decrease in T b. these processes have profound consequences for remote-sensing Studies on antarctic Sea ice in Summer.
Data and Methods
From 27 november 2004 to 2 january 2005, the german research vessel Polarstern drifted with an ice floe through the western weddell Sea during the ice Station polarstern expedition (ispol; Reference Hanesiak, G.Barber and M.FlatoHellmer and others, 2006). the drift Started at approximately 68.04˚ S, 54.88˚w, where Polarstern was initially anchored to an ice floe of 10 km×10 km Size. the ispol floe was predominantly composed of 2 m thick Second-year ice (syi) and Smaller amounts of 0.9–1.8 m thick first-year ice (FYI), with average Snow heights of 0.8 and 0.3 m, respectively. during ispol, Several field Stations were established on the ice for continuous meteorological and glaciological measurements of Snow and ice properties and their dependence on atmospheric boundary conditions. the measurements included data from an automatic weather Station (aws) that recorded wind Speed, wind direction, air temperature (T air), Sea-level pressure and relative humidity at 2m as well as long- and Shortwave radiation components. the aws was Set up close to measurement Sites of characteristic Snow thicknesses. at each Site, vertical profiles of Snow wetness, Snow density and Snow temperature were measured up to Six times a day with a vertical Spacing of 5 cm. in order to investigate the amplitude and phase of the diurnal Snow temperature cycle and the time of its maximum, measurements were performed every 3 hours for more than a week at the beginning of ispol. Snow wetness in percentage liquid-water content was measured with a dielectric resonator probe (toikka Snow fork, espoo, finland; Reference Nicolaus, Haas, Bareiss and WillmesShivola and tiuri, 1986), and Snow temperature was determined with a hand-held pt-100 thermometer. Snow measurements were performed on both ice types with their characteristic Snow thicknesses. we estimate the accuracy of our wetness measurements to be on the order of only ±1% liquid-water content. therefore we present only averages over a vertical Sampling range from each profile.
We obtained Special Sensor microwave images (ssM/I) Swath data for the ispol period from the global hydrology resource center (ghrc). the T b for the pixel containing the ispol position and the Surrounding area were computed from Swath images of horizontally polarized 19ghz (19h), and vertically polarized 37ghz (37v), T b. an indicator for the Strength of the diurnal T b amplitude was derived by averaging the T b(37v) from passes between 0500 and 1100 h local time (lt) to ‘early T b’ (am T b), and passes between 1700 and 2300 h lt to ‘late T b’ (pm T b). the 37v channel is chosen because this Shows the Strongest diurnal variations. the diurnal T b amplitude (DT ba) was calculated as DT ba = pm T b–amT b. moreover, we computed the cross-polarized gradient T b ratio (xpgr, Similar to Reference Abdalati and K. SteffenAbdalati and Steffen, 1997) by calculating the ratio of 19h/37v. variations in this parameter are mainly caused by varying differences in emission depth of both channels which can be induced by internal Snowmelt and Snow Surface metamorphosis. Since xpgr was initially used to detect the onset of melt (Reference Abdalati and K. SteffenAbdalati and Steffen, 1997), we derived this parameter to See how its evolution is related to measured Snow wetness and Swath T b.
At the end of the expedition, time Series of Satellite data and ground measurements from the drift Station were combined into a comprehensive dataset that contains Space-borne and in Situ records from the region of the ispol floe. gridded daily mean SsM/I data were provided from the us national Snow and ice data center (NsIDC) for the period 1995–2005 to integrate the ispol measurements into the long-term evolution of T b in this region. time Series of radar backscatter at 5.3 ghz (c-band), from january 1994 to december 2000, and 13.8ghz (ku-band), after january 2001, were computed from european remote-sensing Satellite-1 and -2 (ers-1/-2) Scatterometer (escat) and quikscat data, respectively. these were provided by the centre ers d’archivage et de traitement (cersat) of the institut français pour l’exploitation de la mer (ifremer), france.
Results
Time Series of daily mean 37v SsM/I T b and quikscat backscatter at the ispol drift positions are presented in figure 2 for the period 1 october 2004 to 10 february 2005 (see fig. 1 for a comparison with the long-term development at this position). the ispol observational period is highlighted by a grey box. from careful examinations of quikscat backscatter maps of the ispol region, we assume that the microwave Signatures are typical of predominantly Syi, as was also the case for the ispol floe itself (see above). the T b is at a level of approximately 245 k in mid-november 2004 before it begins to decrease to approximately 190 k at the beginning of february 2005. this decrease is characterized by Strong oscillations of up to 60 k within only 5 days and represents the typical Summer T b drop in the western weddell Sea (fig. 1). the Scatterometer Signals behave in the opposite way: backscatter coefficients begin to increase in mid-november and reach their Summer maximum at the beginning of february. a remarkable T b minimum in mid-december is complemented by a local backscatter maximum, a feature that occurred parallel to low air temperatures, as is discussed below.
Time Series of daily mean SsM/I brightness temperature (37V) and QuiksCAT backscatter coefficient (13.4 GHz) at the IsPOL position, 1 October 2004 to 10 February 2005. Black lines represent 21 day moving averages. The period with coincident in Situ measurements during IsPOL is highlighted by a grey box (cf. Fig. 1).
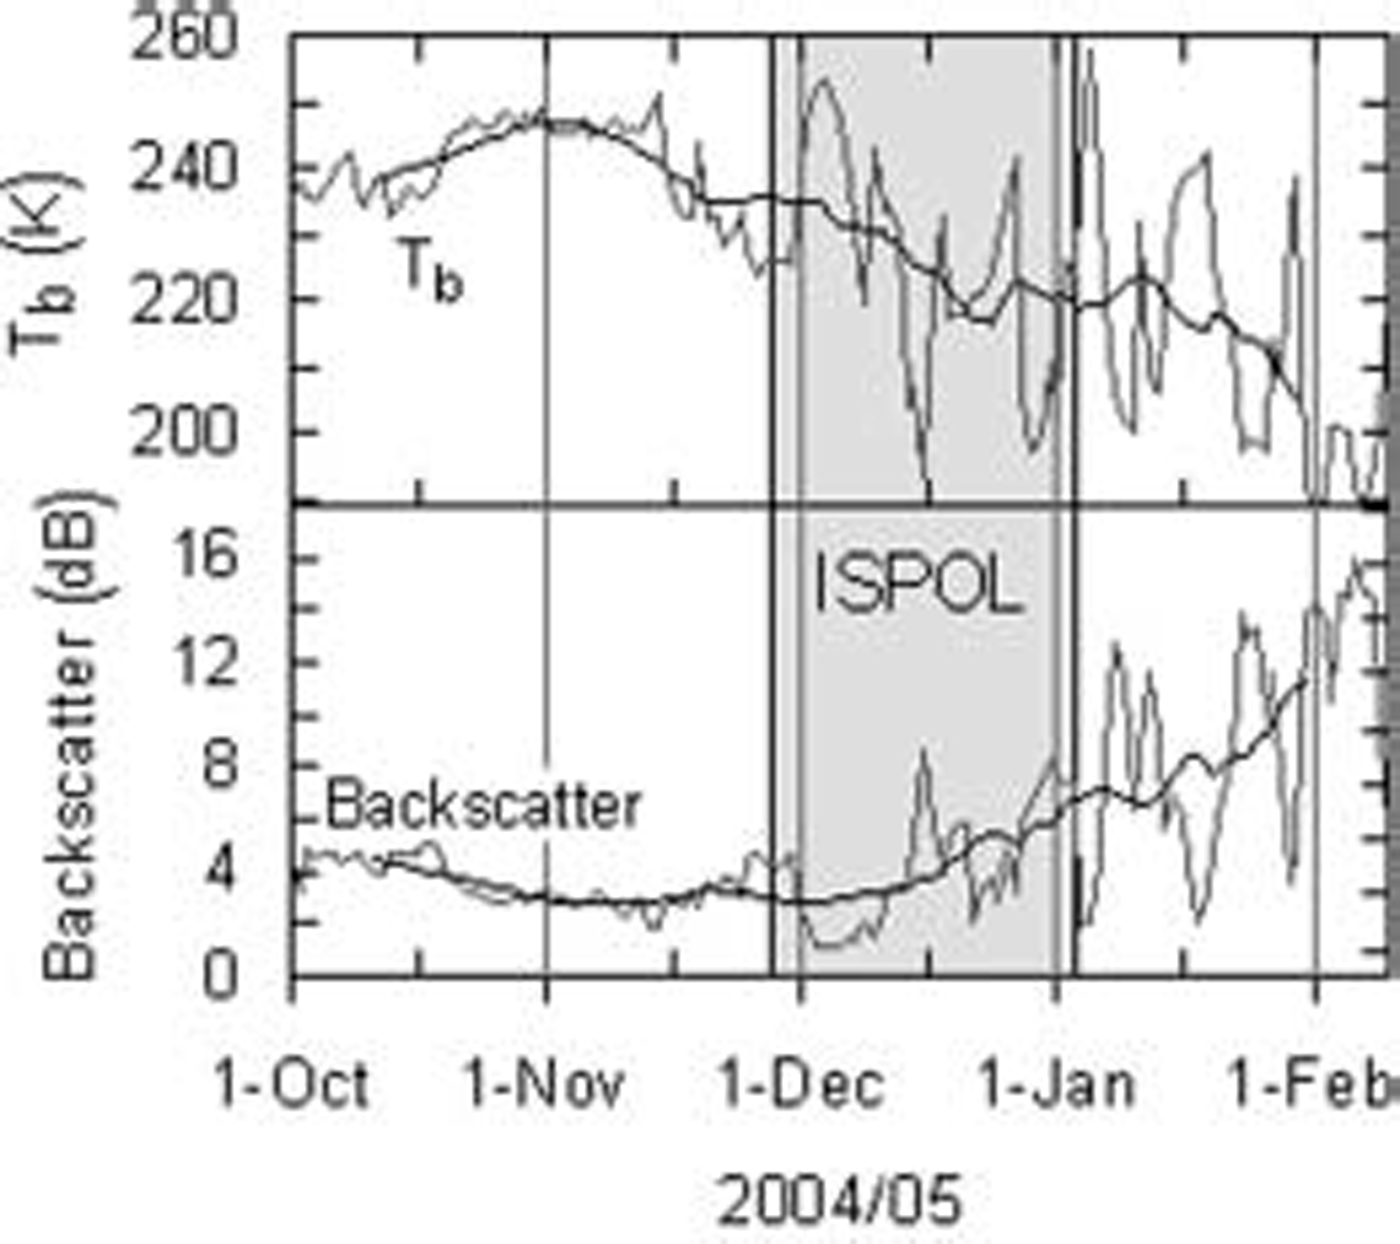
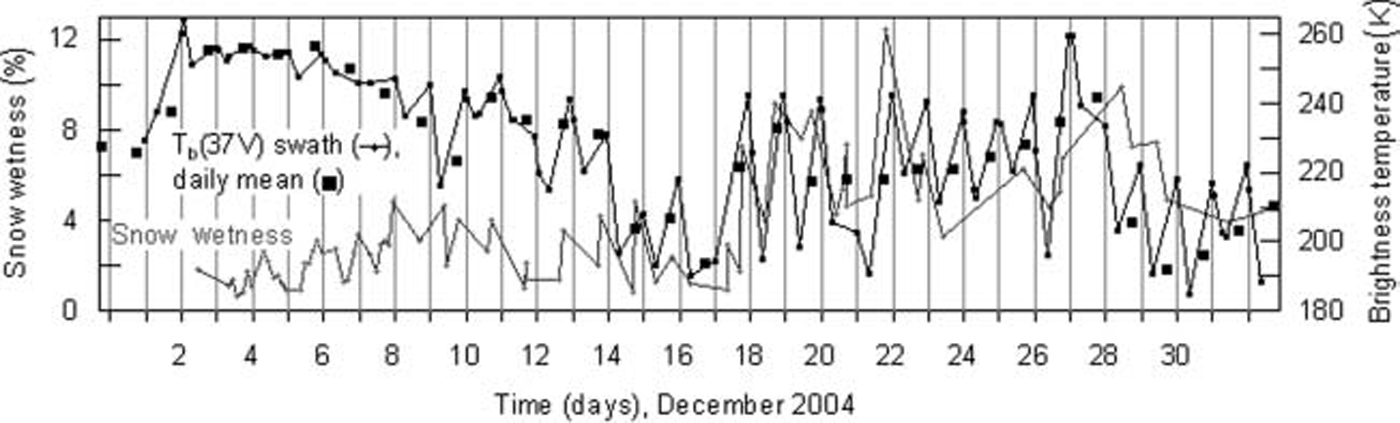
figure 3 focuses on the period with ispol measurements, Showing T b values derived from Swath data plotted at the hour of their acquisition. the T b minimum in mid-december (fig. 2) also appears in the Swath data. obviously, the Strength of the diurnal T b cycle is more or less continuously increasing during this month. immediately after the minimum at 16 december, the diurnal T b cycle Strengthens Significantly, with low T b in the morning and high tb in the late evening hours. this evolution is well correlated with the evolution of Snow wetness. the mean wetnesses computed from each vertical profile are Shown. wetness oscillates Similar to the T b. additionally, after 16 december, Snow wetness increased from about 3% to 8% volumetric water content and oscillated with higher amplitude around higher values. thus, the typical Summer drop in T b is accompanied by increasing diurnal T b oscillations which are caused by variations in Snow wetness.
Time Series of SsM/I Swath T b (black line with Small circles), daily mean T b (black Squares) and vertically averaged Snow wetness (grey line with circles), December 2004.
Aws measurements of T air, daily Sums of global radiation, K *, and daily Sums of longwave downward radiation, L↓, are presented in figure 4. the evolution of T air Shows a minimum of –4˚c at 16 december, when the T b minimum is also observed. the T air minimum resulted from a high-pressure System (1010 hpa at 16 december) centered over the Southwestern weddell Sea. this was responsible for prevailing clear Skies, and hence high fluxes of K * and low fluxes of L↓. the weakening of the high pressure was coupled with an air mass exchange as radiosonde data indicate: wind direction changed from South to north, and warmer air with higher moisture content was advected. afterwards, Snow wetness increased, although the atmospheric energy fluxes did not change Significantly. the mean Surface heat balance during ispol was positive, with a heat gain of just a few wm–2 for the Snow Surface. therefore, Snow thickness decreased by not more than 0.2–0.3 m. Sensible and latent heat fluxes were predominantly directed upwards due to cooling of the Snow by cold, dry air (Reference Andreas and AckleyAndreas and ackley, 1982; Reference Kern and HeygsterNicolaus and others, 2006). the albedo decreased only Slightly, from 0.87 to 0.73, which is not enough to trigger Significant Snowmelt–albedo feedback processes. we observed increasing Snow grain Sizes, the formation of ice layers and Some Superimposed ice while T b decreased.
Time Series of air temperature (T air), daily mean T air, daily Sum of global radiation (K*) and daily Sum of longwave downward radiation (L↓) as measured by the AWs on the ISPOL floe, December 2004. Measurement gaps are due to rescues of the AWs when the floe broke up.

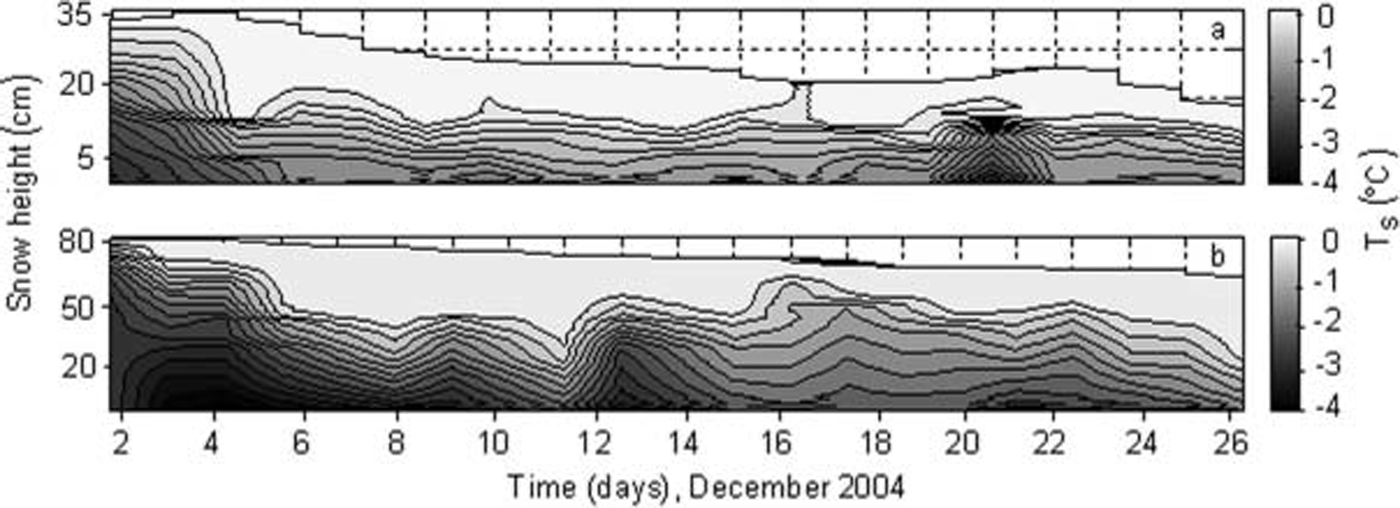
As Shown in figure 5, Snow temperatures, T s, increased during ispol in both thick and thin Snow. the temperature at the Snow–ice boundary was lower under thick Snow (–4˚c) than under thin Snow (–2.5˚c). the 0˚c isotherm moved Significantly downwards at the beginning of december but did not reach a depth of more than 50% of the total Snow height, even during daytime with maximum Surface temperatures (1300 h lt). at 16 december, when T air was low, the upper Snow layers also Showed very low temperatures. Snow height decreased more in thin Snow over FYI patches.
Evolution of Snow temperature profiles, T s, at the time of day of maximum Surface temperatures (1300 h LT) over FYI (a) and SYI (b) on the IsPOL floe, December 2004.
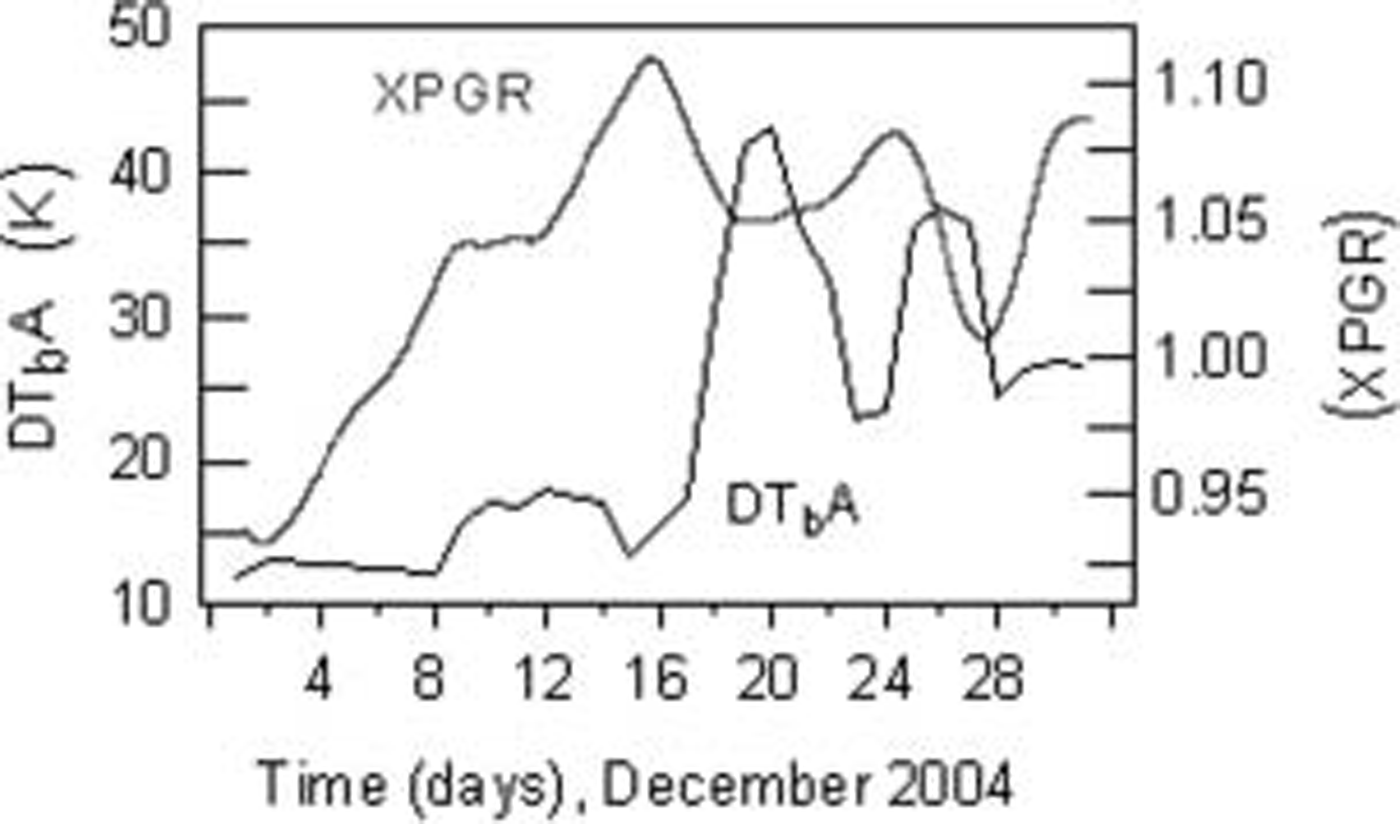
As discussed with respect to figure 4, the Strength of the diurnal T b amplitude (DT ba) increases during december, especially after 16 december, when average Snow wetness increased (fig. 6). also, xpgr increases at the beginning of december and reaches a higher level of values after 16 december (fig. 6). the rise of this parameter was found for all the years 1995–2005 on perennial antarctic Sea ice.
Time Series of the XPGR parameter (19H/37V, 3 day moving average) and the diurnal T b amplitude from SsM/I Swath data (DT bA, 3 day moving average), December 2004.
Discussion
Here we have to consider that the ispol floe was composed of different ice types, predominantly 2m thick Syi with patches of 0.9–1.8m thick FYI. this means that processes typical for both ice types are Superimposed on each other in the mixed pixel that Supplied the time Series of Satellite data for ispol. an intensive comparison of field measurements and Satellite data from ispol reveals that the daily mean T b is decreasing during december 2004. Superimposed on this, we found a diurnal T b cycle that is well correlated with variations in internal Snow wetness. this is driven by a combination of diurnal T air variability and Shortwave radiation input Since we found predominantly low values of Snow wetness in the morning and high values in the evening hours (fig. 3). the observed total decrease of T b in the weddell Sea is accompanied by increasing backscatter coefficients over the perennial Sea ice during Summer. this observation is the opposite of the backscatter behaviour of Seasonal antarctic Sea ice used by Reference Drinkwater and JeffriesDrinkwater and liu (2000) whose melt-onset criterion was a decrease in backscatter. we Suspect that this behaviour is due to flooding, when the freeboard of the deteriorating ice becomes negative due to Strong bottom melt.
Reference Eicken and JeffriesGarrity (1992) found that T b in the weddell Sea increases for a Snow wetness of 0–1% and decreases for higher free water content associated with Slush. we have measured Snow wetness values of 2–4% at the beginning of december when the daily mean T b was at its maximum during ispol (fig. 3), and 6–8% after 16 december. as Stated in Reference shivola and TiuriUlaby and others (1986), the emission depth for 37 ghz is only on the order of 2 cm (and 8 cm for 19 ghz) when the top Several centimeters reach 2% or greater liquid-water content. Reference Davis, Dozier and A.T.C.Davis and others (1987) found that emission at 35 ghz reaches its black-body limit with 5–6% liquid water in the top 3 cm of Snow. from this, we See that Snow reached a very high emissivity and consequently high T b when it was wet in the evening (8% after 16 december). emissivity and T b decreased again when wetness was low in the early morning (fig. 3). although the accuracy of our Snow-wetness measurements is only ±1% at best, a confident diurnal wetness cycle which was most pronounced after 16 december was measured. this cycle causes the decrease of emissivities when the wet Snow refreezes. the observed repeated thawing and refreezing (‘freeze–thaw-cycles’) during december 2004 led to a change of the internal Snow Structure. we observed increasing grain Size (roughly: from <1mm at the beginning to approximately 3 mm at the end of ispol) while the daily mean T b dropped and backscatter increased. thus, while continuous Snow wetting would cause increasing emissivities and decreasing volume Scattering, the refreezing of Snow during repeated freeze–thaw cycles has the opposite effect.
The fact that emissivity is close to its black-body limit after 16 december is probably represented in the evolution of xpgr. we derived this parameter in order to See how its evolution correlates with measured Snow wetness and Swath T b. xpgr exceeds a value of 1, which means that T b(19h) becomes larger than T b(37v). this applies theoretically, when the contribution of lower Snow layers to the total Signal increases as these layers are more represented in the 19h channel which has a higher emission depth compared with 37v. thus, an increase of xpgr could reflect a downward progression of the 0˚c isotherm in the Snow. this increase Stops when the Snow becomes opaque for both channels Since it reaches its black-body limit. nevertheless, we assume that the Strength of the typical xpgr rise in early Summer Supplies a Significant indicator for melting in the upper Snow layer.
The variations of Snow wetness were mostly limited to the upper 20–30 cm of Snow. this resulted from the low atmospheric downward energy fluxes. they were never Sufficient to heat more than this upper Snow layer to the melting temperature of 0˚c (Reference Kern and HeygsterNicolaus and others, 2006), as is Shown in figure 5. rising air temperatures at the beginning of ispol (1–3 december; fig. 4) caused a downward progression of the isothermal melt Snow layer and, hence, increasing daily mean T b (fig. 3). after that, the air temperature oscillated around the freezing point. this induced freeze–thaw cycles that kept the melt Snow-layer depth constant and caused the diurnal T b amplitude to increase. this evolution is interrupted by cold air temperatures at 15 and 16 december, decreasing the depth of the 0˚c isotherm (fig. 5).
Reference ColbeckColbeck (1974) has categorized the Saturation regimes in wet Snow as either pendular or funicular, i.e. low or high water Saturation, respectively. we assume that the observed wet Snow represented the pendular regime, Since the amount of water was apparently Still too low to percolate downwards and, hence, transport heat to lower Snow layers. this would have caused a more rapid downward progression of the 0˚c isotherm, which was not observed (fig. 5). as a consequence, Superimposed ice formed only rarely, as the Snow was not Saturated with meltwater. we found diurnal Snow processes (Reference Haas, N.Thomas and BareissHanesiak and others, 1999) to be of great importance for the Seasonal cycles of T b and radar backscatter in the ispol region. Short daily Snowmelt events, decreasing emissivity and enhancing volume Scattering (snow metamorphism, grain-size growth) are dominant over Strong melt, increasing emissivity and decreasing volume Scattering (Reference Abdalati and K. SteffenAbdalati and Steffen, 1997; Reference AndersonAnderson, 1997). the enhanced contribution of diurnal thaw variations at low atmospheric energy fluxes on the Snow cover is the main difference between our Study region and arctic Sea-ice regions (Reference Kern and HeygsterNicolaus and others, 2006), where melting progresses almost continuously and rapidly once Started. from these findings, we Suggest that the progression and the Strength of diurnal freeze–thaw cycles can be monitored by means of T b Swath data. this might lead to approaches for the detection of melt-specific patterns on antarctic Sea ice by means of remote-sensing data.
Conclusions
Ispol offered the unique opportunity to Sample ground data during the characteristic Summer drop of Sea-ice T b, which represents a dominant feature of the Seasonal T b cycle in the western and central weddell Sea. passive-microwave data Show that the beginning of this T b decrease is accompanied by an increase in diurnal T b amplitudes which also causes the high Signal oscillations at this time of year. field data indicate that the diurnal cycle of Sea-ice T b is directly related to the observed freeze–thaw cycles in the Snow volume.
We assume that repeated diurnal freeze–thaw cycles are widespread in the antarctic and dominate the cascade of Summer Surface processes on Sea ice. this is the main way in which Surface processes differ from those in arctic Sea-ice regions, where melting progresses rapidly and almost continuously once Started. thus, existing algorithms for the detection of melt onset (Reference Drinkwater and JeffriesDrinkwater and liu, 2000; Reference Drinkwater and LiuDrobot and anderson, 2001; Reference Belchansky, C.Douglas, N.Mordvintsev and G.PlatonovBelchansky and others, 2004), that are based on the effect of increasing emissivities after increasing Snow wetness, do not provide reasonable results when applied in perennial antarctic Sea-ice regions under the present climate. however, with increased Summer air temperatures and different Surface energy fluxes in the antarctic (Reference Kern and HeygsterNicolaus and others, 2006), the Seasonal cycle of T b could reverse and might make arctic algorithms applicable.
Satellite monitoring of the Strength of the diurnal T b cycle gives insight into the temporal and Spatial variability of freeze–thaw cycles. therefore, we Suggest that future algorithms for the detection of melt-specific patterns on antarctic Sea ice Should take these findings into account.
Acknowledgements
We are very grateful to d.k. perovich, j. comiso and an anonymous reviewer for their most useful and constructive comments. we also thank the members of the ispol expedition for discussions and for help during fieldwork. discussions with S. kern were highly appreciated. gridded SsM/I data were kindly provided by NsIDC, Scatterometer data by ifremer, and SsM/I Swath data by the ghrc. this Study is partly funded by the deutsche forschungsge-meinschaft under contract ba 2060/2-2 and ha 2724/4-2.



