I. INTRODUCTION
Copper and copper alloys are extensively used in automobile, constructional, and electrical components. Among copper alloys, Cu–Be alloys show premier mechanical properties, high corrosion resistance, good thermal and electrical conductivity along with nonsparking behavior, and good formability during cold and hot metal working processes. Due to these properties, Cu–Be alloys are used in explosion activities in mines and engine chambers, where sparking may prove hazardous.Reference Nagarjuna, Srinivas, Balasubramanian and Sarmat1–Reference Szkliniarz, Blacha, Szkliniarz and Łabaj4 However, Cu–Be alloys are relatively costly. Also, Be compounds are toxic and so, there are health risks when exposing them to atmosphere during processing, such as melting, cutting, welding, casting, grinding, and hot deformation operations.Reference Nagarjuna, Srinivas, Balasubramanian and Sarma5 Due to their toxic characteristics, there has been a complete ban on use of Be compounds for many years in European Union countries.Reference Szkliniarz, Blacha, Szkliniarz and Łabaj4 This led to an extensive research to develop low cost and nontoxic Cu alloys.Reference Nagarjuna, Srinivas, Balasubramanian and Sarmat1–Reference Semboshi, Hinamoto and Iwase7 Cu–Ti alloys have been found to be a suitable substitute for Cu–Be because of good mechanical strength, superior corrosion resistance, fine electrical conductivities, and better antiseptic properties.Reference Nagarjuna, Srinivas, Balasubramanian and Sarmat1,Reference Nagarjuna, Srinivas, Balasubramanian and Sarma2 Owing to these properties, Cu–Ti alloys are used for improvement in quality of silicon solar cells,Reference Dehghan, Esfandyarpour, Behnam, Asl, Mohajer and Maleki8 heat transfer applications,Reference Nagarjuna6 electronic devices, such as relay controls and connectors,Reference Semboshi, Hinamoto and Iwase7 and biomedical applications.Reference Kikuchi, Takada, Kiyosue, Yoda, Woldu, Cai, Okuno and Okabe9
It is known that ultrafine-grained or nanostructured materials have high mechanical strength, however, poor ductility at room temperature.Reference Dieter10 Fine grains cause less accumulation of dislocations near grain boundaries and cause low strain hardening and subsequently, poor ductility.Reference Jia, Wang, Ramesh, Ma, Zhu and Valiev11,Reference Zhu and Liao12 Materials with low stacking fault energy tend to generate mechanical twins during deformation which can improve their ductility without much loss of strength.Reference Zhao, Bingert, Liao, Cui, Han, Sergueeva, Mukherjee, Valiev, Langdon and Zhu13 Ultrafine grains have been effectively developed by various severe plastic deformation (SPD) techniques such as accumulative roll-bonding,Reference Anne, Ramesh, Shivananda Nayaka, Arya and Sahu14–Reference Anne, Ramesh, Shivananda Nayaka, Arya and Sahu16 multiaxial forging (MAF),Reference Chen, Shu, Hu, Zhao and Yuan17–Reference Gupta, Srivastava, Kumar and Panthi19 high pressure torsion,Reference Horita and Langdon20,Reference Ivanisenko, Kulagin, Fedorov, Mazilkin, Scherer, Baretzky and Hahn21 repetitive corrugation and straightening,Reference Huang, Zhu, Alexander, Liao, Lowe and Asaro22,Reference Sunil23 equal channel angular pressing,Reference Gopi, Nayaka and Sahu24–Reference Gopi, Shivananda Nayaka and Sahu26 constrained groove pressing,Reference Shin, Park, Kim and Park27,Reference Yadav, Sinhal, Sahu, Roy and Shekhar28 machining,Reference Swaminathan, Ravi Shankar, Rao, Compton, Chandrasekar, King and Trumble29,Reference Yadav, Sahu, Subramaniam and Shekhar30 and cryo-rolling.Reference Subramanya Sarma, Sivaprasad, Sturm and Heilmaier31 Among these SPD techniques, MAF is considered as a simple process, where the material is forged sequentially in three orthogonal directions. Thus, even after several cycles of forging, original shape of the material remains unaltered. Also, the microstructures generated in this fashion are homogeneous and isotropic in terms of mechanical properties, which are generally not found in most of the other SPD processes. Compared to cold/hot deformation, MAF at cryogenic temperature can produce more refined microstructure, as recovery and recrystallization are completely suppressed at cryogenic temperature, resulting in high dislocation densities and other defects, especially in materials having low stacking fault energy.
There have been several studies relating to the evolution of microstructure and mechanical properties of materials, processed by MAF at room temperature.Reference Gupta, Srivastava, Kumar and Panthi19,Reference Huang, Zhu, Jiang and Lowe32,Reference Ning and Wang33 Huang et al.Reference Huang, Zhu, Jiang and Lowe32 observed improvement in yield strength (YS) and ductility of Cu–6% Al alloys by MAF at room temperature through enhancement in strain hardening rate. Padap et al.Reference Padap, Chaudhari, Nath and Pancholi34 witnessed the enhancement in mechanical properties due to the reduction of grain size from 30 to 0.5 µm by the MAF process in hot condition for low carbon steel. Chen et al.Reference Chen, Shu, Hu, Zhao and Yuan17 used MAF for processing AZ61 magnesium alloys at different temperatures and were able to reduce grain size up to 8 µm from 131 µm for the as-received material. Gupta et al.Reference Gupta, Srivastava, Kumar and Panthi19 processed high lead bronze tin (Cu–17% Sn–4.5% Pb–6% Zn) through MAF and reported that an increase in deformation strain (during 1, 2, and 3 cycles) steadily improves homogeneity in terms of various microstructural parameters such as grain size, twin spacing, twin lamellae thickness, and dislocation density. Rao et al.Reference Rao, Singh and Jayaganthan18 processed Al6061 alloys through MAF at cryogenic temperature to obtain ultrafine grain structure and consequently, improvement in mechanical properties. Dasharath et al.Reference Dasharath and Mula35 found better tensile properties with YS of 680 MPa and 7% ductility during MAF of Cu–9.6% Zn alloys at cryogenic temperature. Furthermore, ultrafine grained microstructure was developed with high dislocation density because of low stacking fault energy.Reference Gupta, Srivastava, Kumar and Panthi19,Reference Ning and Wang33,Reference Dasharath and Mula35
From the above-mentioned studies, it is clear that MAF can be used to improve both ductility and strength in Cu-based alloys. Studying the effect of MAF at cryogenic temperature on Cu–Ti alloys can expand its applications to a larger extent. The objective of the present work is to study the influence of multiaxial cryo-forging on microstructural changes and mechanical properties of the Cu–3% Ti alloy. The alloy was processed by MAF at cryogenic temperature up to 3 cycles. Microstructural evolution, mechanical behavior, and fracture surface morphology of MAF-processed alloys were assessed using different characterization methods and mechanical tests.
II. EXPERIMENTAL PROCEDURE
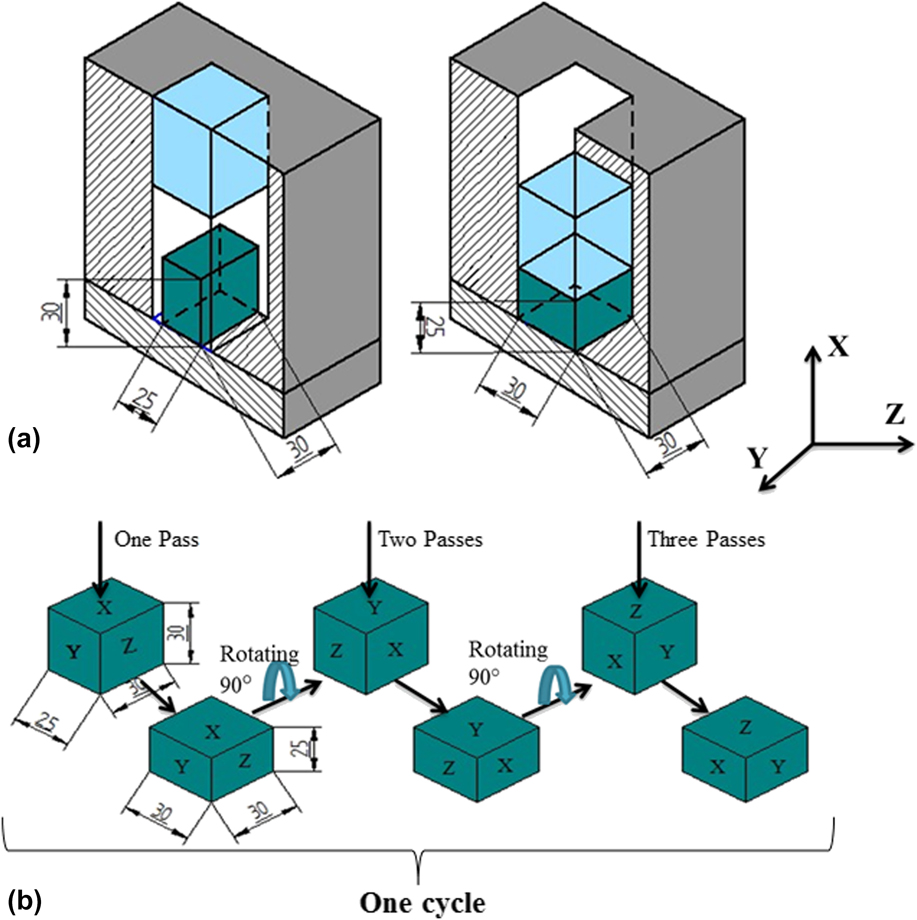
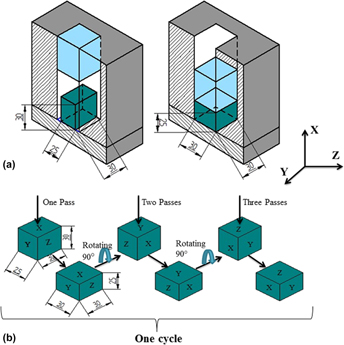
The Cu–3% Ti (wt%) alloy was purchased from Pahwa Metal Tech Pvt. Ltd., Pune, India, and machined into 30 × 30 × 25 mm rectangular plates. These plates were exposed to homogenization treatment at 850 °C for a period of 24 h and hereafter, referred to as ‘as-received’ condition. These homogenized samples were used for the MAF treatment in plane strain condition with a split die, as displayed in Fig. 1(a). The split die was fabricated using a hot die steel material and aligned with four bolts. The load was applied and pressed using a 200 ton capacity universal testing machine (UTM). Initially, the as-received samples were retained in liquid nitrogen for 20 min at a temperature of −195 °C to attain the saturation temperature of liquid nitrogen until the formation of bubbles was stopped. Then the samples were subjected to forging, during which the sample temperature is maintained at −80 ± 10 °C. During successive passes, the samples were immersed in liquid nitrogen for 5 min to attain saturation temperature. During first pass of MAF, the longer side of the sample was kept at the center of die hole in the X–Y direction and then forged using molybdenum disulphide (MoS2) as the lubricant. One cycle of the MAF process consists of 3 passes, where the sample is rotated by 90° to retain initial or original dimension of 1.21:1.21:1 ratio constant throughout the process, and the procedure was repeated during every pass, as represented in Fig. 1(b). MAF die was designed to impose an equivalent strain of 0.182 during every pass on the sample as per the equation, ε = ln(h 0/h), where h 0 is the initial height of the processed sample and h is the final height of the processed sample.Reference Vendra, Goel, Kumar and Jayaganthan36 Total strain induced after one MAF cycle (i.e., after 3 passes) is 0.546. MAF was restricted to 3 cycles because the formation of cracks was observed during 4th cycle.
Schematic of (a) MAF die and (b) MAF process flowchart corresponding to one cycle.

Microstructural analysis was carried out for as-received, 1, 2, and 3 cycle MAF-processed samples. For this, the mid-thickness region of the samples were sectioned in a direction perpendicular to the final MAF pass direction and used for microstructure and mechanical property evaluation. The samples were ground mechanically in sequence with SiC papers with different grades (400–2000 grit) followed by cloth polishing with 1 µm Al2O3 suspension to achieve mirror finish. Polished samples were etched to reveal the microstructure. The etchant consists of 10 g potassium dichromate (K2Cr2O7), 95 mL distilled water, 5 mL H2SO4, and 2 mL HCl. During etching, the samples were dipped in the etchant for 3 s and dried instantly. Microstructures were observed under an optical microscope (OM) and a scanning electron microscope (SEM; JEOL-JSM 6380LA, JEOL USA Ltd., Peabody, Massachusetts). Using the linear intercept method, the average grain size was calculated by using ImageJ, a freeware software, developed by National Institute of Health, Bethesda, Maryland.Reference Schneider, Rasband and Eliceiri37 Shear band formation and dislocation densities were witnessed by using a transmission electron microscope (TEM; JEOL-JEM 2100, JEOL USA Ltd., Peabody, Massachusetts). TEM samples were prepared by mechanical polishing of the sliced samples within the range 30–40 µm thickness. The polished samples were punched to discs having diameter 3 mm followed by dimpling to reduce the thickness to 25–30 µm. Finally, dimpled samples were perforated using ion milling (Gatan-PIPS 691, Gatan Inc., Pleasanton, California). To carry out orientation imaging microscopy (OIM), MAF-processed samples were electropolished at 10 V for 15 s at a temperature of −25 °C using Struers D2 electrolyte (Struers Ltd., Ontario, Canada), to achieve a strain-free surface appropriate for OIM analysis. Electron backscatter diffraction (EBSD) was performed using Oxford instruments with a ‘Nordlys’ detector (Oxford Instruments, Abingdon, United Kingdom) coupled to a field emission scanning electron microscope (FESEM; JEOL JSM-7100F, JEOL USA Ltd., Peabody, Massachusetts) at a step size of 0.5 µm. Acquired EBSD data were analyzed using HKL channel 5 software (Oxford Instruments, Abingdon, United Kingdom). X-ray diffraction (XRD) was performed to find out the elemental phases present in as-received and MAF-processed samples. XRD was equipped with a diffractometer having a Ni filter activated at 20 mA and 30 kV through Cu-kα radiation. The samples were scanned at the rate of 2° per minute and diffraction angle (2θ) ranging between 30° and 90°. Cylindrical dog-bone-shaped tensile samples were prepared with 16 mm gauge length as per ASTM E8M standard. Tensile tests were carried out at a cross-head speed of 0.5 mm/min using Shimadzu UTM (AG-X plus™-100 KN, Shimadzu Analytical Pvt. Ltd., Mumbai, India) at room temperature. Microhardness was conducted on processed samples using a Vickers microhardness tester (Omni-tech, Maharashtra, India) by applying a load of 100 g for 15 s.
III. RESULTS AND DISCUSSION
A. Microstructural analysis
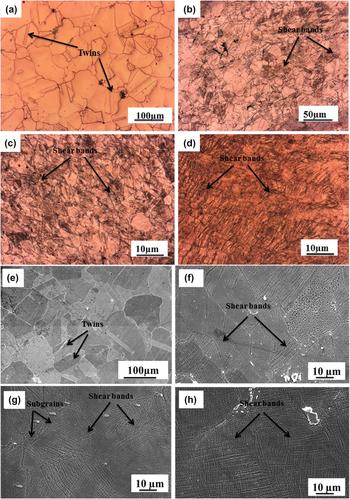
Figures 2(a)–2(d) show optical micrographs of as-received and MAF-processed samples. It is observed that the as-received Cu–3% Ti alloy has equiaxed grains with some twins [Fig. 2(a)]. The average grain size was found to be ∼80 µm for the as-received condition. Figures 2(b)–2(d) clearly show ultrafine grains formation during MAF at cryogenic temperature. Figure 2(b) shows that deformation/shear bands formed within the grains after MAF 1-cycle. At a lower strain of 0.546 (after 1 cycle), the shear bands were focused along one direction in some grains and randomly oriented in other grains. As the number of cycles increase, due to higher strain, shear bands start mutually intersecting with each other.Reference Joshi, Kumar, Yogesha, Jayaganthan and Nath38 Parallel intersecting slip bands are resulted due to deformation in different directions during the MAF process. Shear bands are increased due to the increase in MAF passes and it was observed that grain boundaries became ambiguous gradually as observed from Fig. 2(d). High dislocation density and deformation bands were formed very close to each other after 3 cycles of MAF. At this stage, subgrains are formed inside the grain, which are observed under SEM and are shown in Figs. 2(e)–2(h), which are difficult to be observed under OM because of high dislocation density and greater shear band crossing.
OM micrograph of the (a) as-received sample and MAF-processed (b) 1 cycle, (c) 2 cycle, (d) 3 cycle samples and SEM micrograph of the (e) as-received sample and MAF-processed (f) 1 cycle, (g) 2 cycle, and (h) 3 cycle samples.

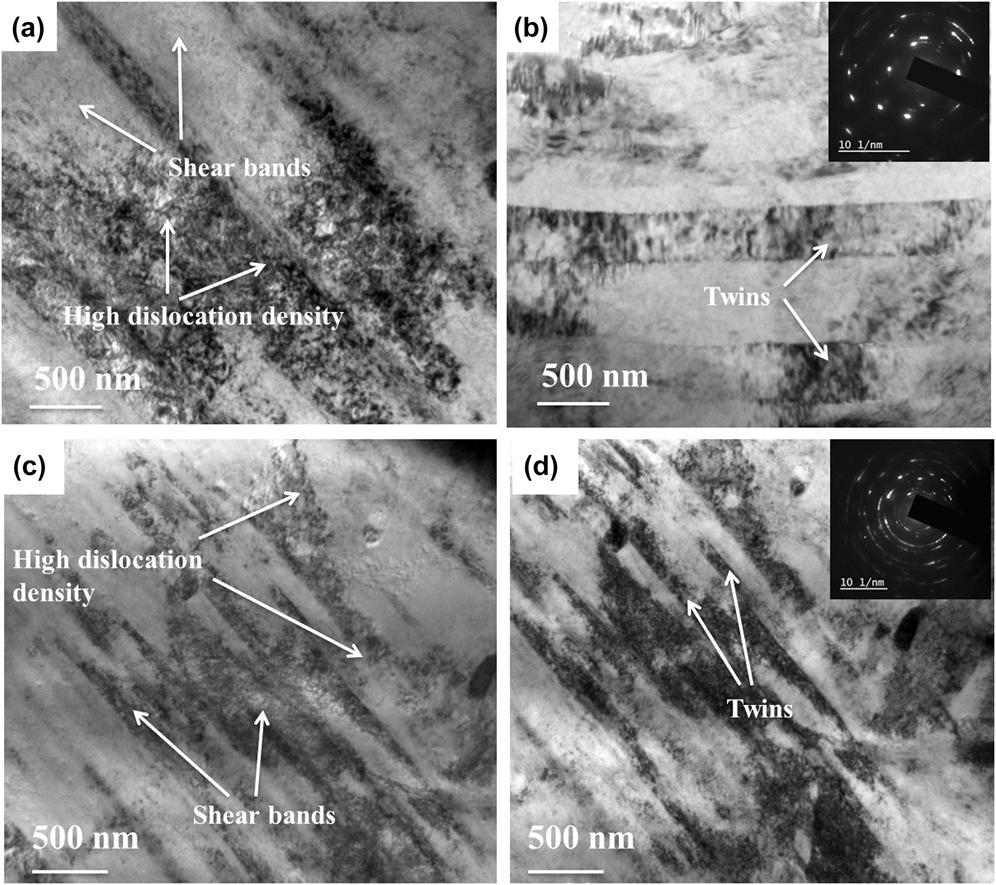
Figure 3 shows TEM images of MAF-processed 2 and 3 cycle samples and the selected area electron diffraction (SAED) patterns at the inset. These images clearly show the formation of shear bands with deformation twins, which were established due to the increase in MAF cycles at cryogenic temperature. The MAF 2 cycle sample exhibits dislocation substructures/twins inside the coarse grains (grain size ∼1.5 μm). Shear band width was found to be ∼900 nm [Fig. 3(a)]. SAED patterns at the inset explain the presence of low angle grain boundaries (LAGBs). The SAED pattern showed intermittent spotty rings with stretched and broadened regions due to the presence of elongated coarse grains. Narrow regions of the rings are because of the presence of deformed fine grains.Reference Dasharath and Mula35 Figure 3(c) shows the TEM microstructure of 3 cycle MAF-processed sample. The microstructure shows highly deformed structure with high density of dislocation substructures, high density of shear bands, and reduced width of ∼250 nm. The SAED pattern in Fig. 3(d) displays endless, but stretched rings, indicating ultrafine substructure formation with LAGBs. Ultrafine twins are generated inside the substructures because of low stacking fault energy. Because of increased deformation strain from 1.09 to 1.64 (from 2 to 3 cycles), lamellar grain structures with high angle grain boundaries (HAGBs) steadily transformed to substructures which are ultrafine in size, along with fine twins. Ductility and strength increased, with increase in MAF cycles, due to the reduction in shear band width and twin width/spacing, resulting in twin boundary strengthening and improved ductility.Reference Gupta, Srivastava, Kumar and Panthi19,Reference Dao, Lu, Shen and Suresh39
TEM micrograph of (a and b) MAF 2 cycle and (c and d) MAF 3 cycle samples.

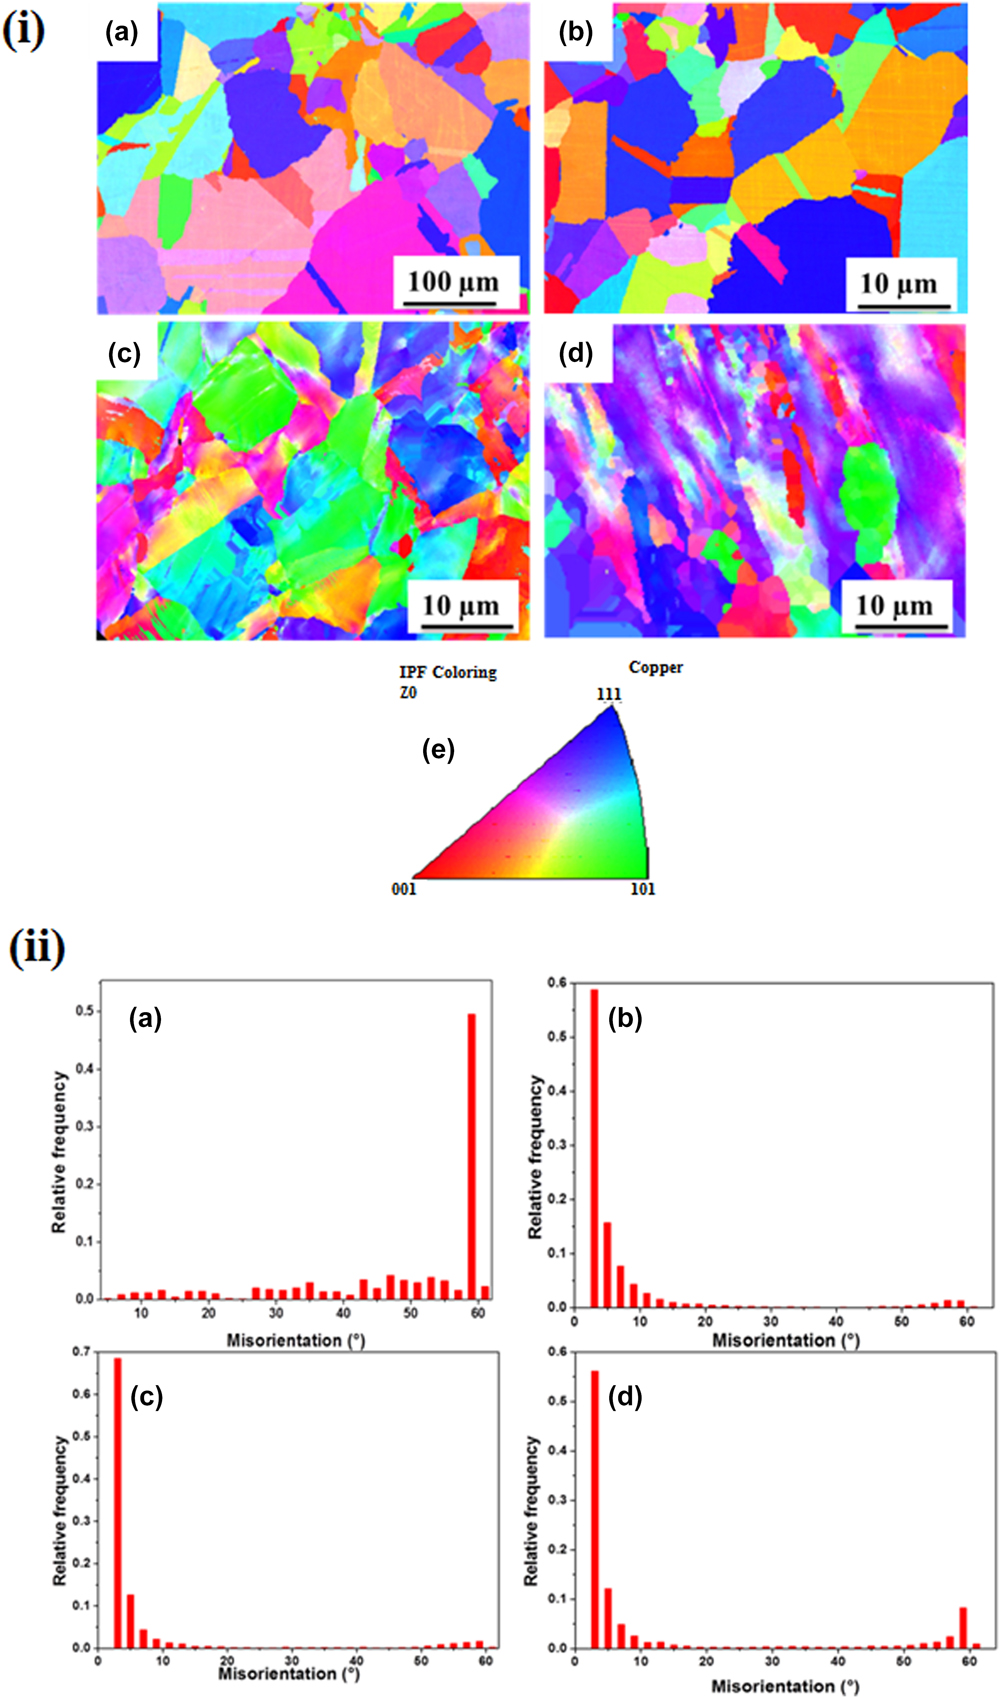
Figures 4(i)(a)–(d) show the OIM based inverse pole figure (IPF) map of as-received, 1, 2, and 3 cycle samples, respectively. Colors in the IPF map represent different crystal orientations as shown in Fig. 4(i)(e). The as-received sample [Fig. 4(i)(a)] shows the heterogeneous structure with fine grains at higher cycles of MAF. The 3-cycle sample consists of subgrains with LAGBs. With an increase in MAF cycles, accumulative strain induced in the material also increases; thereby HAGBs get transformed into LAGBs.Reference Vaid, Mittal, Sahu and Shekhar40,Reference Sahu, Yadav and Shekhar41 After 3 cycles, grains are elongated, as shown in Fig. 4(i)(d). Figure 4(ii) shows the distribution of grain boundary misorientation angles of as-received and MAF-processed samples. The as-received sample shows strong peaks with high misorientation angles (∼60°). The misorientation angle of the grain boundaries decreases in the MAF 3 cycle sample, with peaks at small misorientation angles (<10°). The rate of grain refinement is decreased at higher cycles of the MAF process.
(i) OIM based IPF map of (a) as-received, (b) MAF 1 cycle, (c) MAF 2 cycle, (d) MAF 3 cycle samples, and (e) Crystallographic orientation in IPF map expressed through stereographic triangle. (ii) Misorientation angle distribution in (a) as-received, (b) MAF 1 cycle, (c) MAF 2 cycle, and (d) MAF 3 cycle samples.

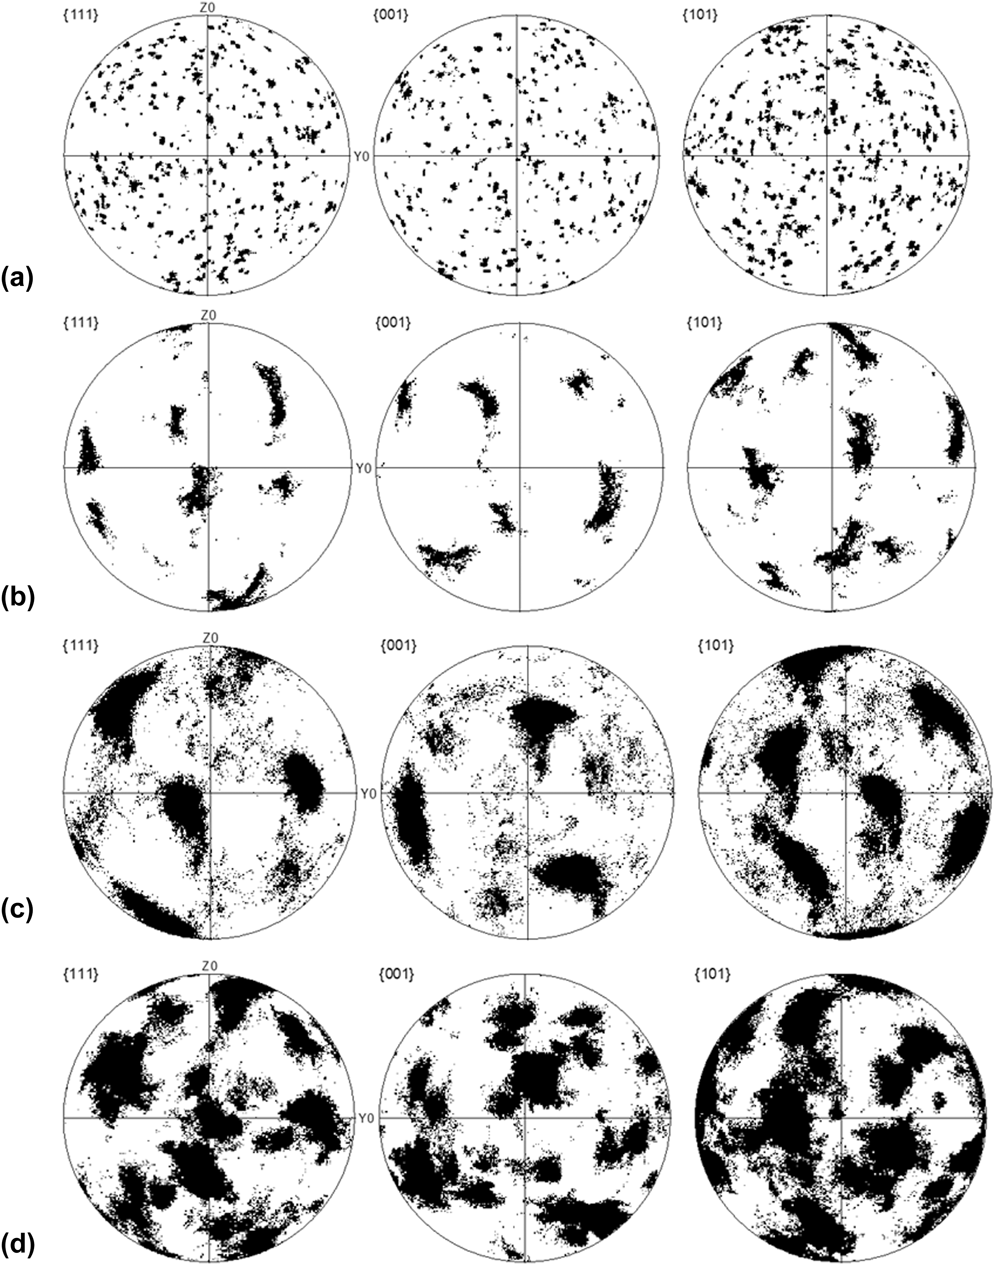
The texture for the as-received material ranges from (001) to (111) with the coarse grains having either (111) or (001) orientations and they are seen as red and blue grains in the OIM [Fig. 4(i)(a)]. The texture starts developing to (10) after 1 cycle (indicated by green color) in the OIM [Figs. 4(ii)(c) and (d)] and is clearly observed in the pole figures, as shown in Fig. 5. After 3 cycles, there is refinement of the texture and progress towards elongated grains. Additionally, the grains which are in micrometer size are broken to ultrafine size with the increased number of MAF cycles and at MAF 3 cycle, majority of grain structure is covered with ultrafine grains.Reference Mishra, Richard, Grégori, Asaro and Meyers42
Pole figures with {111}, {001}, and {101} planes of (a) as-received, (b) MAF 1 cycle, (c) MAF 2 cycle, and (d) MAF 3 cycle samples.

B. XRD analysis
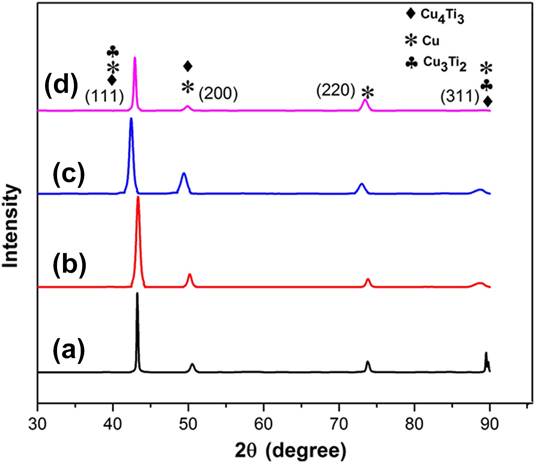
Figure 6 shows the XRD plot of as-received and MAF-processed samples. The intensity of planes (111) and (311) in the as-received sample shows strong peaks, but after 3 cycles of MAF, the intensity of planes (111) and (311) decreases. Planes (200) and (220) show sudden increase in intensity along with peak broadening because of strain hardening after MAF 3 cycles. Peak shifting occurs at 1° after MAF 2 cycles because of high dislocation density in the material. After MAF 3 cycles, variation in the peaks is observed due to change in the texture because of shear deformation.
XRD profile of the (a) as-received sample and (b) MAF 1 cycle, (c) MAF 2 cycle, and (d) MAF 3 cycle samples.

C. Mechanical properties
1. Tensile behavior
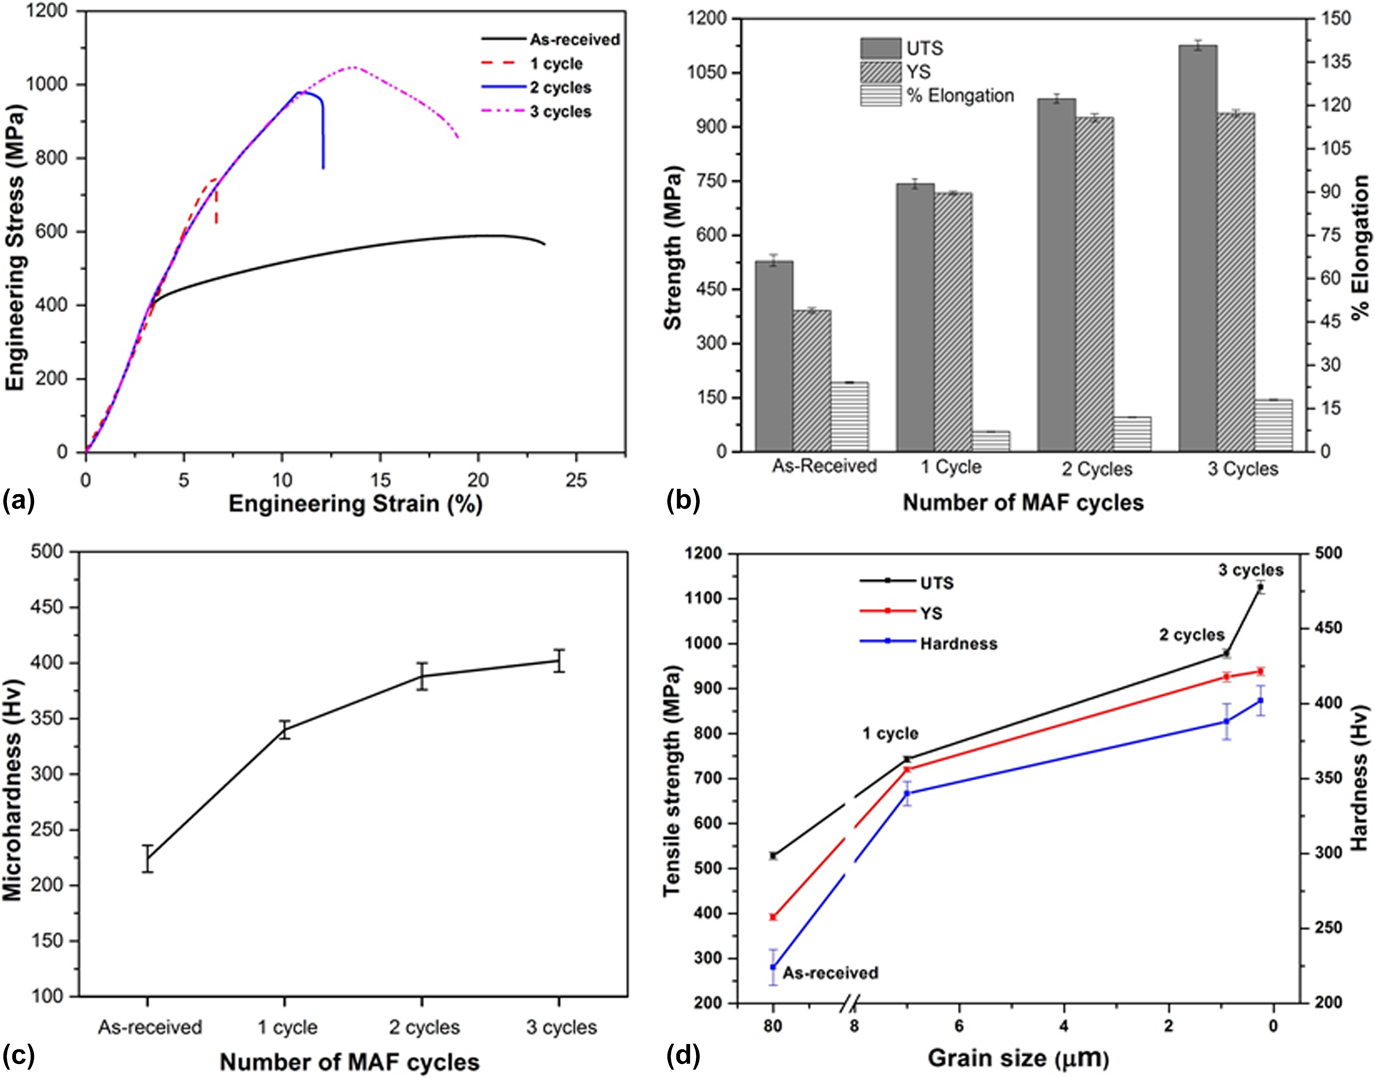
The stress–strain curve of as-received and MAF-processed 1, 2, and 3 cycle samples of the Cu–3% Ti alloy at cryogenic temperature are shown in Fig. 7(a). Ultimate tensile strength (UTS), YS, and % elongation are plotted in Fig. 7(b). Mechanical properties of all the samples are summarized in Table I. For each condition, 3 samples were tested for confirming the tensile properties of the samples. YS and UTS obtained for the as-received alloy is 392 MPa and 528 MPa, respectively, with 24% elongation. After 1 cycle of MAF, YS and UTS increased to 717 MPa and 743 MPa, respectively. YS and UTS increased further with an increase in MAF cycles and reached maximum of 978 MPa and 1126 MPa, respectively, for the MAF 3-cycle sample. The increase in strength is due to two reasons. First, strength increases with the decrease in grain size, which is because of the grain boundary strengthening mechanism as per Hall–Petch equation.Reference Nieh and Wadsworth43 Second, as the number of forging passes increases, dislocation density increases, resulting in the increase in strength. After 1 cycle, elongation decreased to 7%, as compared to the as-received condition (24%). However, with further increase in cycles, ductility increased and reached 12% for 2 cycle and 18% for 3 cycle sample. After 1 cycle, the increase in strength and ductility is due the decrease in twin spacing during the MAF process.Reference Gupta, Srivastava, Kumar and Panthi19,Reference Dao, Lu, Shen and Suresh39
(a) Stress–strain curve, (b) UTS, YS, and % elongation variation plot, (c) Vickers microhardness of as-received and MAF-processed samples, and (d) relationship between tensile strength, hardness, and average grain size.

Mechanical properties and grain size for all the samples processed by MAF.

2. Hardness properties
Vickers microhardness (Hv) on the samples was conducted using an Omni-Tech microhardness tester. The test was conducted across the cross section of the sample, with a load of 100 g and a dwell time of 15 s. Variation in the microhardness values for as-received and MAF pass samples is depicted in Fig. 7(c). The as-received sample possesses a hardness of 224 Hv and with increase in MAF passes, the hardness increased to 340 Hv for 1 cycle, 388 Hv for 2 cycle, and 402 Hv for the 3 cycle sample. With an increase in the number of MAF cycles, hardness increases because of strain hardening, high dislocation density, and also, due to the formation of ultrafine grains. Variation in microhardness is related to YS and UTS, as they are mutually interdependent of one another. The relationship between hardness, YS, and UTS with average grain size is shown in Fig. 7(d). It can be seen that both strength and hardness increase with a decrease in grain size.
3. Fractography
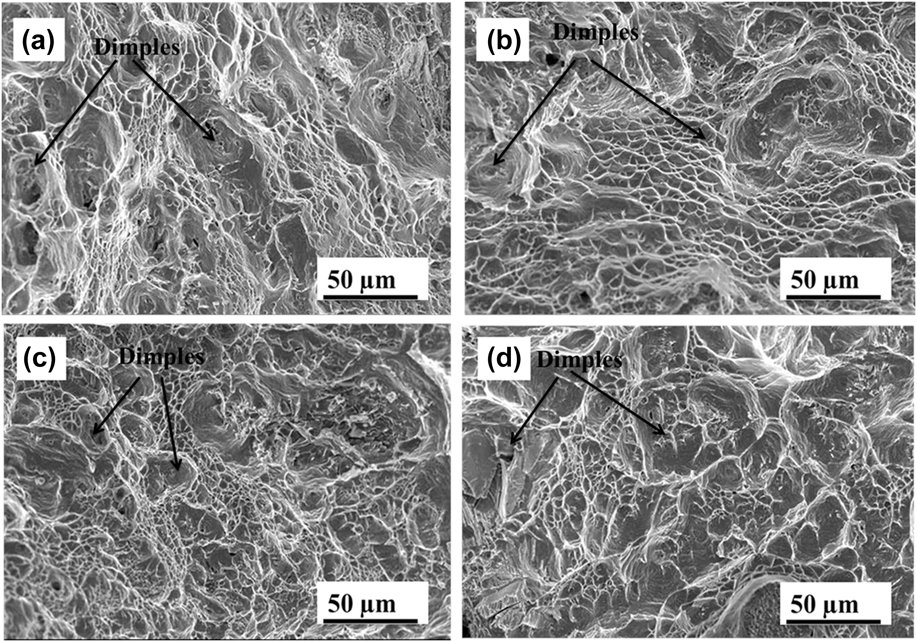
Fracture surface morphology can give the useful information about the mode of failure.Reference Sahu, Yadav and Shekhar44 Therefore, fracture topography of the MAF Cu–3% Ti alloy after tensile test was evaluated by SEM. The fractured surface of as-received and MAF 1, 2, and 3 cycle samples after tensile test is shown in Fig. 8. The as-received specimen shows ductile fracture having large size dimples (∼30 µm). These large size dimples are due to coarse grain in the as-received sample and also because of coalescence of voids which occurs in ductile materials. Large size dimples indicate good ductility. After 1 cycle, the dimple size was reduced to 3 µm and % elongation decreased to 7%. The dimple size increased to 10 µm and 20 µm after 2 and 3 cycles, respectively, due to the increase in ductility of the sample and % elongation increased to 12% and 18%, respectively. The variation in dimple size during cryo-forging is due to the development of ultrafine dislocation substructure or subgrains.
SEM micrographs of the tensile fracture surface of (a) as-received, (b) 1 cycle, (c) 2 cycle, and (d) 3 cycle MAF samples.

IV. CONCLUSIONS
MAF was conducted for the Cu–3% Ti alloy up to 3 cycles at cryogenic temperature and the pertinent conclusions are as follows:
(1) The grain size decreased to ∼250 nm after 3 cycles of MAF, resulting in the formation of microshear bands and transformation of grain boundaries from high angle to low angle.
(2) Mechanical properties improved in the samples forged at cryogenic temperature. Maximum UTS was obtained for the MAF-processed 3-cycle sample (1126 MPa) with 18% elongation. This increase in the strength is due to the grain boundary strengthening mechanism and increase in dislocation density with an increase in the number of MAF passes. Decreasing shear band width/twin width is also a reason for improvement in both strength and ductility of the material.
(3) Hardness increased from 224 to 340 Hv after 1 cycle of MAF. As the number of forging cycle increases, the hardness value also increases due to the increase in dislocation density and grain refinement. The maximum hardness value reached 402 Hv after 3 cycles of MAF.
(4) Fracture analysis of the MAF-processed sample shows that the dimple size decreases for 1-cycle sample as compared to that for as-received condition, because of grain refinement and strain hardening. After 1 cycle, the dimple size started increasing. The increase in ductility for higher MAF cycles is due to the decrease in the shear band width and twin width.
ACKNOWLEDGMENT
We would like to thank Dr. Shashank Shekar, Assistant Professor, Department of Materials Science and Engineering, IIT, Kanpur, India, for his support in providing laboratory facility which helped us to carry out this work.