Hypoplastic left heart syndrome remains a challenging diagnosis with substantial mortality risk. Families and healthcare providers invest tremendous time and effort to ensure the likelihood of survival and well-being of children with such a diagnosis. Children with hypoplastic left heart syndrome typically undergo staged palliation; however, some centres favour the hybrid procedure or transplantation as the initial treatment for hypoplastic left heart syndrome.Reference Norwood, Lang and Hansen 1 – Reference Galantowicz and Cheatham 3 Despite improvements in pre-operative care, surgical technique, perfusion strategy, and post-operative cardiac intensive care, the mortality rate remains high. Reports of early Stage 1 mortality vary widely and are centre dependent, but recent reports suggest that nationally approximately one of every five patients undergoing the Norwood operation will not survive to hospital discharge.Reference Hornik, He and Jacobs 4 – Reference Pasquali, Ohye and Lu 8 The time between the Stage 1 and Stage 2 operations, referred to as the interstage period, also continues to be a period of potential haemodynamic instability regardless of the surgical approach taken, with additional interstage mortality ranging from 4% to 15% for Stage 1 survivors.Reference Glenn 9 – Reference Tweddell, Hoffman and Fedderly 13
Some of the identified risk factors specific to interstage mortality have included hypoplastic left heart syndrome with intact or restrictive atrial septum, re-coarctation of the aortic arch, obstruction of the pulmonary arteries or shunt, age at operation >7 days, longer aortic cross-clamp time, and post-operative renal dysfunction.Reference Hehir, Dominguez and Ballweg 10 , Reference Sathanandam, Polimenakos and Roberson 12 , Reference Jonas, Hansen, Cook and Wessel 14 , Reference Bartram, Grunenfelder and Van Praagh 15 Other factors implicated in the overall mortality include lower pre-operative pH, smaller ascending aorta diameter, longer deep hypothermic circulatory arrest, severe right ventricular dysfunction, presence of significant tricuspid regurgitation, and higher incidence of airway or respiratory complications.Reference Hehir, Dominguez and Ballweg 10 , Reference Ashburn, McCrindle and Tchervenkov 16 Most of these reports have been either single centred, retrospective, or covered a long period of time during which multiple changes in the care of children with hypoplastic left heart syndrome could have been implemented. It has also been shown that there is wide variation in the management approach to patients in the interstage period, making generalisations about care and outcomes of this patient population difficult.Reference Schidlow, Anderson and Klitzner 17
The Joint Council on Congenital Heart Disease National Pediatric Cardiology-Quality Improvement Collaborative was created to promote wide-ranging improvements in congenital heart disease outcomes through the use of quality improvement science techniques and education, as well as development of national paediatric congenital heart disease data registries to monitor care delivery and outcomes. Details regarding the collaborative's structure and composition are reported elsewhere.Reference Kugler, Beekman and Rosenthal 18 , Reference Anderson, Iyer and Beekman 19 The first improvement effort chosen by the National Pediatric Cardiology-Quality Improvement Collaborative was to decrease interstage mortality following the Stage 1 operation. The key drivers of the improvement effort are focused on improving care transitions, achieving adequate growth, engaging parents, and improving care coordination among parents, cardiologists, and the primary care medical home.Reference Kugler, Beekman and Rosenthal 18 , Reference Anderson, Iyer and Beekman 19 The associated multi-centre data registry focuses on many aspects of the initial hospitalisation and Stage 1 procedure, interstage hospitalisation and outpatient encounters, as well as the Stage 2 hospitalisation that are impacted by these key drivers.
It is expected that the registry will enable practitioners to understand risk factors and outcomes associated with the management of these challenging patients. Owing to the paucity of multi-centre prospective data on the interstage period, we sought to identify risk factors of interstage mortality in the present era using the National Pediatric Cardiology-Quality Improvement Collaborative multi-centre data registry. The analysis was intended to be exploratory and hypothesis generating as opposed to hypothesis driven, with the goal of identifying potential risk factors documented in the registry that could lead to improvement in interstage management approaches. A secondary aim was to identify patient management issues that could call for immediate attention by the collaborative in the early phase of registry data collection.
Materials and methods
The National Pediatric Cardiology-Quality Improvement Collaborative interstage data registry is a secure, web-based system (REDCap, Vanderbilt University) with data voluntarily entered by participating centres in the United States beginning in June, 2008.Reference Kugler, Beekman and Rosenthal 18 , Reference Anderson, Iyer and Beekman 19 All centres participating in the collaborative at the time of analysis perform cardiovascular surgery at their site, most are considered to be regional or national congenital heart disease referral centres, and 94% are institutions with an academic affiliation. Any infant with hypoplastic left heart syndrome or other complex single-ventricle malformation who underwent a Stage 1 (Norwood or Norwood-variant) procedure and who was discharged alive is eligible for enrolment in the registry. The registry captures data on patient demographics, clinical presentation, hospitalisation, Stage 1 procedure, initial hospital discharge, interstage clinic visits and hospitalisation episodes, outpatient communication procedures, nutrition, feeding route, and home surveillance plans. Data about red flag events, which are predefined adverse changes for which parents are instructed to contact their child's healthcare provider, as well as other adverse events are also recorded. All patients who survived to hospital discharge from Stage 1 and who either died during the interstage period or reached Stage 2 alive as of June, 2011 were included in the current analysis. Patients still alive in the interstage period who had not reached the point of having the Stage 2 palliation were excluded. All data elements of the National Pediatric Cardiology-Quality Improvement Collaborative registry for the applicable clinical time period were analysed, with the exception of details of home monitoring frequency, which was excluded because of a large number of free-text entries in the registry. Using anonymous identifiers, it was possible to distinguish patients treated at the same and different institutions, but not to identify participating institutions by name or by characteristics. Local institutional review board approval was obtained by the participating centres for contributing data to the registry.
Statistical analysis
We used time to event (survival) analyses, using the anonymous institution identifier to define data clusters, to evaluate risk factors for interstage mortality in a setting where the duration of follow-up varied. Analyses proceeded in steps, beginning with Kaplan–Meier analyses to identify individual factors, both those present at baseline – discharge from the Norwood procedure – and those that surfaced during the interstage period, associated with mortality and to check the proportional hazards assumption. In step 2 of the analysis, implemented using Cox proportional hazard models, we evaluated which of the individual interstage risk factors identified in step 1, introduced one at a time, persisted as such after accounting for baseline differences. Those step 1 risk factors that retained even borderline statistical significance (p < 0.15) were retained for step 3 analysis. The third step of the analysis involved the development of multiple risk factor Cox models that included multiple step 2 risk factors. The purpose was to identify independent risk factors whose association with mortality persisted in the presence of other risk factors. In selecting final models, we began with a full model, including all risk factors that were retained in step 2 analyses, and after first checking for and removing factors that showed evidence of collinearity, we performed one at a time successive manual elimination of terms with high p-values. Where two or more interstage variables were collinear, we chose to retain the variable that we considered most amenable to intervention. The difference between this method and formal backward stepping is greater control and review at each step to be able to check alternative models. The ultimate purpose was both to predict risk and to identify sets of risk factors that might be targeted, after validation, in future quality improvement efforts to reduce interstage mortality. In pursuing these goals, we did not adjust for multiple comparisons, and paid as much attention to the magnitude of the relative risk as statistical significance. Therefore, we included factors that only achieved borderline statistical significance (p < 0.12) because we consider these analyses hypothesis generating rather than hypothesis testing. The rationale for this approach is that we considered it more important at this phase to not miss potential risk factors than to avoid including some factors that may later prove to not affect risk following additional evaluation. The analysis was focused on evaluation of the collaborative as a whole, and thus separate centre effects were not evaluated per se, partly because the number of deathsReference Mahle, Spray, Gaynor and Clark 25 was smaller than the number of centres.Reference Kelleher, Laussen, Teixeira-Pinto and Duggan 33 However, as noted above, we used the anonymous institution designator to define data clusters. The effect of this was to adjust variance estimates to account for the correlation between patients from the same institution. It also had the effect of reducing the likelihood that isolated associations from small centres would be identified as risk factors because of higher variance estimates. In the case of missing data, pairwise deletion was used to accommodate the analysis on a per variable basis. The majority of potential predictor variables had <3% missing data (refer to Supplementary Table S2 for details). Only those patients with registry entries for clinic visits (222 patients) or readmissions (173 patients) were used in analysis of those aspects of care. In the early phase of registry data collection, no data auditing programme was in place, but this has been added to the registry subsequent to the initiation of this analysis.
Results
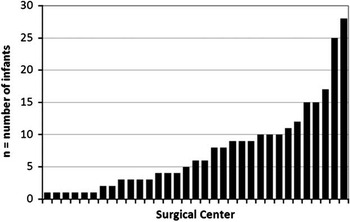
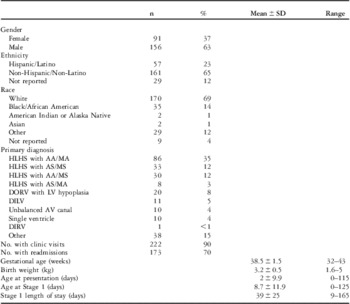
Patients were registered in the National Pediatric Cardiology-Quality Improvement Collaborative database from 33 surgical centres, with the number of surgical procedures performed at each centre captured in the database ranging from 1 to 28 (Fig 1). There was substantial variability in the length of time each centre participated in the registry because of ongoing (rolling) centre enrolment in the collaborative; therefore, annual surgical centre volume could not be reliably determined. From these 33 centres, 247 patients met inclusion criteria; their characteristics are summarised in Table 1. The majority (64%) of the patients underwent Stage 1 palliation for some form of hypoplastic left heart syndrome, whereas the remaining 36% underwent Stage 1 palliation for other complex univentricular diagnoses. The predominant type of Stage 1 palliation was a Norwood operation with right ventricle-to-pulmonary artery conduit (Sano modification), which represented 60% of the procedures performed; Norwood with Blalock–Taussig shunt (26%), Damus–Kaye–Stanzel with Blalock–Taussig shunt (6%), and hybrid procedures (8%) were some of the other procedures performed.
Number of infants enrolled at each participating surgical site.

Patient demographics and clinical presentation.

AA = aortic atresia; AS = aortic stenosis; AV = atrioventricular; DILV = double-inlet left ventricle; DIRV = double-inlet right ventricle; DORV = double-outlet right ventricle; HLHS = hypoplastic left heart syndrome; MA = mitral atresia; MS = mitral stenosis
Of the 247 patients entering the interstage period, there were 23 deaths, representing an overall interstage mortality rate of 9%. Patients with hypoplastic left heart syndrome had the highest mortality rate at 12%, whereas the non-hypoplastic left heart syndrome patients – those with other forms of univentricular heart who also underwent a Norwood procedure, such as unbalanced atrioventricular canal defect or double-outlet right ventricle with left ventricular hypoplasia, double-inlet left ventricle, etc. – had a combined interstage mortality rate of 4%.
Risk factors
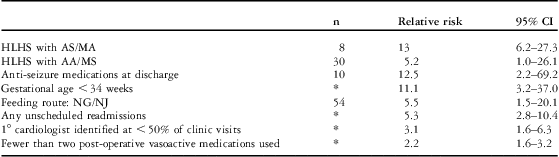
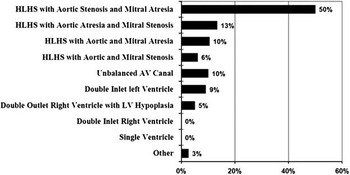
Kaplan–Meier analysis of the initial 131 analysed registry variables (Supplementary Table S1) resulted in the identification of 28 candidate risk factors of interstage mortality (Supplementary Table S2), and subsequent Cox proportional hazard modeling narrowed the candidate risk factors to 14 (Supplementary Table S3). Cox multiple regression modelling controlling for the effects of these 14 candidate risk factors resulted in the identification of eight independent risk factors of mortality during the interstage period (Table 2). The diagnosis of any type of hypoplastic left heart syndrome imparted an increased risk of mortality compared with the non-hypoplastic left heart syndrome diagnoses in univariate analysis (p = 0.007, Fig 2). Following multiple regression analysis, two sub-types of hypoplastic left heart syndrome were found to be independent risk factors of interstage mortality when compared with the non-hypoplastic left heart syndrome diagnoses. Those with aortic stenosis and mitral atresia had the highest adjusted risk of mortality, with a mortality rate of 50% (relative risk = 13, p = 0.004), followed by aortic atresia and mitral stenosis with a mortality rate of 13% (relative risk = 5.2, p = 0.045). The type of surgical procedure performed was not associated with interstage mortality risk in our analysis.
Independent risk factors for death during the interstage period derived from Cox multiple regression modelling.

AA = aortic atresia; AS = aortic stenosis; HLHS = hypoplastic left heart syndrome; MA = mitral atresia; MS = mitral stenosis; NG = nasogastric; NJ = nasojejunal
*Treated as a continuous or ordinal variable
Mortality rate by diagnosis during the interstage period. AV = atrioventricular; HLHS = hypoplastic left heart syndrome; LV = left ventricle.

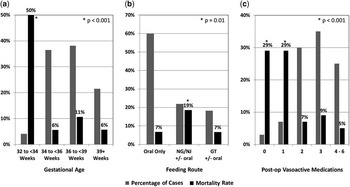
Following diagnosis type, the next highest relative risk of interstage mortality was associated with the prescription of anti-seizure medications at the time of Stage 1 hospitalisation discharge. Patients who were discharged on anti-seizure medications had an interstage mortality rate of 30%, compared with 8% for those who were not on such medications (relative risk = 12.5, p = 0.004). Earlier gestational age was also found to be associated with an increased adjusted relative risk of interstage mortality. Gestational age <34 weeks was associated with an interstage mortality rate approaching 50% compared with mortality rates ranging from 6% to 11% for older gestational age groups (relative risk = 11.1, p < 0.001, Fig 3A).
Relationship of ( a ) gestational age, ( b ) last documented feeding route, and ( c ) number of post-operative vasoactive medications to interstage mortality. Grey bars indicate the percentage of patients composing the group; black bars indicate the interstage mortality rate within the group. GT = gastrostomy tube; NG = nasogastric; NJ = nasojejunal.

Patients whose last documented feeding route included nasogastric or nasojejunal tube feeding had higher interstage mortality at 19% compared with those who were receiving either oral feedings alone or feedings that included gastrostomy tube, each of which had interstage mortality rates of 7% (relative risk = 5.5, p = 0.01, Fig 3B). Patients who had any readmission that was unscheduled had higher rates of interstage mortality at 8% compared with 3% in those patients with no unscheduled readmissions (relative risk = 5.3, p < 0.001). Another outpatient marker that demonstrated increased interstage mortality risk relates to the consistency of identifying a primary cardiologist at each clinic visit as measured by asking the following question: “Was a primary cardiologist identified and documented following this clinic visit?” Those patients for whom a primary cardiologist was identified and documented at less than half of their clinic visits had a higher interstage mortality rate at 50% compared with mortality rates of 6–7% in those patients for whom identification and documentation of a primary cardiologist occurred at greater than half of their clinic visits (relative risk = 3.1, p < 0.001).
The final adjusted risk factor for interstage mortality was the number of intravenous vasoactive medications used in the post-operative period following the Stage 1 procedure. Those patients who received one or no vasoactive medications (including milrinone, epinephrine, dopamine, dobutamine, norepinephrine, calcium, vasopressin, or nitroprusside) each had an interstage mortality rate of 29% compared with rates ranging from 5% to 9% in those patients who received two or more vasoactive medications (relative risk = 2.2, p < 0.001, Fig 3C).
Borderline risk factors
In addition to the eight independent risk factors, there were six potential risk factors for interstage mortality that were of borderline significance. These factors were kept in the multiple regression models because of the fact that the analysis was meant to be hypothesis generating in order to cast a broad net for identification of potential factors that could be analysed in the future when more registry data are available. The hypoplastic left heart syndrome subgroups of aortic and mitral stenosis, as well as aortic and mitral atresia, were considered to be borderline risk factors for interstage mortality, having adjusted relative risks of 2.8 and 2.4, respectively, but did not meet statistical significance in multiple regression modelling. Patients born weighing <2.5 kg had over three times the mortality rate of patients with birth weight >2.5 kg (relative risk = 2.2). Female gender accounted for 57% of the interstage mortalities, despite composing only 37% of the patients in the registry (relative risk = 1.9). Patients who had any interstage readmission that was due to an adverse event had higher rates of interstage mortality at 19% compared with a mortality rate of 4% in those patients without adverse event readmissions (relative risk = 1.8). Finally, those patients with >30% of their clinic visits due to red flags had a higher interstage mortality rate at 27% compared with 8% or less for those with fewer clinic visits due to red flags (relative risk = 1.6).
Discussion
This study identified several independent predictors of interstage mortality in infants with hypoplastic left heart syndrome and other single-ventricle anomalies. Some of the risk factors identified are directly modifiable and some are not. Those that are not directly modifiable, however, could be used to affect risk stratification and clinical observation practices during the interstage period. For example, it has been clearly shown that seizure activity following neonatal open heart surgery is a marker for central nervous system injury, and is associated with adverse long-term neurodevelopmental outcomes.Reference Gaynor, Jarvik and Bernbaum 20 – Reference Rappaport, Wypij and Bellinger 24 Seizure activity has also been noted to precede unexpected interstage death in some patients following hypoplastic left heart syndrome palliation, but the relationship between pre-discharge seizures and interstage death is not clear.Reference Mahle, Spray, Gaynor and Clark 25 It is plausible that in our study the need for anti-seizure medications following Stage 1 operation represents a clinical marker for central nervous system injury that could, with further investigation, be used to affect decision making regarding discharge timing or the intensity and type of outpatient monitoring in these children.
The anatomic subtype of hypoplastic left heart syndrome has been shown by several investigators to be associated with varying risk of mid- and late-term mortality following Stage 1 palliation.Reference Jonas, Hansen, Cook and Wessel 14 , Reference Furck, Uebing and Hansen 26 – Reference Vida, Bacha and Larrazabal 28 In most studies, the highest risk of mortality is associated with the aortic atresia/mitral stenosis subtype, followed by aortic stenosis/mitral atresia. Findings from the National Pediatric Cardiology-Quality Improvement Collaborative registry data concur with regard to these two highest risk subtypes, but find that aortic stenosis/mitral atresia is of highest risk for interstage mortality. It should be noted that the National Pediatric Cardiology-Quality Improvement Collaborative registry contains data only on children discharged home after Stage 1 surgery. Thus, our analyses cannot evaluate whether post-operative in-hospital mortality differs among hypoplastic left heart syndrome anatomic subtypes. Results of our analyses demonstrate that patients with any form of hypoplastic left heart syndrome have increased risk of interstage mortality compared with those with non-hypoplastic left heart syndrome diagnoses who undergo Stage 1 palliation. While patient diagnosis and hypoplastic left heart syndrome subtype are not risk factors that are directly modifiable, they again represent examples of risk factors that could be incorporated into decision-making algorithms to design patient-specific outpatient management strategies as are being promoted by the National Pediatric Cardiology-Quality Improvement Collaborative.
Another finding from this analysis that could potentially be used to craft patient-specific outpatient strategies is the increased interstage mortality associated with prematurity. Hirsch et alReference Hirsch, Copeland, Donohue, Kirby, Grigorescu and Gurney 29 found similar results of decreased 1-year survival in hypoplastic left heart syndrome patients born at <37 weeks gestational age on a population-based analysis of 406 infants born with hypoplastic left heart syndrome recorded in the Michigan Birth Defects Registry. They also found that low birth weight of <2.5 kg was significantly associated with decreased 1-year survival. It has also been shown that rates of low birth weight, prematurity, and small for gestational age are higher among newborns with single-ventricle physiology compared with the general population.Reference Williams, Ravishankar and Zak 30 It is unclear how low birth weight and prematurity, the medical and socio-economic variables that may be associated, and the combination of these factors may affect the increased mortality in such infants with single-ventricle physiology. Nonetheless, these findings suggest that patients born premature or of low birth weight could benefit from heightened interstage monitoring. Prematurity could also be viewed as a modifiable risk factor that could be intervened on by improved prenatal care and minimising the use of elective premature delivery as a management strategy for the hypoplastic left heart syndrome patient group.
The risk factor from the current analysis that has possibly the highest impact on interstage care, and the most potential for modification, is feeding route. Our analysis demonstrated that patients whose last documented feeding route included nasogastric or nasojejunal tube had a nearly threefold higher interstage mortality rate compared with those who were orally fed or who were receiving transgastric tube enteral feeds. This is similar to findings recently published from the Pediatric Heart Network Single Ventricle Reconstruction trial of 426 patients from multiple centres who underwent Stage 1 palliation and were followed to Stage 2.Reference Ghanayem, Allen and Tabbutt 31 They found that “failure to feed orally” before Stage 1 hospitalisation discharge was associated with increased interstage mortality. In addition, of those discharged on non-oral feeds, the presence of a nasal enteral tube as compared with a gastrostomy tube was associated with increased interstage mortality on univariate analysis. These findings are important in that they relate to the National Pediatric Cardiology-Quality Improvement Collaborative goal of improving interstage nutrition, as it is well documented that patients following Stage 1 palliation are often undernourished, and that undernourishment contributes to interstage morbidity and mortality.Reference Anderson, Beekman and Border 32 , Reference Kelleher, Laussen, Teixeira-Pinto and Duggan 33 It should be noted, however, that markers of nutritional adequacy – weight, length, and growth – included in our analysis did not reach statistical significance for affecting interstage mortality. The type of feeding route used should not be construed as a marker for nutritional adequacy, but rather the finding regarding feeding route is important because modification of feeding route is a tool sometimes used to reach the goal of nutritional adequacy. It has been shown that perhaps as many as 65% of neonatal heart surgery patients exhibit some type of feeding difficulty.Reference Kogon, Ramaswamy and Todd 34 Approaches to mediate these feeding difficulties and attempts to improve interstage growth vary widely based on institutional practices and provider preferences, and data from individual institutions are difficult to generalise. A recent single-centre study comparing pre-emptive placement of gastrostomy tubes in patients following Stage 1 palliation resulted in a nearly twofold survival advantage to Stage 2 compared with patients who were managed traditionally.Reference Garcia, Jaquiss, Imamura, Swearingen, Dassinger and Sachdeva 35 In contrast, another single-centre study recently demonstrated an increased risk of interstage mortality in patients who required a gastrostomy tube – with or without Nissen fundoplication – compared with those who did not, and did not show an increased risk of mortality for patients discharged with a nasogastric tube.Reference Hebson, Oster, Kirshbom, Clabby, Wulkan and Simsic 36 The need for any type of feeding tube may be a marker for illness severity or other comorbidities. Certainly, these data suggest that a decision to manage such patients with feeding tubes should occur in the context of a comprehensive patient-specific management and follow-up plan. The findings of this and other recent studies underscore the need for continued multi-centre studies of feeding route and how it relates to outcome in this patient population, with an eye towards future development of management guidelines and practices that could be developed and tested through such collaborative efforts as the National Pediatric Cardiology-Quality Improvement Collaborative.
Unscheduled interstage hospital readmissions and lower percentage of interstage clinic visits at which the primary cardiologist is identified and documented in correspondence with other care providers are also risk factors for interstage mortality that relate to improvement strategies being tested by the National Pediatric Cardiology-Quality Improvement Collaborative. It has been shown that there are wide practice variations among the collaborative institutions with regard to outpatient management following Stage 1 palliation.Reference Schidlow, Anderson and Klitzner 17 By focusing on clinical practices that improve patient outcomes and establishing ways to reduce unnecessary practice variation, it is postulated that interstage outcomes will improve. One example is lack of identification and documentation of a primary cardiologist in correspondence with other care providers as a risk factor for increased interstage mortality. This underscores the need for improved coordination among caregivers as is being encouraged by the National Pediatric Cardiology-Quality Improvement Collaborative. The association between increased unscheduled readmissions and interstage mortality risk is intuitive, but needs more analysis to determine whether the unscheduled readmission rate is related to other markers. The relationship could reflect increased illness severity or suboptimal outpatient surveillance in patients who are readmitted. Nonetheless, the finding that the number of unscheduled readmissions is a potential marker for increased interstage mortality underscores the importance of the National Pediatric Cardiology-Quality Improvement Collaborative registry as a tool to identify the causes of unscheduled readmissions. Further work will ideally lead to development of practices to either mitigate the need for unscheduled readmissions or use the information to alter outpatient monitoring practices. Finally, identification that the use of fewer than two post-operative intravenous vasoactive medications increases the risk for interstage mortality is unexpected. There are no published studies evaluating post-operative vasoactive support in hypoplastic left heart syndrome and the relationship to long-term outcome. Further, the National Pediatric Cardiology-Quality Improvement Collaborative registry was not designed to capture detailed clinical information regarding post-operative vasoactive medication use, such as dosage and length of use, and thus the reported results cannot be expounded. The analysis result is reported here because of its level of significance in the multivariate model, but clinical importance should not be inferred. Further directed investigation is needed before the level of post-operative vasoactive usage can be used for clinical prognostication.
Limitations
The National Pediatric Cardiology-Quality Improvement Collaborative data registry contains historical, observational data that are voluntarily submitted by programmes, and at some centres requires parental consent. This may result in incomplete data sets or skewing of the data due to selection bias. Heterogeneity of centres participating in the registry can make broad statements about findings difficult to apply at any individual centre. Owing to the nature of the pre-specified data contained in the registry, there are limitations to the scope and depth of analysis that can be performed in some areas of clinical interest, and thus detailed conclusions that lead to practice changes may require additional data collection beyond the scope of this registry. Nevertheless, the registry represents a rich ongoing source of new longitudinal data that can be used to formally test hypotheses generated herein.
Conclusion
Interstage mortality following Stage 1 palliation remains substantial. The National Pediatric Cardiology-Quality Improvement Collaborative is a multi-centre quality improvement collaborative that aims to improve care and outcomes for patients who are discharged following Stage 1 palliation. This study is an early analysis that identifies several possible risk factors for interstage mortality from the National Pediatric Cardiology-Quality Improvement Collaborative data registry. The identified risk factors are either potentially modifiable or could be considered markers of clinical risk. It is hoped that further analysis of the identified interstage mortality risk factors, as well as continued analysis of the ongoing data registry collection, will allow the National Pediatric Cardiology-Quality Improvement Collaborative to develop, test, and implement patient-specific interstage management and monitoring strategies that will improve outcomes for these high-risk children.
Acknowledgement
The authors are grateful to Dr Gail Pearson for her review of the manuscript. We also acknowledge the following funding sources: The C. Richard Beyda Distinguished Professorship in Cardiology, Children's National Heart Institute/Children's National Medical Center, provided direct support for this project. This study was also supported in part by a grant from the Cincinnati Children's Heart Association and in part by cooperative agreement #HS016957 from the Agency for Healthcare Research and Quality. The content is solely the responsibility of the authors and does not necessarily represent the official views of the Agency for Healthcare Research and Quality.
Supplementary materials
For supplementary material referred to in this article, please visit http://dx.doi.org/10.1017/S1047951113000127