1. Introduction
A capsule is a liquid drop enclosed by a deformable membrane. Capsules are found in both nature and artificial products, with examples such as biological cells and membrane-bounded drugs. Because excess stretch in the capsule membrane will lead to its rupture, it is critically important to predict the capsule deformation under a given flow field. Small deformation of spherical capsules in steady Stokes flow has been analysed theoretically by Barthès-Biesel and coworkers (Barthès-Biesel & Rallison Reference Barthès-Biesel and Rallison1981; Barthès-Biesel & Sgaier Reference Barthès-Biesel and Sgaier1985; Barthès-Biesel, Diaz & Dhenin Reference Barthès-Biesel, Diaz and Dhenin2002). A number of numerical studies have also been conducted to clarify the large deformation of capsules (Pozrikidis Reference Pozrikidis1995; Ramanujan & Pozrikidis Reference Ramanujan and Pozrikidis1998; Lac et al. Reference Lac, Barthès-Biesel, Pelekasis and Tsamopoulos2004; Walter et al. Reference Walter, Salsac, Barthès-Biesel and Le Tallec2010; Foessel et al. Reference Foessel, Walter, Salsac and Barthès-Biesel2011).
In contrast to steady flow fields, there are only a few studies on the dynamics of capsules in unsteady flow. The basic behaviour of capsules under oscillating shear flow has been reported by Zhao & Bagchi (Reference Zhao and Bagchi2011). They simulated the motion of spherical and ellipsoidal capsules at small Reynolds number using the front-tracking method, and reported that the ellipsoidal capsules show swinging motion in the high- and low-frequency ranges, while tumbling motion occurs at intermediate frequencies. However, their study mainly focused on the regimes of ellipsoidal capsule motion, and the examined frequencies were limited to a narrow range. Dupire, Abkarian & Viallat (Reference Dupire, Abkarian and Viallat2010) reported that the motion of a red blood cell in a sinusoidal flow is highly sensitive to the initial condition.
In the case of drops, Cavallo, Guido & Simeone (Reference Cavallo, Guido and Simeone2003) experimentally observed the deformation of an isolated drop and compared it with the Palierne linear viscoelastic model (Palierne Reference Palierne1990). Sarkar and coworkers analytically and numerically investigated the deformation of two-dimensional (Sarkar & Schowalter Reference Sarkar and Schowalter2001a ,Reference Sarkar and Schowalter b ) and three-dimensional (Li & Sarkar Reference Li and Sarkar2005a ,Reference Li and Sarkar b ) drops in time-periodic extensional flow. Under Stokes flow, the drop has two deformation regimes: the extent of deformation (Taylor parameter) is nearly constant at low frequencies, while it is inversely proportional to the frequency at high frequencies. They also found that the drop shows a resonance phenomenon either at finite Reynolds number or inertial acceleration, but not in Stokes flow.
Even under Stokes flow, the deformation of a capsule transiently overshoots in start-up shear flow, resulting in larger deformation than at the quasi-steady state (Ramanujan & Pozrikidis Reference Ramanujan and Pozrikidis1998). This is because a capsule experiences larger extensional force before it reaches the steady orientation angle. A similar phenomenon can be seen in other suspensions such as polymeric fluids (Doyle & Shaqfeh Reference Doyle and Shaqfeh1998; Babcock et al. Reference Babcock, Smith, Hur, Shaqfeh and Chu2000) and drop suspensions (Sibillo, Simeone & Guido Reference Sibillo, Simeone and Guido2004). Owing to the overshoot phenomenon, a capsule in unsteady shear flow may deform more than that in steady shear flow. Hence, it is important to predict the overshoot phenomenon, but there have been few studies on this problem.
The objective of this paper is to clarify the deformation of a spherical capsule in oscillating shear flow. In § 2, we state the problem and the numerical method. The leading-order prediction of the capsule deformation is given in § 3. In § 4, we first show the numerical results of the deformation amplitude and phase, and then discuss the overshoot phenomenon. We estimate the upper limit and possibility of overshoot, and also the threshold frequency between the low- and high-frequency ranges.
2. Problem statement and numerical method
Consider a spherical capsule with radius
 $a$
, suspended in an unbounded flow field with viscosity
 ${\it\mu}$
and density
 ${\it\rho}$
. The fluid inside the capsule has viscosity
 ${\it\lambda}{\it\mu}$
and density
 ${\it\rho}$
, where
 ${\it\lambda}$
is the viscosity ratio. The capsule membrane is modelled as a hyperelastic sheet with negligible thickness. The oscillating shear flow is given by
 $$\begin{eqnarray}\dot{{\it\gamma}}(t)=\dot{{\it\gamma}}_{0}\exp \mathit{j}(2{\rm\pi}ft),\end{eqnarray}$$
where
 $\dot{{\it\gamma}}_{0}$
is the oscillation amplitude of the shear rate,
 $\mathit{j}$
is the imaginary unit and
 $f$
is the oscillation frequency. The corresponding strain
 ${\it\gamma}(t)$
is then
 $$\begin{eqnarray}{\it\gamma}(t)=\int \dot{{\it\gamma}}(t)\text{d}t=\frac{\dot{{\it\gamma}}_{0}}{2{\rm\pi}\mathit{j}\,f}\exp \mathit{j}(2{\rm\pi}ft),\end{eqnarray}$$
where the strain amplitude
 ${\it\gamma}_{0}$
is
 $$\begin{eqnarray}{\it\gamma}_{0}=\frac{\dot{{\it\gamma}}_{0}}{2{\rm\pi}f}.\end{eqnarray}$$
Note that the phase of the strain lags behind the shear rate by
 ${\rm\pi}/2$
.
The particle Reynolds number
 $\mathit{Re}_{p}={\it\rho}\dot{{\it\gamma}}_{0}a^{2}/{\it\mu}$
is assumed to be small enough to treat the velocity field as a Stokes flow. The frequency parameter,
 ${\it\beta}={\it\rho}a^{2}f/{\it\mu}$
(Pozrikidis Reference Pozrikidis1992), is also assumed to be small enough to disregard the effect of flow unsteadiness. For instance, suppose that a capsule with radius
 $a=1.0\times 10^{-5}\ \text{m}$
suspended in a fluid with shear rate
 $\dot{{\it\gamma}}_{0}=100.0\ \text{s}^{-1}$
, density
 ${\it\rho}=1.0\times 10^{3}\ \text{kg}\ \text{m}^{-3}$
and viscosity
 ${\it\mu}=1.0\times 10^{-3}\ \text{Pa}\ \text{s}$
. Under these conditions, the applicable range of the frequency is
 $f=10^{0}$
–
 $10^{4}\ \text{s}^{-1}$
, which corresponds to a particle Reynolds number
 $\mathit{Re}_{p}=1.0\times 10^{-2}$
and a frequency parameter
 ${\it\beta}=10^{-4}$
–
 $10^{0}$
.
2.1. Fluid mechanics
The Stokes flow velocity of a given observation point
 $\boldsymbol{x}$
is described by the boundary integral formulation (Pozrikidis Reference Pozrikidis1992; Foessel et al.
Reference Foessel, Walter, Salsac and Barthès-Biesel2011):
 $$\begin{eqnarray}\displaystyle \boldsymbol{v}(\boldsymbol{x}) & = & \displaystyle \boldsymbol{v}^{\infty }(\boldsymbol{x})-\frac{1}{8{\rm\pi}{\it\mu}}\int _{A}\unicode[STIX]{x1D645}(\boldsymbol{x},\boldsymbol{y})\boldsymbol{\cdot }\boldsymbol{q}(\boldsymbol{y})\text{d}A(\boldsymbol{y})\nonumber\\ \displaystyle & & \displaystyle +\,\frac{1-{\it\lambda}}{8{\rm\pi}}\int _{A}\boldsymbol{v}(\boldsymbol{y})\boldsymbol{\cdot }\unicode[STIX]{x1D646}(\boldsymbol{x},\boldsymbol{y})\boldsymbol{\cdot }\boldsymbol{n}(\boldsymbol{y})\text{d}A(\boldsymbol{y}),\end{eqnarray}$$
where
 $\boldsymbol{n}$
is the outward unit normal vector at the membrane material point
 $\boldsymbol{y}$
,
 $A$
is the capsule surface and
 $\boldsymbol{q}(\boldsymbol{y})$
is the traction jump across the membrane, which can also be described as
 $$\begin{eqnarray}\boldsymbol{q}(\boldsymbol{y})=\{{\it\sigma}_{out}(\boldsymbol{y})-{\it\sigma}_{in}(\boldsymbol{y})\}\boldsymbol{\cdot }\boldsymbol{n}(\boldsymbol{y})\end{eqnarray}$$
where
 ${\it\sigma}_{in}$
and
 ${\it\sigma}_{out}$
are the stress tensors on the inner and outer surfaces of the capsule membrane, respectively. Using (2.1), the background flow field
 $\boldsymbol{v}^{\infty }$
is given by
 $$\begin{eqnarray}(v_{1}^{\infty },v_{2}^{\infty },v_{3}^{\infty })=(\dot{{\it\gamma}}(t)x_{2},0,0).\end{eqnarray}$$
The second-order tensor
 $\unicode[STIX]{x1D645}$
and the third-order tensor
 $\unicode[STIX]{x1D646}$
are the Green’s function of single- and double-layer potentials, which are defined by
 $$\begin{eqnarray}\displaystyle & \displaystyle \unicode[STIX]{x1D645}=\frac{\unicode[STIX]{x1D644}}{r}+\frac{\boldsymbol{r}\otimes \boldsymbol{r}}{r^{3}}, & \displaystyle\end{eqnarray}$$
 $$\begin{eqnarray}\displaystyle & \displaystyle \unicode[STIX]{x1D646}=6\frac{\boldsymbol{r}\otimes \boldsymbol{r}\otimes \boldsymbol{r}}{r^{5}}, & \displaystyle\end{eqnarray}$$
 $\boldsymbol{r}=\boldsymbol{x}-\boldsymbol{y}$
,
 $r=|\boldsymbol{r}|$
and
 $\unicode[STIX]{x1D644}$
is the identity tensor.
2.2. Membrane mechanics
The membrane is modelled as an isotropic and hyperelastic material that follows the neo-Hookean constitutive law. The bending rigidity is assumed to be negligible because of the small thickness, and only the in-plane stress is considered. Here, the surface deformation gradient tensor
 $\unicode[STIX]{x1D641}_{s}$
is given by
 $$\begin{eqnarray}\text{d}\boldsymbol{x}=\unicode[STIX]{x1D641}_{s}\boldsymbol{\cdot }\text{d}\boldsymbol{X},\end{eqnarray}$$
where
 $\boldsymbol{X}$
and
 $\boldsymbol{x}$
are the membrane material points of the reference and deformed states, respectively. The Cauchy stress tensor
 $\unicode[STIX]{x1D64F}$
is
 $$\begin{eqnarray}\unicode[STIX]{x1D64F}=\frac{1}{J_{s}}\unicode[STIX]{x1D641}_{s}\boldsymbol{\cdot }\frac{\partial w_{s}}{\partial \unicode[STIX]{x1D65A}}\boldsymbol{\cdot }\unicode[STIX]{x1D641}_{s}^{\text{T}},\end{eqnarray}$$
where
 $J_{s}={\it\lambda}_{1}{\it\lambda}_{2}$
represents the area dilation ratio and
 $\unicode[STIX]{x1D65A}$
is the Green–Lagrange strain tensor that is given by
 $$\begin{eqnarray}\unicode[STIX]{x1D65A}={\textstyle \frac{1}{2}}(\unicode[STIX]{x1D641}_{s}^{\text{T}}\boldsymbol{\cdot }\unicode[STIX]{x1D641}_{s}-\unicode[STIX]{x1D644}_{s}).\end{eqnarray}$$
Note that
 $\unicode[STIX]{x1D644}_{s}$
is the tangential projection operator. The strain energy function
 $w_{s}$
of the neo-Hookean constitutive law (Pozrikidis Reference Pozrikidis2003) is
 $$\begin{eqnarray}w_{s}=\frac{G_{s}}{2}\biggl({\it\lambda}_{1}^{2}+{\it\lambda}_{2}^{2}-3+\frac{1}{{\it\lambda}_{1}^{2}{\it\lambda}_{2}^{2}}\biggr)\!,\end{eqnarray}$$
where
 $G_{s}$
is the surface shear elastic modulus, and
 ${\it\lambda}_{1}$
and
 ${\it\lambda}_{2}$
are the principal extension ratios.
2.3. Numerical method
In this study, we use a numerical method developed by Walter et al. (Reference Walter, Salsac, Barthès-Biesel and Le Tallec2010) and extended by Foessel et al. (Reference Foessel, Walter, Salsac and Barthès-Biesel2011), in which the boundary element method for fluid mechanics is coupled with the finite element method for membrane mechanics. An unstructured triangular mesh with 2562 nodes and 5120 linear elements is used to discretize the capsule membrane. This corresponds to a mesh size of
 $(7.55\times 10^{-2})a$
. In the boundary element method, the Gaussian quadrature method is used to compute the integral over triangular elements. For singular elements, a polar coordinate is introduced to get rid of the
 $1/r$
singularity (Pozrikidis Reference Pozrikidis1995).
The weak form of the equilibrium equation on the capsule,
 $$\begin{eqnarray}\int _{A}\hat{\boldsymbol{u}}\boldsymbol{\cdot }\boldsymbol{q}\text{d}A=\int _{A}\hat{{\it\varepsilon}}:\unicode[STIX]{x1D64F}\text{d}A,\end{eqnarray}$$
is solved by the finite element method, where
 $\hat{\boldsymbol{u}}$
is the virtual displacement and
 $\hat{{\it\varepsilon}}$
is the virtual strain. Note that small bending stiffness is implicitly included from the numerical method (Walter et al.
Reference Walter, Salsac, Barthès-Biesel and Le Tallec2010).
The membrane velocity is given by the kinematic condition:
 $$\begin{eqnarray}\frac{\text{d}\boldsymbol{x}}{\text{d}t}=\boldsymbol{v}(\boldsymbol{x}).\end{eqnarray}$$
An explicit second-order Runge–Kutta method is used to update the position of the membrane material points.
2.4. Parameters
Three non-dimensional parameters are considered: the capillary number
 $\mathit{Ca}$
, the non-dimensional frequency
 $f/\dot{{\it\gamma}}_{0}$
and the viscosity ratio
 ${\it\lambda}$
. The capillary number,
 $$\begin{eqnarray}\mathit{Ca}=\frac{{\it\mu}\dot{{\it\gamma}}_{0}a}{G_{s}},\end{eqnarray}$$
describes the strength of the viscous force relative to the elastic force of the membrane. The non-dimensional frequency, which is similar to the Strouhal number, describes the frequency of the oscillation compared with the strength of the shear rate.
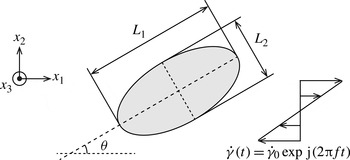
To quantify the behaviour of the capsule, we analyse the deformation amplitude and phase. The deformation amplitude of the capsule is evaluated using the Taylor parameter,
 $$\begin{eqnarray}D_{12}=\frac{|L_{1}-L_{2}|}{L_{1}+L_{2}},\end{eqnarray}$$
where
 $L_{1}$
and
 $L_{2}$
are the lengths of the principal axes of the capsule in the shear plane, as shown in figure 1. The orientation angle
 ${\it\theta}$
is defined by the angle between the major principal axis of the capsule and the axis
 $x_{1}$
.
Schematic of problem statement and the capsule deformation parameters.

We use graphics processing unit (GPU) computing to speed up the computation. This technique gives 10–100-fold acceleration compared with conventional CPU computing (Matsunaga et al. Reference Matsunaga, Imai, Omori, Ishikawa and Yamaguchi2014).
3. Leading-order prediction
When the applied frequency is high, which corresponds to a small strain
 ${\it\gamma}_{0}\ll 1$
, the small deformation of a capsule may be predicted analytically by the perturbation method (Cox Reference Cox1969; Frankel & Acrivos Reference Frankel and Acrivos1970). We evaluate the leading order of the deformation under oscillating shear flow by applying the equations of small deformation theory proposed by Barthès-Biesel & Rallison (Reference Barthès-Biesel and Rallison1981) and Barthès-Biesel & Sgaier (Reference Barthès-Biesel and Sgaier1985). Under the assumption of small deformation
 ${\it\varepsilon}\ll 1$
, they analysed the deformation of a purely elastic capsule by solving the time evolution of tensors
 $\unicode[STIX]{x1D63C}$
and
 $\unicode[STIX]{x1D63D}$
:
 $$\begin{eqnarray}\displaystyle & \displaystyle \frac{\partial ^{\ast }}{\partial t}\unicode[STIX]{x1D63C}=\frac{5}{2{\it\lambda}+3}\unicode[STIX]{x1D640}+\frac{{\it\varepsilon}}{\mathit{Ca}}\biggl(\frac{1}{2{\it\lambda}+3}\unicode[STIX]{x1D647}+\frac{10({\it\lambda}+1)}{(19{\it\lambda}+16)(2{\it\lambda}+3)}\unicode[STIX]{x1D648}\biggr)+O\biggl(\frac{{\it\varepsilon}^{2}}{\mathit{Ca}}\biggr), & \displaystyle\end{eqnarray}$$
 $$\begin{eqnarray}\displaystyle & \displaystyle \frac{\partial ^{\ast }}{\partial t}\unicode[STIX]{x1D63D}=\frac{5}{2{\it\lambda}+3}\unicode[STIX]{x1D640}+\frac{{\it\varepsilon}}{\mathit{Ca}}\biggl(\frac{1}{2{\it\lambda}+3}\unicode[STIX]{x1D647}+\frac{2(3{\it\lambda}+2)}{(19{\it\lambda}+16)(2{\it\lambda}+3)}\unicode[STIX]{x1D648}\biggr)+O\biggl(\frac{{\it\varepsilon}^{2}}{\mathit{Ca}}\biggr), & \displaystyle\end{eqnarray}$$
 $\partial ^{\ast }/\partial t$
indicates the Jaumann derivative,
 ${\it\varepsilon}$
is an infinitesimal number,
 $\unicode[STIX]{x1D640}$
is the rate-of-strain tensor and
 $\unicode[STIX]{x1D647}$
and
 $\unicode[STIX]{x1D648}$
are the second-order tensors
 $$\begin{eqnarray}\displaystyle & \unicode[STIX]{x1D647}=12\unicode[STIX]{x1D63C}-22\unicode[STIX]{x1D63D}, & \displaystyle\end{eqnarray}$$
 $$\begin{eqnarray}\displaystyle & \unicode[STIX]{x1D648}=-24\unicode[STIX]{x1D63C}+40\unicode[STIX]{x1D63D}. & \displaystyle\end{eqnarray}$$
 $$\begin{eqnarray}x_{i}=X_{i}+{\it\varepsilon}\left\{\mathsf{B}_{ij}X_{j}+\frac{1}{a^{2}}X_{j}(\mathsf{A}_{jk}-\mathsf{B}_{jk})X_{k}X_{i}\right\}+O({\it\varepsilon}^{2}),\end{eqnarray}$$
where
 $\boldsymbol{x}$
and
 $\boldsymbol{X}$
express the deformed and initial states, respectively. Integrating equations (3.1) and (3.2) from the initial spherical state to a given time
 $T$
, and neglecting terms of order
 $O({\it\varepsilon}{\it\gamma}/\mathit{Ca})$
or higher, we have the leading order of the tensor
 $\unicode[STIX]{x1D63C}$
as
 $$\begin{eqnarray}A_{12}(T)=\frac{5}{2{\it\lambda}+3}\frac{{\it\gamma}(T)}{2},\end{eqnarray}$$
and the value of the Taylor parameter at
 $T$
,
 $$\begin{eqnarray}D_{12}(\,f/\dot{{\it\gamma}}_{0},{\it\lambda},T)=\frac{5}{4{\rm\pi}\mathit{j}(\,f/\dot{{\it\gamma}}_{0})(2{\it\lambda}+3)}\exp \mathit{j}(2{\rm\pi}f\hspace{0.8pt}T).\end{eqnarray}$$
The maximum Taylor parameter
 $D_{12}^{max}$
for the applied frequency is then
 $$\begin{eqnarray}D_{12}^{max}(\,f/\dot{{\it\gamma}}_{0},{\it\lambda})=\frac{5}{4{\rm\pi}(\,f/\dot{{\it\gamma}}_{0})(2{\it\lambda}+3)}.\end{eqnarray}$$
This equation shows that the maximum Taylor parameter is inversely proportional to the applied frequency.
4. Numerical results
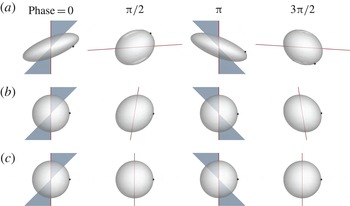
We show snapshots in figure 2 of simulations for
 $\mathit{Ca}=0.5$
,
 ${\it\lambda}=1.0$
and
 $f/\dot{{\it\gamma}}_{0}=0.01,1.0,100.0$
. In the case of low frequency,
 $f/\dot{{\it\gamma}}_{0}=0.01$
, the capsule has large deformation with membrane rotation, which is known as tank-treading motion. The deformation becomes smaller with increasing applied frequency, and the capsule maintains a nearly spherical shape in the case of
 $f/\dot{{\it\gamma}}_{0}=100.0$
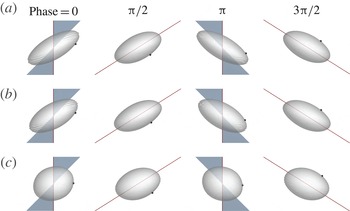
. When the viscosity ratio is changed with frequency kept constant, the capsule has larger deformation for a lower viscosity ratio, as shown in figure 3.
Capsule motion at
 $\mathit{Ca}=0.5$
and
 ${\it\lambda}=1.0$
with frequency (a)
 $f/\dot{{\it\gamma}}_{0}=0.01$
, (b)
 $f/\dot{{\it\gamma}}_{0}=1.00$
and (c)
 $f/\dot{{\it\gamma}}_{0}=100.0$
. The black dot is a material point to show the rotation of the membrane. The (red online) line and (blue online) triangle show the fluid strain and shear rate, respectively.

Capsule motion at
 $\mathit{Ca}=0.5$
and
 $f/\dot{{\it\gamma}}_{0}=0.1$
with viscosity ratio (a)
 ${\it\lambda}=0.5$
, (b)
 ${\it\lambda}=1.0$
and (c)
 ${\it\lambda}=5.0$
.

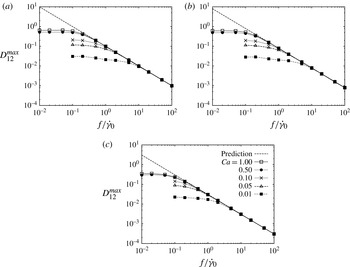
Maximum Taylor parameter
 $D_{12}^{max}$
during a single oscillation for a capsule with (a)
 ${\it\lambda}=0.5$
, (b)
 ${\it\lambda}=1.0$
and (c)
 ${\it\lambda}=5.0$
.

4.1. Deformation amplitude and phase
First, we investigate the deformation amplitude and compare it with the leading-order prediction. The maximum Taylor parameter
 $D_{12}^{max}$
is shown in figure 4 for capsules at a quasi-steady state with viscosity ratios
 ${\it\lambda}=0.5$
, 1.0, 5.0. In the high-frequency range, the maximum deformation decreases as
 $f^{-1}$
as the frequency increases, and converges to the same line regardless of the capillary number. This tendency is same as drops undergoing oscillating extensional flow (Sarkar & Schowalter Reference Sarkar and Schowalter2001a
,Reference Sarkar and Schowalter
b
). Figure 4 also shows that the leading-order prediction (3.8) well describes the deformation in the high-frequency range, and hence the deformation at high frequencies is only determined by the viscosity ratio. By contrast, the deformation has a large deviation from the leading-order prediction in the low-frequency range. Because the membrane elasticity resists against the applied strain, the resultant deformation depends on both the capillary number and viscosity ratio.
We next analyse the phase of the deformation. Using the discrete Fourier transform, the largest power spectrum of the deformation
 $D_{0}$
and its deformation phase
 ${\it\delta}_{D}$
are given as
 $$\begin{eqnarray}D_{12}(t)=D_{0}\exp \mathit{j}(2{\rm\pi}ft+{\it\delta}_{D}).\end{eqnarray}$$
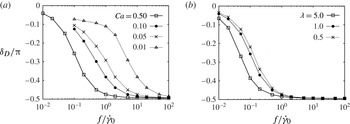
The deformation phase is shown in figure 5 for different capillary numbers and viscosity ratios. The deformation phase shifts from the phase of the applied shear rate (
 ${\it\delta}_{D}=0$
) to the strain (
 ${\it\delta}_{D}=-{\rm\pi}/2$
) for all cases. In the low-frequency range, the deformation is determined by the equilibrium between the shear stress and membrane tension, and hence follows the shear rate. In the high-frequency range, however, the deformation is limited by the strain, and the phase converges to the strain phase as predicted by (3.7). This phase shift toward the phase of the strain occurs at a lower frequency for higher capillary number or viscosity ratio because the relative effect of membrane elasticity is smaller. Zhao & Bagchi (Reference Zhao and Bagchi2011) also reported the same tendency, although their results are limited to
 ${\it\lambda}=1.0$
.
Phase difference of the Taylor parameter with (a) constant viscosity ratio (
 ${\it\lambda}=1.0$
) and varying capillary number; (b) constant capillary number (
 $\mathit{Ca}=0.5$
) and varying viscosity ratio.

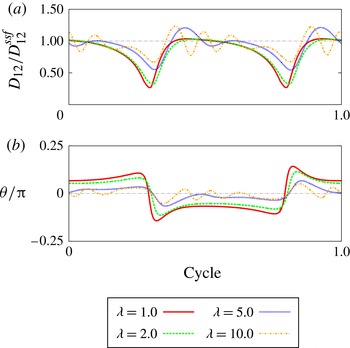
Time history of (a) Taylor parameter and (b) orientation angle for viscosity ratio
 ${\it\lambda}=5.0$
and non-dimensional frequency
 $f/\dot{{\it\gamma}}=0.01$
.

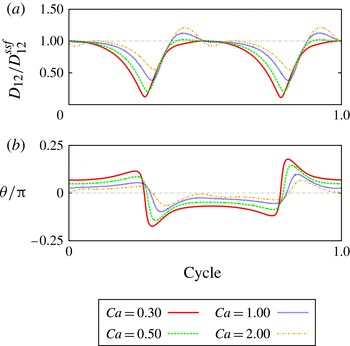
Time history of (a) Taylor parameter and (b) orientation angle for capillary number
 $\mathit{Ca}=2.0$
and non-dimensional frequency
 $f/\dot{{\it\gamma}}=0.01$
.

4.2. Overshoot phenomenon
We focus more attention on the deformation in the low-frequency range. We find that the overshoot phenomenon appears at low frequencies, leading to a larger deformation than that in steady shear flow. Figure 6 shows the time histories of the normalized Taylor parameter
 $D_{12}/D_{12}^{ssf}$
and orientation angle
 ${\it\theta}$
for
 ${\it\lambda}=5.0$
, where
 $D_{12}^{ssf}$
is the steady-state Taylor parameter under simple shear flow. In the case of low capillary number, the deformation has only a single peak in a half-cycle and the maximum deformation is nearly the same as
 $D_{12}^{ssf}$
. When the capillary number increases, however, the capsule deformation has more than one local maximum. The maximum deformation is observed at the first peak, and it is larger than
 $D_{12}^{ssf}$
. This overshoot phenomenon also appears more easily at higher viscosity ratio. As the viscosity ratio increases, the deformation and orientation tend to oscillate within a half-cycle, as shown in figure 7, and this motion is similar to the swinging motion of ellipsoidal capsules in simple shear flow (Kessler, Finken & Seifert Reference Kessler, Finken and Seifert2008; Bagchi & Kalluri Reference Bagchi and Kalluri2011; Walter, Salsac & Barthès-Biesel Reference Walter, Salsac and Barthès-Biesel2011).
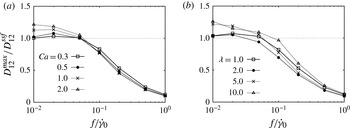
Figure 8 shows that the overshoot phenomenon appears in a wide range of low frequencies when the capillary number or viscosity ratio is high. For example, in the case of
 $\mathit{Ca}=2.0$
and
 ${\it\lambda}=10.0$
, 26 % overshoot is observed at
 $f/\dot{{\it\gamma}}_{0}$
= 0.01. At the low-frequency limit (
 $f/\dot{{\it\gamma}}_{0}\rightarrow 0$
), the deformation will follow the phase of the shear rate and reach the equilibrium deformation at the instantaneous shear rate over the course of the cycle. Therefore, the overshoot phenomenon is not expected and the capsule deformation converges to
 $D_{12}^{ssf}$
when
 $f/\dot{{\it\gamma}}_{0}\rightarrow 0$
.
Maximum Taylor parameter
 $D_{12}^{max}$
normalized by the steady-state Taylor parameter under simple shear flow condition
 $D_{12}^{ssf}$
, with (a)
 ${\it\lambda}=5.0$
and (b)
 $Ca=2.0$
.

Note that the overshoot phenomenon is caused by the interplay between the rotational and extensional components of simple shear flow, and thus it does not appear in the oscillating extensional flow of Sarkar & Schowalter (Reference Sarkar and Schowalter2001b ). In the following section, we will discuss the mechanism of the overshoot phenomenon in detail.
4.3. Mechanism of overshoot phenomenon
The overshoot phenomenon is also seen in the transient deformation under simple shear flow (Ramanujan & Pozrikidis Reference Ramanujan and Pozrikidis1998), where the flow is applied to an initially spherical capsule by start-up shear flow. Note that this case is not the same with the low-frequency limit, because the step function includes all of the wavenumbers. The start-up shear flow does not change the shear rate over the time, and therefore we discuss the mechanism of the overshoot phenomenon using this simplest case.
The start-up shear flow,
 $$\begin{eqnarray}(v_{1}^{\infty },v_{2}^{\infty },v_{3}^{\infty })=(\dot{{\it\gamma}}x_{2},0,0),\end{eqnarray}$$
consists of the extensional flow
 $E_{12}^{\infty }=E_{21}^{\infty }=\dot{{\it\gamma}}/2$
and the rotational flow
 ${\it\Omega}_{12}^{\infty }=-{\it\Omega}_{21}^{\infty }=\dot{{\it\gamma}}/2$
. While the extensional flow elongates the capsule into the direction
 ${\it\theta}={\rm\pi}/4$
, the rotational flow rotates the capsule clockwise, where
 ${\it\theta}$
is the angle from the velocity direction
 $x_{1}$
. During the transient phase of the start-up shear flow, an initially spherical capsule gradually deforms into an ellipsoidal shape. Meanwhile, the orientation of the major axis of the capsule decreases from
 ${\it\theta}={\rm\pi}/4$
to a lower angle. Finally, the capsule reaches equilibrium deformation and orientation, and exhibits the steady tank-treading motion. During this process, the effective extension rate decreases with decreasing orientation angle, which may be estimated by
 $$\begin{eqnarray}\dot{{\it\varepsilon}}({\it\theta})=\frac{\dot{{\it\gamma}}}{2}\sin 2{\it\theta}.\end{eqnarray}$$
At steady state, the effective extensional flow may be balanced with the flow generated by the membrane restoring force at the orientation angle
 ${\it\theta}={\it\theta}^{ssf}$
, where
 ${\it\theta}^{ssf}$
is the steady-state orientation angle. We plot the time history of the Taylor parameter
 $D_{12}$
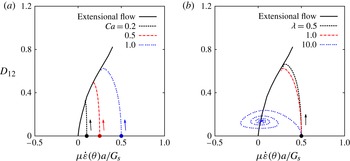
under start-up shear flow in figure 9 as a function of the effective extension rate. The steady-state Taylor parameter under simple extensional flow (without rotational flow) is also shown for comparison. As expected, the steady-state deformation in start-up shear flow is almost the same as that in simple extensional flow. Because the effective extensional force is the strongest at
 ${\it\theta}={\rm\pi}/4$
and becomes smaller as
 ${\it\theta}$
decreases, the capsule first exhibits the largest deformation, and then its deformation decreases until reaching its steady orientation. Note that this process is not a monotonic process, in particular for high viscosity ratio. For example, in the case of
 ${\it\lambda}=10.0$
, the effective extensional flow is also cancelled by the flow due to the membrane restoring even at a different orientation from the final one, but the resultant flow field still has the membrane velocity normal to the membrane. The capsule therefore shows swinging-like motion with the spiral trajectory (repeating overshoot and undershoot) before the steady tank-treading motion. This is the same phenomenon as that found in figure 7.
Time history of Taylor parameter
 $D_{12}$
in start-up shear flow as a function of the effective extension rate
 ${\it\mu}\dot{{\it\varepsilon}}({\it\theta})a/G_{s}$
for (a) viscosity ratio
 ${\it\lambda}=1.0$
and (b) capillary number
 $\mathit{Ca}=1.0$
. Filled circles indicate the initial conditions. Steady Taylor parameter in simple extensional flow is also shown. The Taylor parameter in start-up shear flow finally converges to that in simple extensional flow.

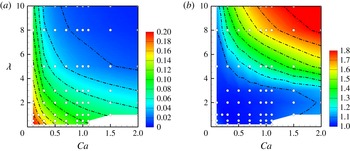
Under the mechanism of the overshoot phenomenon mentioned above, a capsule would experience larger overshoot when it has a smaller orientation angle at steady state. The steady orientation angle and normalized maximum Taylor parameter in the start-up shear flow are shown in figure 10(a,b) for various capillary numbers and viscosity ratios. When the capillary number or the viscosity ratio is larger, the capsule has a smaller
 ${\it\theta}^{ssf}$
, resulting in larger overshoot. For example, the capsule with
 ${\it\lambda}>8.0$
always shows more than 10 % overshoot except for very small capillary number (
 $\mathit{Ca}<0.1$
). Thus, the orientation angle
 ${\it\theta}^{ssf}$
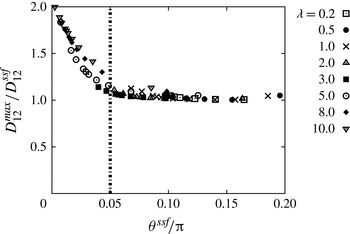
should be an indicator for the tendency to overshoot. We plot the maximum deformation as a function of orientation angle in figure 11. In the case of neo-Hookean capsules, for example, one can expect that the capsule has an overshoot when
 ${\it\theta}^{ssf}/{\rm\pi}<0.05$
(
 ${\it\theta}^{ssf}<9.0^{\circ }$
).
Diagram showing (a) orientation angle
 ${\it\theta}^{ssf}/{\rm\pi}$
and (b) normalized maximum Taylor parameter
 $D_{12}^{max}/D_{12}^{ssf}$
under start-up shear flow. White circular plots show conditions used to generate the contour.

Relationship between normalized maximum Taylor parameter
 $D_{12}^{max}/D_{12}^{ssf}$
and orientation angle in steady state
 ${\it\theta}^{ssf}$
, under simple shear flow.

Because the start-up shear flow gives the largest strain to the capsule among the oscillating shear flows with the same peak shear rate
 $\dot{{\it\gamma}}_{0}$
, the results shown in figures 10 and 11 can be used for evaluating the upper limit of deformation under oscillating shear flows.
4.4. Threshold frequency
We have shown that there are two frequency ranges: (i) the low-frequency range where the deformation is weakly dependent on the frequency and the overshoot phenomenon likely occurs; and (ii) the high-frequency range where the deformation decreases of the order of
 $f^{-1}$
and is predicted by (3.8). It is useful to estimate the threshold frequency between these two ranges. At the low-frequency limit, the maximum deformation converges to
 $D_{12}^{max}\rightarrow D_{12}^{ssf}$
, as discussed in § 4.2. Substituting
 $D_{12}^{max}=D_{12}^{ssf}$
into the left-hand side of (3.8), we obtain
 $$\begin{eqnarray}(\,f/\dot{{\it\gamma}}_{0})_{th}=\frac{5}{4{\rm\pi}D_{12}^{ssf}(2{\it\lambda}+3)}.\end{eqnarray}$$
Equation (4.4) allows us to roughly estimate the threshold frequency just by knowing the values of the viscosity ratio
 ${\it\lambda}$
and the Taylor parameter
 $D_{12}^{ssf}$
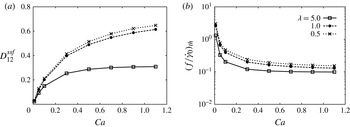
under simple shear flow. An example is shown in figure 12 for neo-Hookean capsules. Using the values of
 $D_{12}^{ssf}$
, the corresponding threshold frequencies can be derived. We can see that the threshold frequency has a weak dependence on the capillary number when the capillary number is high. Because (4.4) does not include the membrane properties, it would be also applicable to other deformable particles, such as bubbles and drops.
(a) Maximum Taylor parameter
 $D_{12}^{ssf}$
under simple shear flow as a function of capillary number. (b) Threshold frequency
 $(\,f/\dot{{\it\gamma}}_{0})_{th}$
that divides the two regimes. The values are estimated from (4.4) and
 $D_{12}^{ssf}$
.

5. Conclusion
In the present study, we have investigated the capsule deformation in oscillating shear flow in the Stokes flow regime. We have focused on the overshoot phenomenon, in which the deformation of the capsule is larger than that in the corresponding steady shear flow. The capsule shows a larger overshoot for larger capillary number or viscosity ratio. Using the maximum deformation in start-up shear flow, we evaluated the upper limit of deformation for a given capillary number and viscosity ratio. We also showed that the overshoot phenomenon likely appears when the quasi-steady orientation angle in steady shear flow is
 ${\it\theta}^{ssf}/{\rm\pi}<0.05$
(
 ${\it\theta}^{ssf}<9.0^{\circ }$
). Finally, we proposed a simple equation to estimate the threshold frequency between the low-frequency range, where the capsule may experience overshoot, and the high-frequency range, where the deformation is given by the leading-order prediction. This equation only includes the viscosity ratio and the Taylor parameter in steady shear flow, and hence it can be simply extended to other deformable particles, such as bubbles and drops.
Compared with steady shear flow, the behaviour of capsules in oscillating shear flow has not been well investigated. Because the present study covers a wide range of frequencies, including both small and large deformation regions, our findings will be useful in understanding the nature of capsules in Stokes flow.