Introduction
K-bearing, aluminous, dioctahedral micas such as illite, muscovite, and phengite, are very abundant in nature and occur, for example, in diagenetically altered sediments, soils, low-grade metamorphic rocks, and igneous and hydrothermal systems (Bailey Reference Bailey and Bailey1984; Mottana et al. Reference Mottana, Sassi, Thompson and Guggenheim2004 and references therein). Ideally, their 2:1 layers are composed of a sheet of edge-sharing Al3+ octahedra set between two sheets of Si4+ tetrahedra. In dioctahedral micas, one out of three octahedral sites is vacant. Isomorphic substitutions can occur both in octahedral and tetrahedral sheets to produce a layer-charge deficit which is compensated by interlayer K+ cations. Interactions between adjacent layers are relatively weak and produce energetic similarity of polytypes with different layer stacking. Two or more polytypes can coexist even within a crystal. Whereas polytypes differ mainly by their stacking sequences, polymorphs result from different locations of the octahedral vacancy within the 2:1 layer. The average polytypic/polymorphic components of a sample can be determined using X-ray diffraction (XRD) or thermo-gravimetric analysis (TGA) (Drits et al. Reference Drits, Plançon, Sakharov, Besson, Tsipursky and Tchoubar1984, Reference Drits, Weber, Salyn and Tsipursky1993, Reference Drits, Lindgreen, Salyn, Ylagan and McCarty1998; Bailey Reference Bailey1988; Emmerich et al. Reference Emmerich, Madsen and Kahr1999; Drits and Sakharov Reference Drits and Sakharov2004; Zviagina et al. Reference Zviagina, Sakharov and Drits2007). Determining the structure of individual particles requires a local probe, and electron microscopy techniques are ideal candidates. Periodicity normal to the 2:1 layers and the occurrence and nature of stacking faults can be determined from electron diffraction (ED) patterns or high-resolution images collected with the incident electron beam parallel to the layers (Kogure and Banfield Reference Kogure and Banfield1998; Kogure and Nespolo Reference Kogure and Nespolo1999; Kameda et al. Reference Kameda, Miyawaki, Kitagawa and Kogure2007; Kogure and Kameda Reference Kogure and Kameda2008; Kogure et al. Reference Kogure, Kameda and Drits2008). As a possible alternative to the latter approach, Gaillot et al. (Reference Gaillot, Drits, Veblen and Lanson2011) showed that ED patterns collected along the [001] zone axis can also be used to determine the periodicity along the stacking direction from hk0 intensities and to obtain structural information such as location of the octahedral vacancy. This method is more limited than when crystals are oriented normal to [001]. But a minimal sample preparation (a drop of a diluted suspension dried on the support) produces many well oriented crystals quickly and both morphological and structural information is then available.
The morphology of illite, muscovite, and phengite, and possibly their (qualitative) chemistry, were shown to be correlated to crystal structure (Lanson et al. Reference Lanson, Beaufort, Berger, Baradat and Lacharpagne1996, Reference Lanson, Beaufort, Berger, Bauer, Cassagnabere and Meunier2002; Patrier et al. Reference Patrier, Beaufort, Laverret and Bruneton2003; Laverret et al. Reference Laverret, Patrier Mas, Beaufort, Kister, Quirt, Bruneton and Clauer2006). This link could not be established unambiguously using global methods such as XRD, TGA, or infrared (IR) spectroscopy, however, and the method proposed here thus provides a unique opportunity to (in)validate the established qualitative relationships from the characterization of individual, finely divided crystals. If valid, this relationship may be important in determining structure characteristics of mica crystals coating quartz grains in relation to their impact on oil reservoir quality, especially on permeability (Morris and Shepperd Reference Morris and Shepperd1982; Pallatt et al. Reference Pallatt, Wilson and McHardy1984; Kantorowicz Reference Kantorowicz1990; Pevear Reference Pevear1999; Wilson et al. Reference Wilson, Wilson and Patey2014). Crystal morphologies ranging from one-dimensional (1D) "hairy" illite to more isometric pseudo-hexagonal 2D plates were reported for illite as a function of maximum burial depth and size fraction in sandstone reservoirs (Lanson et al. Reference Lanson, Beaufort, Berger, Bauer, Cassagnabere and Meunier2002 and references therein; Wilson et al. Reference Wilson, Wilson and Patey2014). A structural control on crystal morphology could determine the origin of the morphological variability. The possibility of determining the morphology, dimensions, and crystal structure of individual plates may have implications for crystal growth mechanisms of the different polytype/polymorphs.
Convergent-beam electron diffraction (CBED) patterns can also be used to determine periodicity along the c*-axis from both hk0 and hk1 reflections of the zero- and first-order Laue zones (ZOLZ and FOLZ) using minimal sample preparation and crystal orientation (Beermann and Brockamp Reference Beermann and Brockamp2005). CBED application to clay minerals has been limited, however, because: (1) diffraction intensity is very weak beyond hk0 spots and hk1 spots from the FOLZ because clay-size micas occur as thin crystals composed mainly of weakly scattering atoms (Si, Al, Mg, O); (2) stacking defects are common even in well ordered dioctahedral aluminous micas, and the defects induce elongated reciprocal rods along the c*-axis; and finally (3) although CBED patterns allow collection of diffraction patterns from a limited crystal surface area (a few nm2), thus limiting variation in crystal orientation, the high electron dose required for CBED pattern collection, with the electron beam fully condensed on the mica crystals, often results in sample damage, ranging from amorphization to crystal ‘drilling’. Beam damage also occurs when cis-vacant (see below) layers of illite and smectite and trans-vacant layers of nontronite are imaged at high resolution. In these cases, layers dehydroxylate owing to the high electron dose which results in cation migration from one octahedral site to another (Kogure and Drits Reference Kogure and Drits2010). In contrast, conventional parallel-illumination ED (selected-area electron diffraction, SAED) requires very low electron dose compared to CBED, while producing averaged intensities over a larger ZOLZ area (Vincent and Midgley Reference Vincent and Midgley1994). SAED allows the retrieval of layer stacking information in the direction parallel to the electron beam (Gaillot et al. Reference Gaillot, Drits, Veblen and Lanson2011). Information on the vacancy location (polymorphism – cis- or trans-vacant configuration) can also be obtained for the 1M polytype.
Charge-coupled device (CCD) cameras on microscopes allow the recording of quantitative intensities for ED spots. Structure identification remains challenging, however, owing to the camera dynamics needed to record ED patterns equal to the high quality achievable with films or recording plates. A small beam stop commonly used to avoid saturating the CCD camera is essential also to avoid masking part of the ED pattern. A small beam stop allows the optimization of orientation during data collection and the analysis of the diffraction intensity distribution. However, intrinsic properties of mica crystals further impair quantitative analysis. The coexistence and interstratification of polytypic and polymorphic varieties within a crystal was addressed by Gaillot et al. (Reference Gaillot, Drits, Veblen and Lanson2011), together with the impact of variable crystal thickness on mica ED patterns. In addition, mica plates may be bent or have growth steps or variable chemical compositions, which result in inhomogeneous local diffraction conditions. The objective of the present study was to investigate the influence of these additional parameters on the intensity diffracted by dioctahedral 2:1 micas, and to propose the identification criteria for mica polytypes using qualitative intensity distributions within [001] ED patterns, together with development of a database of ED patterns for a selected set of crystal orientations.
STRUCTURE MODELS AND METHODS
Structure Models
The structural formula for K-bearing aluminous dioctahedral micas (Bailey Reference Bailey and Bailey1984) is:

where octahedral R 2+ cations are Mg2+ and Fe2+. To simplify structure models, the interlayer site was assumed to host 1.0 K+ cations per O10(OH)2. Al3+-for-Si4+ and Mg2+-for- Al3+ substitutions and H were ignored because they have negligible effects on the structure factors of hkℓ reflections, leading to the following simplified composition:

A complete Fe2+,3+-for-Al3+ substitution in the octahedra, as in celadonite [ideally K[VI](Fe3+Fe2+)[IV]Si4O10(OH)2], was investigated to show the effect of the greater scattering. Unit-cell parameters and atomic coordinates were kept constant despite the ionic radii difference between Fe and Al. Similarly, Na+-for-K+ replacement, as in paragonite [ideally Na[VI](Al2)[IV](Si3Al)O10(OH)2], on ED intensity distribution was assessed.
Trans- and cis-vacant 1M polymorphs.
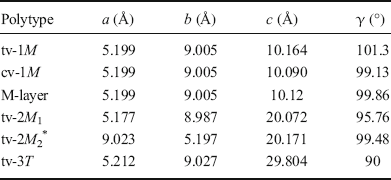
In ideal one-layer monoclinic (1M) mica polytypes, all 2:1 layers have the same azimuthal orientation, and the layer displacement T x is about –a/3 along the a-axis, a being defined from the orthogonal C-centered cell described by Bailey (Reference Bailey1988) and given in Table 1 (b = a√3, γ = 90°). Where the octahedral M1 site is empty and M2 and M2′ are filled, the 2:1 layer is trans-vacant (tv) with a C2/m symmetry. When the M2 (or M2′) site is vacant and M1 and M2′ (or M2) sites are occupied, the 2:1 layer is cis-vacant (cv) with a C2 symmetry (Bailey Reference Bailey and Bailey1984). The two polymorphs possess identical layer plane unit-cell dimensions (a, b, γ) and layer-to-layer distance (T z = c·sinβ) for identical compositions (Drits et al. Reference Drits, Plançon, Sakharov, Besson, Tsipursky and Tchoubar1984). They differ, however, by their layer displacement along the a-axis with T x = c·cosβ values of -0.383a and -0.308a, for tv- and cv-1M, respectively (Table 1; Drits et al. Reference Drits, Plançon, Sakharov, Besson, Tsipursky and Tchoubar1984). Coordinates of the octahedral sites also differ slightly between the two polymorphs. Because tv and cv layers can coexist within 1M mica crystals (McCarty and Reynolds Reference McCarty and Reynolds1995; Drits and McCarty Reference Drits and McCarty1996; Ylagan et al. Reference Ylagan, Altaner and Pozzuoli2000), random interstratifications are averaged by diffraction to produce a simplified cell (M-cell). In the average M-cell, the octahedral sheet is not distorted, octahedral sites are partially occupied, and the interlayer displacement T x is -0.333a (Drits et al. Reference Drits, Plançon, Sakharov, Besson, Tsipursky and Tchoubar1984). Crystals with interstratifications having contrasting proportions of tv and cv layers may be described by varying the occupancy of M1, M2, and M2′ sites (w 1, w 2, and w 2′, respectively). For example, w 1 = 0 and w 2 = w 2′ = 1 [M-cell with (0:1:1)] correspond to tv-1M micas, whereas w 1 = w 2 = 0.5 and w2′ = 1 [M-cell with (0.5:0.5:1)] correspond to the interstratification of tv and cv layers in a 1:1 ratio.
Unit-cell parameters for tv-1M, cv-1M, tv-2M 1, and tv-3T polytypes (α = β = 90°)

*Unit-cell parameters listed in the Russian version of the article (Zhoukhlistov et al., Reference Zhoukhlistov, Zvyagin, Soboleva and Fedotov1973) differ slightly from those reported in an earlier English version and found in the ICSD database (#89823)
2M1, 2M2, and 3T polytypes.
In two-layer monoclinic polytypes, successive layers are alternately rotated by ±120° or ±60° (2M 1 and 2M 2 polytypes, respectively). Each c-axis forms an oblique angle β with [100] and their projection onto the a-axis corresponds to the overall layer displacement of ~-a/3 (for 2 layers). In contrast to all other mica polytypes, the a vector of the 2M 2 polytype corresponds to the long dimension of the orthogonal cell in the ab-plane (with a ~ b√3), thus producing major differences for the orientation of ED patterns and subsequent analysis (see below). In the three-layer trigonal 3T polytype, successive layers are rotated by 120° with respect to the preceding layer and the overall layer displacement is null. Structure models of 2M 1 and 3T polytypes were refined from muscovite and phengite X-ray and neutron diffraction data (#86622 and #75952 of the ICSD database – Amisano-Canesi et al. Reference Amisano-Canesi, Chiari, Ferraris, Ivaldi and Soboleva1994; Liang et al. Reference Liang, Hawthorne and Swainson1998), whereas the 2M 2 model corresponds to the refinement of oblique texture ED data from a natural mica (Zhoukhlistov et al. Reference Zhoukhlistov, Zvyagin, Soboleva and Fedotov1974). Layer chemistry was simplified for each model to match Eq. 2. cv structures were modeled from those of tv polymorphs by changing occupancy of octahedral sites, while unit-cell parameters and atomic positions were kept unchanged. Unit-cell parameters are listed in Table 1 for all polytypes considered.
Theoretical ED Calculations
Dynamical effects are minor for most fined-grained mica crystals of 10–25 nm thickness if the structure consists essentially of light elements (Gaillot et al. Reference Gaillot, Drits, Veblen and Lanson2011). In addition, natural micas occur as mosaic crystals, thus reducing the likelihood of multiple scattering and further minimizing dynamical effects on ED patterns (Drits Reference Drits1987; Gaillot et al. Reference Gaillot, Drits, Veblen and Lanson2011). To assess this assumption, SAED patterns were collected using 1° and 2° precession angles of the incident electron beam to minimize dynamical diffraction effects (Vincent and Midgley Reference Vincent and Midgley1994), then compared with ED patterns obtained with no beam precession (Fig. 1). The similarity of ED patterns confirms the quasi absence of dynamical diffraction effects. Consequently, qualitative interpretation of the ED patterns used the kinematical approximation (single scattering event) only with the JEMS simulation software package (Stadelmann Reference Stadelmann1999). See Gaillot et al. (Reference Gaillot, Drits, Veblen and Lanson2011) for simulation parameters. Intensities are proportional to the square of the structure factor (F 2), modulated by the excitation error s. An s value of 0.2 nm–1 allows matching of the extension of the experimental ZOLZ region while excluding contributions from the FOLZ. Calculated intensities were displayed with a spot radius proportional to F to mimic intensity differences. Crystal thickness was not considered.
a TEM image of an isomorphic illite particle from Athabasca Basin. b–c Corresponding experimental SAED patterns along [001] acquired on the circled zone and recorded b without precession and c with a 2° angle precession of the electron beam

Experimental ED Patterns
Origins and chemical compositions of the two illite specimens investigated were described by Gaillot et al. (Reference Gaillot, Drits, Veblen and Lanson2011). Briefly, the sample from the Athabasca basin, Canada, contains both tv- and cv-1M crystals, whereas the sample from Kombolgie, Australia, is essentially a 2M 1 illite. Samples were dispersed ultrasonically in de-ionized water and deposited on Cu-mesh grids coated with a holey carbon membrane. SAED patterns were collected on Kodak negative films (Eastman Kodak Company, Rochester, New York, USA) or with a GATAN CCD camera (Gatan, Pleasanton, California, USA) using an Hitachi H9000 NAR transmission electron microscope (TEM, Hitachi, Okinawa, Japan) equipped with a LaB6 source and operated at 300 kV and a JEOL 2000fx LaB6 TEM operated at 200 kV (Jeol, Tokyo, Japan). Complementary precession ED patterns were acquired on the Nant'Themis, a S/TEM Themis Z G3 (Thermo Fisher Scientific, Waltham, Massachusetts, USA) Cs-probe corrected, monochromated, operated at 300 kV and equipped with a Complementary Metal Oxide Semiconductor (CMOS) GATAN OneView camera and the ‘Digistar’ precession system from NanoMEGAS SPRL (Brussels, Belgium).
RESULTS AND DISCUSSION
Finely dispersed mica crystals tend to settle on basal surfaces and lay on grids with the c*-direction quasi parallel to the electron beam. Intensity distributions of various polytypes oriented along the c*-axis are not sufficiently contrasting to allow for polytype/polymorph identification, however (see below). Contrast is enhanced when microcrystals are oriented with their [001], i.e. c-axis, parallel to the electron beam (Gaillot et al. Reference Gaillot, Drits, Veblen and Lanson2011). Qualitative criteria based on the intensity distribution over hk0 spots that are used for identification of the various mica polymorphs and polytypes from their [001] ED patterns are given below.
ED along [001]: Geometry, Symmetry, and Indexing
The geometry of [001] ED patterns was similar and all models had the same pseudo-hexagonal arrangement of hk0 reflections. Departure from hexagonal symmetry was marginal for 1M, 2M 1, and 2M 2 polytypes. For 1M and 2M 1 polytypes, indexing was performed with an orthogonal a*b* unit cell with a C-centered lattice. For the 2M 2 polytype (a* < b*), h′k′ indices are obtained from h′k′ indices of the 2M 1 by h′ = k and k′ = –h. The orthogonal cell was used for the 3T polytype despite its hexagonal symmetry. All ED patterns present mirror planes perpendicular to a*- and b*-axes, and hk0,
 k0, h
 0, and
 0 reflections are equivalent and are referred to hereafter as hk reflections. Intensity distributions for hk reflections differ significantly for each polytype (Gaillot et al. Reference Gaillot, Drits, Veblen and Lanson2011).
ED Patterns Calculated along [001] for 1M Polymorphs
Pure tv- and cv-1M polymorphs.
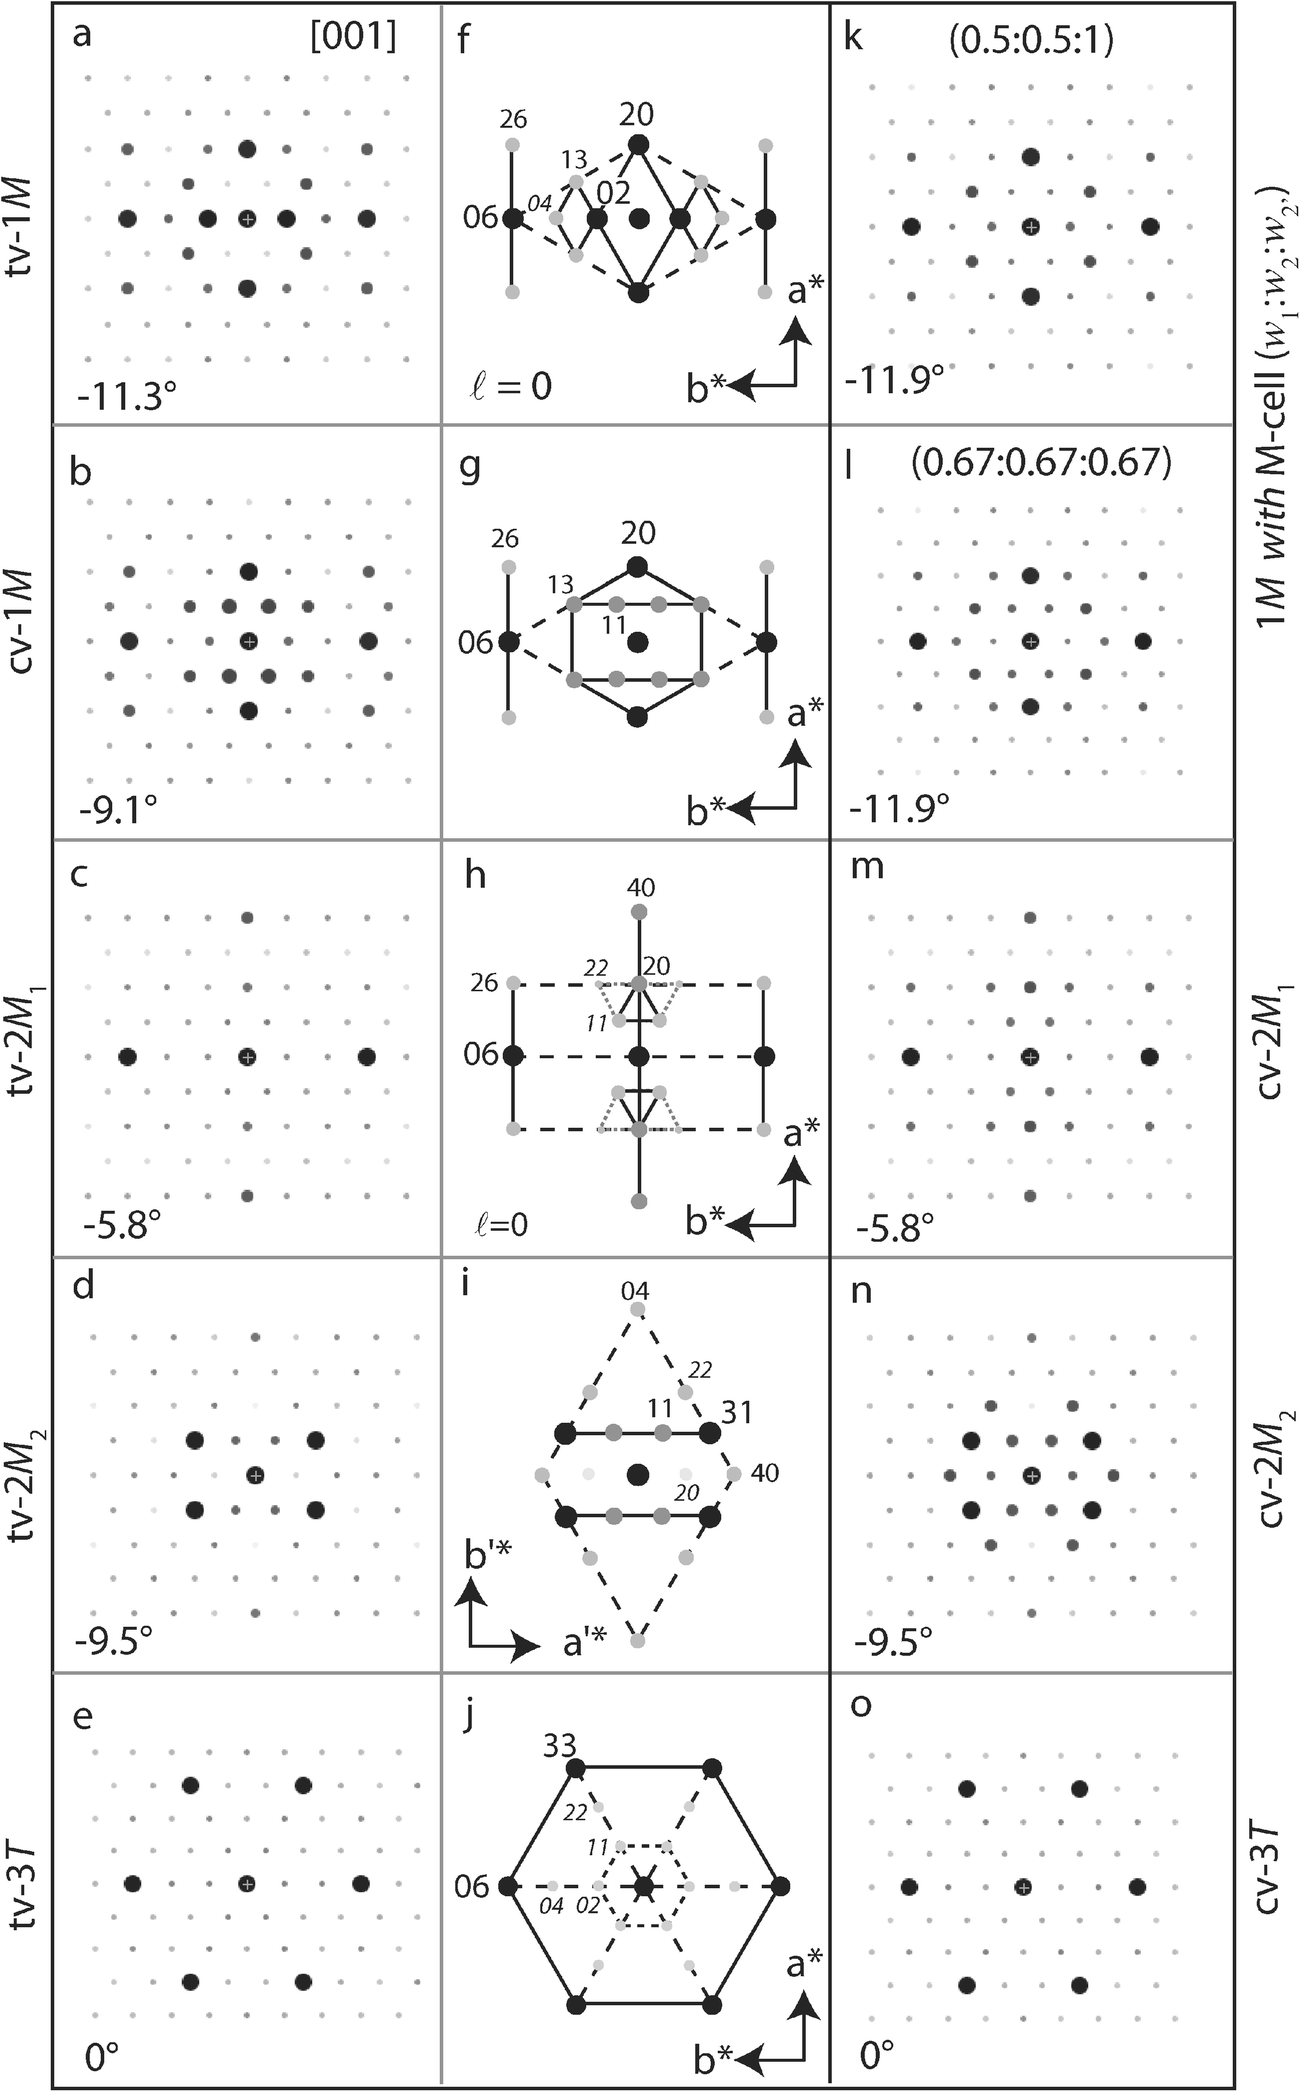
ED patterns calculated along [001] for pure tv- and cv-1M micas were described by Gaillot et al. (Reference Gaillot, Drits, Veblen and Lanson2011). The intensity distribution depends on the layer structure and the occupancy of M1 and M2 sites. For both polymorphs, 06 and 20 spots were strong and 13 and 26 reflections had similar intermediate intensities. The main difference was the intensity of 02 spots, which were much stronger than the 11 reflections for tv-1M (Fig. 2a, f), whereas the opposite was observed for cv-1M layers (M2 or M2′ site vacant, Fig. 2b, g). Similar intensity distributions were obtained when considering M-layers and site occupancies matching those of pure tv- and cv-layers [(0:1:1) and (1:0:1) occupancy probabilities, respectively, Fig. 3a, b].
ED patterns calculated using the kinematical approximation along the [001] zone axis for various polymorphs/polytypes: (Left, a–e) tv-1M; cv-1M; tv-2M 1; tv-2M 2; tv-3T. Numerical values indicate the theoretical θth angle between the [001] zone axis and the normal to the ab-plane of the crystal. (Middle, f–j) Corresponding schematic identification diagrams. Disk diameter and gray-scale intensity correspond to the intensity scale of the main hk0 reflections. Solid lines connect most intense hk0 reflections. (Right) Additional ED calculations: (k) 1M polytype considering M-cell (0.5:0.5:1); (l) 1M polytype considering M-cell (0.67:0.67:0.67); (m) cv-2M 1 polymorph; (n) cv-2M 2 polymorph; (o) cv-3T polymorph

ED patterns calculated using the kinematical approximation along the [001] zone axis for the 1M polytype considering the M-cell, for different occupancies (w1:w2:w2′) of the octahedral M1, M2, and M2′ sites : a pure tv model with M1 site empty (0:1:1); b pure cv model with M2 site empty (1:0:1); c cv model with the M2 and M2′ sites equally vacant (1:0.5:0.5); d model with an asymmetrical distribution of vacancies (0.67:0.33:1) as occurring when tv and cv layers occur in a 1:2 ratio within the crystal. hk indices are given for the brightest spots (ℓ = 0)

Partial occupation of octahedral sites.
Diffraction patterns for 1M crystals in which octahedral vacancies are distributed with equal probability over the two symmetrically related cis sites [M-cell with (1:0.5:0.5), Fig. 3c] were similar to those obtained where all vacancies occurred in a unique cis site (Fig. 2b), except for a limited weakening of 11 reflections and, thus, a lower contrast with 02 reflections. Similar differences were observed for XRD intensity distributions calculated for tv and cv polymorphs (see for example Drits et al. Reference Drits, Plançon, Sakharov, Besson, Tsipursky and Tchoubar1984, Reference Drits, Weber, Salyn and Tsipursky1993; Drits and McCarty Reference Drits and McCarty1996). Where tv and cv layers coexisted with equal probability [M-cell (0.5:0.5:1), Fig. 2k], the resulting ED pattern resembled that calculated for a pure tv layer (Fig. 2a). For a pure tv layer, weaker 02 reflections occurred, and a lower intensity contrast existed between 02 and 11 reflections. Intensities of 11 and 02 reflections were identical for tv and cv layers occurring in a 1:2 ratio within crystals. For a 1:2 tv:cv ratio, the intensity of 22 and 04 reflections increased when vacancies occurred equally over the three octahedral sites [M-cell (0.67:0.67:0.67), Fig. 2l] compared to an asymmetric distribution of vacancies over the two cis sites [M-cell (0.67:0.33:1), Fig. 3d].
Identification criteria.
When oriented along the [001] zone axis, strong 20 and 06 reflections defined a diamond-shaped distribution for 1M mica polymorphs (dashed line in Fig. 2f,g). In addition, two bright segments parallel to the a*-axis were defined by 26/06/
 6 and 2
 /0
 /
 reflections. The ED pattern of the tv-1M polymorph was further characterized by a bright diamond defined by 20 and 02 reflections and by two smaller and weaker diamonds defined by 02/13/04/
 3 and 0
 /1
 /0
 /
 reflections. In contrast, the ED pattern of the cv-1M polymorph exhibited two segments of strong reflections parallel to the b*-axis and formed by 13/11/1
 /1
 and
 3/
 1/
 /
 . The intensity distribution of 02 and 11 reflections allowed differentiating unambiguously pure tv-, with strong 02 reflections, from pure cv-1M polymorphs, with strong 11 reflections. The 11 and 02 reflections were of equal intensity when the M1 and M2 sites were occupied with a ~1:2 ratio (Figs. 2l and 3d). Quantification of trans vs. cis site occupancy from experimental data remained challenging, however, owing to the multiple factors influencing ED intensity distribution (see below).
ED Patterns Calculated along [001] and Identification Criteria for other tv/cv Polytypes
2M1 polymorphs.
The [001] ED pattern of tv-2M 1 polytype (Fig. 2c) contained three sets of intense hk reflections (06 > 20 ≈ 40 > 11 ≈ 26). In contrast to 1M polymorphs, the strongest reflections had the same indices for both tv- and cv-2M 1 (Fig. 2m). The 22 and 11 reflections were slightly more intense for the cv-2M 1 polymorph compared to tv-2M 1. However, the small difference in intensity made the experimental differentiation of the two polymorphs difficult. ED patterns of the 2M 1 exhibited two segments of high-intensity reflections parallel to the a*-axis (defined by 26/06/
 6 and 2
 /0
 /
 reflections) similar to 1M varieties. In addition, a third segment of high-intensity reflections parallel to the a*-axis was visible (defined by 40 and 20 reflections) together with two triangles of relatively bright reflections (11/1
 /20 and
 1/
 /0
 ). For tv-2M 1 polymorphs, these two triangles included 22/2
 and
 2/
 reflections, thus resulting in two enlarged and truncated triangles (gray dotted lines in Fig. 2h).
2M2 polymorphs.
For the 2M 2 polytype, the c-axis forms an oblique angle with [100], which corresponds to the long a-axis by convention, contrary to all other mica polytypes. To reach the [001] zone axis, mica crystals are tilted around the [010] axis which is parallel to the long reciprocal unit-cell vector v 1 *. The [001] ED pattern of tv-2M 2 polytype (Fig. 2d) contained three sets of intense reflections: 31 > 11 ≈ 04 reflections. In addition, the 60 spots were weak, whereas 22, 40, and 13 reflections had intermediate intensity, and all other non-extinct hk reflections, including 20 spots, were faint. The ED patterns of the 2M 2 differed from all other mica polytypes by the low intensity of 60 reflections compared to other h′k′ reflections and by the absence of bright spots aligned parallel to the b*-axis. Rather, the 2M 2 was characterized by a large diamond shape defined by 40 and 04 reflections that included all reflections with non-negligible intensity (dashed line in Fig. 2i). Differentiation of cv and tv with SAED was difficult even though 31 reflections dominated the ED pattern for the tv-2M 2 polymorph. These reflections, together with weaker 11 reflections, defined two segments of bright spots parallel to the a*-axis. For the cv-2M 2 polytype, the intensity of the latter reflections increased, making these segments more visible (Fig. 2n). The intensity of 22 reflections also increased slightly for the cv polymorph compared to the tv polymorph. When vacancies were distributed with equal probability over the two cis sites [M-cell (1:0.5:0.5)], 20 reflections appeared slightly more intense than 11 spots whereas other reflections were essentially unaffected (not shown).
3T polymorphs.
In contrast to previous cases, the [001] direction is parallel to both c- and c*-axes, and the ED pattern for tv-3T polytype (Fig. 2e) is hexagonal and exhibited six-fold rotational symmetry, with very strong and of equal intensity 06 and 33 reflections, whereas 11, 02, 22, 04, 26, and 40 spots are weak (Fig. 2j). Vacancy location has a minor influence on the intensity distribution over the ED pattern: 02 and 11 reflections are slightly more intense for the tv-3T polymorph whereas 04, 22, 40, and 26 reflections are more intense for the cv-3T polymorph (Fig. 2o). These differences are not sufficient to allow experimental differentiation of the tv-3T and cv-3T polymorphs.
Validity of Identification Criteria
Precession ED criteria.
Precession ED (PED) is used increasingly for structure identification or refinement owing to the minimal influence of dynamical effects, with limited electron beams being excited simultaneously (Vincent and Midgley Reference Vincent and Midgley1994; Gjonnes et al. Reference Gjonnes, Hansen, Berg, Runde, Cheng, Gjonnes, Dorset and Gilmore1998; Gemmi and Nicolopoulos Reference Gemmi and Nicolopoulos2007; Nicolopoulos et al. Reference Nicolopoulos, Morniroli and Gemmi2007; Moeck and Rouvimov Reference Moeck and Rouvimov2010). Those authors showed that intensities are proportional to the structure factor amplitude rather than to its squared value as in conventional ED. Although the PED intensities were different from those determined by the present calculations, qualitative distribution of intensity among bright and weak beams were similar, and identification criteria established above for SAED remained valid (Fig. 1).
Qualitative vs. quantitative criteria.
Qualitative, rather than quantitative, identification criteria were proposed in the present work (Fig. 2f–j) because of the limited availability of cameras with sensor dynamics to allow the recording of high-quality ED patterns. In addition, qualitative criteria allowed a quick assessment of the polytypic form during observation and a real-time decision for data-collection strategy. More importantly, and as discussed hereafter, numerous parameters influence the actual ED intensities beside the crystal structure: (1) crystal thickness, which is possible to assess in the microscope by using electron-energy loss spectroscopy (EELS) and by analyzing the plasmon peak, or by using beforehand shadowing treatment of the sample; (2) chemical composition, with the implicit requirement of systematic energy dispersive X-ray (EDX) spectroscopy; and (3) nature and number of structural defects (i.e. random or well defined translational or rotational stacking faults, interstratification of cv- and tv-layers or of polytypic fragments, etc.). Consequently, systematic quantitative processing of diffracted intensities is unrealistic whereas qualitative identification criteria are useful for polytypic and polymorphic varieties of dioctahedral K-bearing aluminous mica, if only a few defects are present and if the mica occurs as thin, flat crystals. Intensity ratios may be used to determine structure details, such as the relative proportion of cv and tv layers in 1M crystals from the intensity ratio between 02 and 11 reflections (Fig. 2k,l).
Influence of crystal thickness.
ED intensities were calculated here with the kinematical approximation, thus ignoring multiple scattering events that may occur for thick crystals as described by Gaillot et al. (Reference Gaillot, Drits, Veblen and Lanson2011). In the absence of beam precession capability to minimize multiple scattering effects, crystal thickness can be estimated in situ using EELS. Alternatively, the low intensity of diffracted beams compared to the direct beam will ensure that crystals are sufficiently thin to interpret intensity distribution among hkℓ spots (h and k ≤ 6). In any case, reported intensity distributions based on kinematical approximation are probably sufficient to qualitatively interpret SAED patterns and to identify polytypes and polymorphs for most crystals of microcrystalline micas, containing mostly light elements (Gaillot et al. Reference Gaillot, Drits, Veblen and Lanson2011).
Influence of local unit-cell distortions.
Except for the 1M polytype, structure models (Zhoukhlistov et al. Reference Zhoukhlistov, Zvyagin, Soboleva and Fedotov1973, Reference Zhoukhlistov, Zvyagin, Soboleva and Fedotov1974; Drits et al. Reference Drits, Plançon, Sakharov, Besson, Tsipursky and Tchoubar1984, Reference Drits, Ivanovskaya, Sakharov, Zvyagina, Derkowski, Gor'kova, Pokrovskaya, Savichev and Zaitseva2010a, Reference Drits, Zviagina, McCarty and Salyn2010b; Amisano-Canesi et al. Reference Amisano-Canesi, Chiari, Ferraris, Ivaldi and Soboleva1994; Liang et al. Reference Liang, Hawthorne and Swainson1998) used for the calculations reported here were systematically refined for tv layer configuration. As noted above, diffraction effects from cv polymorphs and structures where tv and cv layers coexist were calculated by varying the w i occupancy of M1, M2, and M2′ sites without adjustment of atomic positions. Comparison of ED patterns calculated for tv-1M and cv-1M models with adjustment of atomic positions and for the average M-layer with equivalent octahedral site occupancies (0:1:1 and 1:0:1, respectively) indicates the sensitivity of ED patterns to local distortions within the unit cell (Fig. 3a,b). This influence remains limited, however, and qualitative identification criteria remain valid for cv polymorphs of 2M and 3T polytypes. Similarly, local distortions induced by cationic substitutions can be ignored as a first approximation. However, as the occupancy of M2 and M2′ sites within cv-1M crystals influences the intensity distribution, the coexistence of vacant M2 and M2′ sites within cv-1M crystals possibly accounts for the experimental absence of expected dynamical effects, such as center of symmetry loss for cv layers (Gaillot et al. Reference Gaillot, Drits, Veblen and Lanson2011).
Influence of crystal bending.
Owing to the size of the selected-area aperture, ED intensities were averaged over a large surface area of the crystal (typically ~200 nm in diameter, although a smaller aperture can be used, if available). Variation in surface orientation with respect to the electron beam, often revealed by bending contours in the image, results in diffracted intensities being averaged, similar to mosaicity effects. Moving a small aperture over the crystal allows assessment of the effect of bending. For investigated crystals, diffraction mapping at the nanoscale showed that the orientation fluctuation remains <1–2° (not shown). As long as the crystal-surface bending is small (<1–2°), a distinctive pattern of a given polytype should be recognizable.
Influence of chemical composition on dioctahedral mica ED patterns
Mg2+-for-Al3+ or Al3+-for-Si4+ substitutions in octahedral and tetrahedral sheets have marginal influence on diffracted intensity distributions owing to the similar scattering factors of involved cations. Other cation substitutions are frequent in natural dioctahedral micas, the most common being Na+-for-K+ in paragonite and the partial substitution of Fe2+/Fe3+ for Al3+ in illite, phengite, celadonite, and glauconite (Bailey Reference Bailey and Bailey1984; Mottana et al. Reference Mottana, Sassi, Thompson and Guggenheim2004). The influence of Na+-for-K+ and Fe2+/Fe3+-for-Al3+ substitutions on ED intensity is described below for the mica polytypes. Expected lattice distortions induced by cationic radii variations or vacant octahedral sites were not considered owing to their limited effect on diffraction intensity.
Na-bearing aluminous dioctahedral mica.
Intensity distributions among hk reflections calculated for tv-1M, cv-1M, tv-2M 1, tv-2M 2, and tv-3T structure models and an idealized paragonite composition (Na[VI]Al2 [IV]Si4O12, Fig. 4a–e) differred slightly from a muscovite composition (K[VI]Al2 [IV]Si4O12, Fig. 2a–e). However, 02 and/or 11 reflections were stronger for Na vs. K micas, whereas 06 reflections were weaker. Furthermore, because 02 reflections dominate the tv-1M ED pattern, and 11 reflections dominated the cv-1M polymorph, the difference between tv- vs cv-1M was enhanced for sodic micas.
ED patterns calculated along the [001] zone axis for different polytypes and polymorphs of (left) Na-rich aluminous dioctahedral mica (NaAl2Si4O12) and (right) K-rich ferrous dioctahedral mica (KFe2Si4O12). (a–e and f–j) tv-1M; cv-1M; tv-2M 1; tv-2M 2; tv-3T. Unit-cell axes for cv-1M, tv-2M 1 and tv-3T are identical to tv-1M

K-bearing ferruginous dioctahedral mica.
Differences in intensity distributions calculated for tv-1M, cv-1M, tv-2M 1, tv-2M 2 and tv-3T models and either an idealized celadonite composition (K [VI]Fe2 [IV]Si4O12, Fig. 4f–j) or a muscovite composition (Fig. 2a–e) were marginal despite the scattering contrast between Fe and Al/Mg. For example, [001] ED patterns were similar for ferruginous and aluminous varieties of tv-3T and tv-2M 2 micas. For tv-2M 1 micas, all reflections other than 06 and 40 were weaker for the ferruginous variety compared to the aluminous mica, whereas for tv-1M and cv-1M polymorphs the 13 reflections were weaker and 26 spots stronger for the ferruginous mica compared to the aluminous mica. In all cases, the overall intensity distribution and the sets of bright hk spots were similar for both ferruginous and aluminous varieties.
ED Patterns along other Crystal Orientations
Except for the 3T polytype, the c-axis of which is perpendicular to the layer plane, all mica crystals must be rotated to be oriented along the [001] axis, the direction of which is unknown a priori. To reach the [001] axis, which forms an oblique angle with [100] (Fig. 5a), crystals that lay on the ab-plane must be rotated by a θth angle around the [010] axis. Two directions of rotation (±θ) are possible to reach the [001] zone axis. In practice, the closest zone axis is easily reached, but may differ from the [001] axis. Indeed [001] and [101] axis are tilted at about the same angle (~10°) in opposite directions for 1M polytypes. To allow for a quicker correct identification of SAED patterns oriented along [001], additional calculations were performed along a selection of [hkℓ] zone axes near the c-axis (Fig. 5a). Theoretical θth angles between the c*-axis and [hkℓ] directions are provided in Figs 6 and 7, although values determined experimentally may deviate slightly if crystals are not normal to the electron beam.
(a) Orientation of different zone axes with respect to the a (or a′) = [100] and c = [001] axes of the mica unit cell shown in projection along the b- (or b′-) axis. (b) Direction of tilt (Tt) and azimuth (Az) rotation angles for a double-tilt sample holder. (c) Decomposition of the θ angle between considered zone axis and the electron beam direction on both Tt and Az rotation angles of the TEM holder shown in (b)

ED patterns calculated for various mica polymorphs and polytypes along different zone axes: (from left to right) [103] (except for (e) [001]); [102]; [101] and [
 01] ZA. (top to bottom) tv-1M; cv-1M; tv-2M 1; tv-2M 2; tv-3T. Unit-cell vectors for cv-1M, tv-2M 1, and tv-3T are identical to tv-1M. Numerical values as in Fig. 1. hk indices are indicated above the brightest reflections, their l indices on the side for tv-1M (on top for 2M 2)


ED patterns calculated along the c*-axis.
The c*-axis is close to [103] for 1M, 2M 1, and 2M 2 polytypes (θth ≤ 1.5°) and perpendicular to the 2:1 layers, thus producing hexagonal ED patterns, similar to the 3T polytype along [001]. For all polytypes, hk reflections from the third hexagon (06 and 33 reflections) are of equal intensity and dominate the ED pattern (Figs. 6a–e). The ED pattern calculated for the 3T polytype is the only ED showing a six-fold axis, whereas those calculated for monoclinic polytypes (1M, 2M 1, and 2M 2) exhibit two mirror planes normal to a // * (projection of a* on the ZOLZ plane) and b* vectors, hkl reflections with h = 3n being the only ones observed. For well ordered crystals, extinction rules can be used as an identification criterion. Extinction rules may be violated, owing to reciprocal lattice node elongation for defective or very thin crystals.
Tilt around [010].
The geometry and intensity distributions of calculated ED patterns depend on the [u0w] zone axis considered. As a rule, relative intensities of 0k0 spots along the common b*-axis are preserved. For crystals oriented along the [102] zone axis, the ZOLZ also contains –2l k l reflections (with the h + k = –w × l + k = 2n extinction rule from C-centering). hk reflections with h ≠ 2l do not theoretically appear (unless the reciprocal rods are sufficiently elongated) leading to rectangular patterns of the brightest spots (Fig. 6f–j). For increasing tilt values (Fig. 5a), the geometry of [101] and [
 01] ED patterns (Fig. 6k–t) remains similar to that of patterns calculated along [001] (Fig. 2a–e) with only a faint stretching along the a
//
* direction. This elongation becomes significant for ED patterns calculated along [h01] with |h| ≥ 2, although the intensity distribution may still be useful for polytype identification (Fig. 7a–o). ED patterns calculated along other [h0ℓ] axes are less informative. ED patterns for tv-2M 1 along [101] and for cv-1M along [001] are alike (Figs. 6m and 2b, respectively), as are those for tv-3T along [101] and for 1M with the vacancies equally distributed over the three octahedral sites (Figs. 6o and 2l). Similarly, ED patterns for tv-2M 1 along [
 01] and for cv-1M along [101] are alike (Fig. 6r and l), as are those for tv-3T along the c- or c*-axis and for tv-1M, cv-1M, and tv-2M 1 along [103], at least for the intensity distribution among most intense reflections (Fig. 6e and a–c, respectively). These similarities may require the recording of an additional ED pattern along another [10w] ZA to determine the [001] axis.
Tilt around [100].
ED patterns calculated along [011] for tv-1M, cv-1M, tv-2M 1, tv-2M 2, and tv-3T polytypes are shown in Fig. 7p–t. For monoclinic polytypes, [001] and [100] form an oblique angle. The angle between a
//
* and b*-axis thus differs from 90° and ED patterns calculated along [011] appear significantly distorted. In addition, ED patterns calculated along [0k1], with k ≠ 0, possess lower symmetry than those calculated along [001] and the former no longer present mirror planes (even for the 3T polytype) because intensities of hkℓ,
 , and equivalent reflections are no longer equal. The center of symmetry is preserved, however, with I(hkℓ) = I(
 ) for kinematical diffraction (Friedel’s law). Symmetry lowering makes ED patterns recorded along [0k1] recognizable.
Advanced Identification Method
Different polytypes can have similar ED patterns along different zone axes, thus impairing polytype identification if the [001] zone axis is not correctly determined. Although complementary powder XRD data may indicate the major polytypes present in a sample, a suitable orientation along [001] is key to avoid polytype misidentification using the proposed criteria (Fig. 2f–j). Orientation along [001] relies on the correct identification of the [010] rotation axis and on the inclination θ of the zone axis relative to the c*-axis. ED patterns along several crystallographic directions can be useful to further constrain polytype/polymorph identification if the crystal orientation is uncertain.
Experimental considerations.
In practice, determining the appropriate rotation direction to reach the [001] axis can be challenging. A large number of stacking faults present may negate any effort, however, as the [001] direction is not unique, and thus thin crystals are usually preferred. Crystal morphology is also used to determine ED pattern orientation in the a*–b*-plane because unit-cell a or b vectors are often parallel to a crystal edge. In addition, illite lath-shaped crystals grow parallel to the [100] (Rex Reference Rex1964), and the [001] axis can be reached by rotating the crystal around the direction parallel to the short dimension (Fig. 8a–b). No absolute method exists to determine a priori how the rotation should be performed so a trial-and-error approach is necessary. However, the [001] ED patterns must possess two perpendicular mirror planes common to all patterns oriented along [u0w] axes. If this symmetry is fulfilled, the experimental SAED pattern can be compared with calculated patterns (Figs. 2 and 6) for identification. Additional tilt in the same or opposite directions allows reaching other [u0w] orientations to confirm polytype identification.
a TEM images of Athabasca Basin illite isomorphic and lath-shaped crystals; b Experimental SAED along [001] from the circled zone of the lath crystal with |θ| ~10°; c–d Experimental SAED along [101] and [001], respectively, of isomorphic Kombolgie illite crystal with experimental Tilt and Azimuthal TEM holder angles, and corresponding ZA inclination |θexp| with respect to the c*-axis deduced from Eqs 3–4

Experimental zone axis angle.
Ideally, the b*-axis is aligned with the sample holder primary rotation axis (the “Tilt” axis) and the tilt angle to reach the desired [u0w] orientation can be compared directly to the theoretical θth value (indicated in the figures). In practice, this is achieved with a “Tilt-Rotation” holder that allows rotation of the sample within the observation plane. With commonly available “Double Tilt” holders, obtaining the correct orientation requires the combination of two rotation axes (Tilt and Azimuth angles, Fig. 5b), both normal to the electron beam. In cylindrical coordinates, the inclination of the ED pattern zone axis with respect to the crystal c*-axis is defined by two angles: θ and Ω, the angles with the z -direction and between the projection of the zone axis on the ab-plane and the sample holder primary rotation (tilt) x-axis, respectively. Experimental Ω and θ angles can be computed from sample holder tilt (Tt) and azimuth (Az) rotation angles using the following equations:


where d x, d y, and h are the coordinates (in Å) of a virtual point (M) on the zone axis, along the two rotation axes (x, y) and the electron beam (z) directions, respectively (Fig. 5c). Conversely, calculating Tt and Az values to be used experimentally from the θ and Ω angles of the sought zone axis is possible:


These equations may aid in finding the orientation of the first [u0w] zone axis from the initial crystal orientation with the c*-axis close to the beam direction. The equations can also be used for multiple zone-axis data collection. In the latter case, the crystal shift upon tilting must be compensated if the crystal is not flat. To illustrate, SAED patterns were obtained for two orientations from isomorphic plates of illite from Kombolgie (Fig. 8c–d). For both patterns, the |θexp| angle calculated from the TEM holder angles (~12° and 3°, respectively) was consistent with the theoretical |θth| value calculated for the [101] and [001] ZA of the 2M 1 polytype (~9° and 6°, respectively), thus obtaining a determination of the 2M 1 polytype, despite the minor discrepancy between experimental and calculated tilt angles.
SUMMARY AND PERSPECTIVES
Qualitative criteria were provided to determine the polymorph/polytype of individual crystals of K-bearing aluminous dioctahedral micas from the intensity distribution of hk reflections from the zero-order Laue zone. Differences were enhanced for ED patterns calculated along the [001] zone-axis. ED patterns calculated along adjacent zone-axes were provided to avoid potential difficulties in obtaining unambiguously the optimum [001] orientation. The method allows retrieval of morphological and structural information from individual mica crystals. Matching the observed data to calculated patterns allows the determination of structural information from K-bearing aluminous mica crystals (illite, muscovite, or phengite), including morphology and possibly chemistry (Lanson et al. Reference Lanson, Beaufort, Berger, Baradat and Lacharpagne1996, Reference Lanson, Beaufort, Berger, Bauer, Cassagnabere and Meunier2002; Patrier et al. Reference Patrier, Beaufort, Laverret and Bruneton2003; Laverret et al. Reference Laverret, Patrier Mas, Beaufort, Kister, Quirt, Bruneton and Clauer2006).
Acknowledgments
Daniel Beaufort (IC2MP, Poitiers – France) is thanked for providing the 1M illite and 2M 1 muscovite samples. Funded by the French Contrat Plan État-Région and the European Regional Development Fund of Pays de la Loire, the CIMEN Electron Microscopy Center in Nantes is greatly acknowledged. ISTerre is part of Labex OSUG@2020 (ANR10 LABX56). Comments by two anonymous reviewers improved and clarified the initial manuscript.
Compliance with Ethical Standards
Conflict of Interest
On behalf of all authors, the corresponding author states that there is no conflict of interest.