Introduction
Teacher assessment and pupil attainment
Since the introduction of the National Curriculum in 1988, the time dedicated to standardised assessment of English pupils has increased considerably, alongside a growing requirement that much of this assessment be performed by class teachers. Teacher judgements currently dominate children's designated attainment levels within primary education. At the time of writing, the Foundation Stage Profile (FSP; covering the years up to age five) is entirely teacher-assessed, along with the newly introduced phonics screening test (taken at ages six and seven), and Key Stage One (KS1) attainment (age seven). Primary education culminates at age eleven with the awarding of Key Stage Two (KS2) grades, which in part comprise the results of external examinations, but which also incorporate ratings by teachers (Bew, Reference Bew2011a, Reference Bew2011b; Wyse et al., Reference Wyse, McCreery and Torrance2008).
This approach to assessment, with its reliance on an understanding of each child built over time rather than based simply on a one-off performance in a set test, has several arguable advantages. It avoids the lack of nuance of the one-shot test, and also the test's time-and place-dependency, which might result in an inaccurate picture of a child's abilities should they underperform on a given day, in the given situation or in response to the limited test stimuli (Harlen, Reference Harlen2007). Some evidence indicates moreover that formalised testing can be stressful and demotivating for pupils (Harlen, Reference Harlen2004, Reference Harlen2007), and it has also been suggested that exams may be counterproductive to meaningful knowledge acquisition insofar as they encourage ‘teaching to the test’ at the expense of deeper, sustainable learning and wider exploration (Harlen, Reference Harlen2007; Wyse et al., Reference Wyse, McCreery and Torrance2008). However, despite its potential advantages over more formalised and ‘objective’ measures, teacher assessment is not, in itself, entirely unproblematic.
The past decade's national statistics on the performance of English pupils have consistently indicated that certain groups achieve at lower levels than others throughout their early education. Low-income pupils in receipt of free school meals (FSM), pupils with any diagnosis of special educational needs (SEN), Pakistani, Bangladeshi, Black African and Black Caribbean pupils, as well as pupils speaking English as an additional language, are regularly reported as under-attaining in the primary phase. In addition, boys score generally at a lower level than girls at the foundation stage, although they attain higher levels at maths (and girls at English) at KS1 and KS2 (Department for Education, 2011, 2012a, 2012b).
That attainment indicators depend so heavily on teacher assessment invites the question of whether these apparent achievement gaps may to some extent be an artefact of the measurement method used. There is an enduring body of evidence which indicates that teacher assessments are subject consistently to a large and significant level of error (Brookhart, Reference Brookhart2013; Eckert et al., Reference Eckert, Dunn, Codding, Begeny and Kleinmann2006; Harlen, Reference Harlen2005), and, more importantly, research also indicates that some of this error may be systematic (Harlen, Reference Harlen2005; Robinson and Lubienski, Reference Robinson and Lubienski2011), and that there may be regular patterns of inequality in teacher judgements of English primary school pupils (Burgess and Greaves, Reference Burgess and Greaves2009; Reeves et al., Reference Reeves, Boyle and Christie2001; Thomas et al., Reference Thomas, Smees, Madaus and Raczek1998).
Bias in teacher assessment
For example, examining national KS2 data, Burgess and Greaves (Reference Burgess and Greaves2009) exploit the distinction between the teacher-assessed and externally examined components of the test, comparing marks awarded to pupils according to the two measures. They demonstrate disparities in teacher assessment which are in line with nationally reported attainment gaps: seeming under-assessment of pupils in receipt of FSM, of pupils with SEN, and of Black Caribbean and Black African pupils. This suggests that teacher-level bias may serve to inflate and deflate the overall KS2 scores allocated to each pupil.
Analysing the English sub-sample of the Millennium Cohort Study (MCS), Hansen and Jones (Reference Hansen and Jones2011) indicate that teachers may also be biased in their assessments of pupils at the beginning of primary school. They compare children's FSP scores to self-completed cognitive tests taken outside of school, and find greater disparities according to gender in the teacher-assessed FSP measure than in the child-completed tests. Teacher assessments pronouncedly favour girls to a greater extent than cognitive test performance, indicating that gender disproportionality at the foundation stage may, like inequalities at KS2, be attributable in part to biased judgements.
Qualitative research, some of it government-commissioned, has moreover begun to suggest mechanisms that might underpin these apparent biases in assessment and resultant attainment, particularly with regard to ethnic disparities. Evidence that perceptions and behaviours among teaching staff may play a part in creating variation has been provided by Maylor et al.’s (Reference Maylor, Smart, Kuyok and Ross2009: 2) evaluation of the Black Children's Achievement Programme, which concludes that, ‘Institutional factors/processes including negative teacher attitudes/expectations’ and ‘stereotypical thinking about the ability of Black children serve to undermine teacher ability to raise Black children's attainment at an individual and group level’.
Similarly, Strand et al.’s (Reference Strand, de Coulon, Meschi, Vorhouse, Frumkin, Ivins, Small, Sood, Gervais and Rehman2010:18) investigation into Drivers and Challenges in Raising the Achievement of Pupils from Bangladeshi, Somali and Turkish Backgrounds reports that: ‘Racism and structural inequalities may be important influences on the attainment of many Bangladeshi and Somali students.’ As also suggested by Burgess and Greaves’ large-scale quantitative work (Reference Burgess and Greaves2009), these studies indicate that stereotyping at the teacher-level may provide some explanation for the ostensible attainment differentials among primary school pupils.
Biased assessments through stereotyping
There are a number of theories of what stereotypes are, and of behaviours associated with their presence. Many are grounded in the premises that stereotypes comprise invariant, homogenous, evaluative judgements of a given group (e.g. income, gender or ethnic group), and that stereotypes enable judgements of group members to be made quickly and with cognitive ease (Hilton and von Hipple, Reference Hilton and von Hipple1996; McGarty et al., Reference McGarty, Yzerbyt and Spears2002.) By stereotyping, therefore, teacher judgements of pupils can be made quickly and with cognitive efficiency (though with compromised accuracy) based, in part, on a preconceived ‘template’ of the ability and attainment of low-income pupils, pupils with SEN, White pupils, Black Caribbean pupils, and so on. Stereotyping is not assumed to take place on a conscious or deliberate level: the process's efficiency is thought to be engendered by its automaticity.
Theorists argue furthermore that stereotypes must be held at the group or institutional level: ‘stereotypes should be formed in line with the accepted views or norms of social groups that the perceiver belongs to’ (McGarty et al., Reference McGarty, Yzerbyt and Spears2002: 2). The possibility, therefore, is that among the English teaching profession there exist normalised notional templates of pupil attainment, which are premised on pupil characteristics, inform judgements of each child and skew assessments in line with these characteristics.
Building upon previous evidence to test the stereotype model
To date, little credence or focus appears to have been afforded in the policy arena to the possibility that bias and stereotyping might provide some explanation for systematic variation in children's achievement, particularly in primary school. Despite the growing body of evidence that this may be the case, policy has tended to look instead to the family-level for first causes of inequalities, often citing socio-economic differences as the primary driver, and directing resources accordingly (Department for Children, Schools and Families, 2008; Department for Education, 2010a; Department for Education 2010b; Department for Education and Skills, 2005). Yet if the process of stereotyping can definitively be implicated as instrumental in biases in teacher assessment (and consequentially as contributing to attainment disparities), this will clearly indicate a point at which intervention to mitigate these inequalities might be deployed.
However, existing research does not yet unequivocally support the theory that pupils are being stereotyped by their teachers. For example, though they show clear patterns of disparity, and though they propose and support a stereotype model, Burgess and Greaves (Reference Burgess and Greaves2009:12) also acknowledge an alternative explanation for their findings. Because their analysis uses comparators from within the same overall system (the teacher who assesses the pupil at KS2 also teaches them for the externally marked KS2 test), there is a danger of causal explanatory relationships within the system. Burgess and Greaves suggest, for instance, that the notable difference between the teacher-assessed and externally marked elements of SEN pupils’ results, in particular, may be due to: ‘an extreme form of “teaching to the test” for pupils with SEN . . . the teacher's more in-depth knowledge of the student's ability may result in a lower [teacher assessment]’. That is, teachers might explicitly train and focus on certain pupils, whom they see as less able, so that they learn to attain desirable KS2 levels in the test situation. As a result, these levels may not reflect the teacher's day-to-day perception of the pupil's ability – and this, rather than stereotyping, may be what underpins apparent biases.
Hansen and Jones’ (Reference Hansen and Jones2011) analysis partially circumvents this issue and avoids interrelatedness of measures by utilising tests of pupil ‘ability’ which are not explicitly associated with their schooling, and not directly influenced or reported by their teacher. Cognitive tests independently administered in children's homes as part of the MCS are compared to school-based, teacher-assessed FSP scores, arguably providing an enhanced indication that teacher judgements are biased away from manifest pupil performance.
However, while Hansen and Jones’ study strengthens the evidence that recorded teacher assessments are systematically skewed, a danger remains that FSP scores do not in fact comprise direct portrayals of the mental representation – the potentially stereotype-based ‘evaluative judgement’ – that each assessing teacher holds of their (groups of) pupils. Because schools themselves, at the institutional level, are judged by the attainment of their pupils, and because teachers’ own performance is assessed according to the attainment of their class, it is highly likely that FSP scores serve not only to describe the teacher-perceived attainment or progress of each individual child, but to inform additional purposes (Bradbury, Reference Bradbury2011a; Harlen, Reference Harlen2007).
A recent report by Ofqual (2012: 82) noted, for example, a tendency within teacher assessments to manipulate ‘marks so that candidates [are] placed within certain perceived grade boundaries’, and recent reporting of national scores for the teacher-assessed phonics screening test clearly illustrates this phenomenon (Department for Education, 2012c: 4).Footnote 1
One response to a 2009 Ofsted consultation stated that: ‘Schools can manipulate . . . scores in ways that Ofsted would be unlikely to support’,Footnote 2 while Bradbury (Reference Bradbury2011b: 655) describes findings from case studies where ‘assessment results may be influenced by pressure from external advisors, who only recognise certain patterns of results as intelligible’, and where this moderation brings about amendments to pupils’ test scores in line with established normative expectations. Recorded FSP results may, therefore, provide a somewhat inaccurate representation of teacher perceptions of a given individual or group, due to their complicity with, and the incentives of, a system where the attainment levels awarded to pupils have implications far beyond measuring and assessing each child's ability, progress or performance.
The current study
Therefore, in order to investigate less ambiguously and more explicitly whether teacher-level stereotyping of pupils may relate to biased assessment according to pupil characteristics, the analysis presented in this paper uses a measure of teacher judgement which is not part of, nor required by, the education and assessment system, which is removed from its context, and which will not inform evaluations of performance of a teacher or their school. Confidential responses provided by teachers participating in the Millennium Cohort Study (MCS) to questions about their pupils’ ‘ability and attainment’ (at age seven) provide a proxy for the teachers’ mental representations of each pupil. These survey responses should lack the agenda inherent to the formal in-school assessments used in previous research. In addition, like Hansen and Jones’ paper, the current study uses independent MCS-administered cognitive test scores (also collected at age seven) as comparators that indicate each child's contemporaneous manifest performance.
Analysis explores whether there are biases in teacher judgements of pupils which correspond to each of the key pupil characteristics underpinning recorded primary-age attainment gaps (family income-level, gender, SEN, ethnicity, EAL) and which may, as proposed, account to some extent for these gaps. Additionally, it begins to explore which of these characteristics appear to dominate and drive any apparent biases, in order further to inform potential interventions which may tackle stereotyping.
Methodology
Sample
The Millennium Cohort Study (MCS) included 11,695 English children at its first sweep in 2001, and four additional waves have taken place to date: in 2004, 2006, 2008 and 2012. This paper uses data from wave four, when the pupils were seven years old, and in year two at primary school (Plewis, Reference Plewis2007; data source: Centre for Longitudinal Studies, 2011, 2012). Analysis is restricted to state school children in England, in order to allow comparison with, and interpretation in the context of, Department for Education (DfE) statistics on pupil attainment. Twins and triplets are excluded, because teacher bias and stereotyping may follow a different process for these pupils.
Responses to the survey of teachers at wave four, which provide the data used here, were received for only a sub-sample of pupils. Data on cognitive test scores are missing for a small minority, and there is also some non-response to individual questions. The base samples thus comprise those 4997/4985 (reading/maths) MCS children who continued to participate at wave four, whose teachers responded and for whom there are all necessary data. Any relationships found in the current analysis can therefore be attributed with absolute certainty only to the children included – but this large sample can be used to theory-build and to explore the hypothesis that stereotyping by teachers takes place.
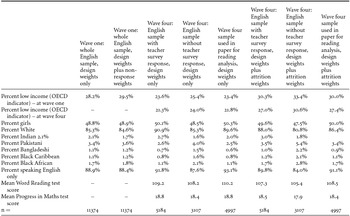
Estimates are weighted for the MCS's design features and for attrition to the level of the main wave four sample, as per Mostapha (Reference Mostapha2013) (attrition weights specifically for the teacher sample have not yet been developed). Appendix 1, Table 11, compares key characteristics of the English singleton MCS sample at wave one to three samples at wave four: that with teacher survey response, that with all data necessary for analysis in this paper and that without teacher response. It also contrasts estimates with and without attrition weights. It suggests some relatively minor differences between samples: that the sample used in this paper are from families slightly fewer of whom are low income than those without teacher response at wave four, who are more likely to speak only English at home; that the pupils are more often of White ethnicity, score marginally higher in the cognitive tests and are slightly more often girls. Where comparison across waves is possible, estimates weighted for design and attrition are similar for the wave one sample and for the sample used in this paper.
Teacher judgements
Teacher-reported judgements of whether each pupil is ‘well above average/above average/average/below average/well below average’ at both reading and maths, respectively, form the crux of analysis. These evaluations are in response to a survey question asking the teacher to ‘rate [the given] aspect of the study child's ability and attainment [reading/maths] . . . in relation to all children of this age’.Footnote 3
For modelling, responses are recoded into binary variables representing a rating of ‘above’ or ‘below’ average, which indicate whether each child is judged as relatively more or less able compared to their peers. Responses of well above average and above average are combined to form the ‘above average’ category, where all else is categorised ‘not above average’; similarly, responses of well below average and below average are combined to one ‘below average’ category. While it necessitates a coarser analysis of biases, this merging of responses allows use of an easily interpretable linear probability model, and ensures robust cell sizes in logistic modelling. Four outcome variables are thereby created:
• teacher judgement of reading ‘above average’/not;
• teacher judgement of reading ‘below average’/not;
• teacher judgement of maths ‘above average’/not;
• teacher judgement of maths ‘below average’/not.
Pupil characteristics
In addition, the following measures of each of the pupil characteristics identified by DfE statistics as underpinning attainment variation are used (all are taken at wave four):
• a derived variable from parent-reported data which indicates whether the family's income is above/below an OEDC 60 per cent of median UK income poverty indicator;
• parent-reported pupil gender;
• teacher report of any recognised SEN (yes/no);
• a derived variable from parent report denoting pupil ethnic group (White/Indian/Pakistani/Bangladeshi/Black Caribbean/Black African);
• a derived variable from parent-reported information on language(s) spoken in the pupil's household (coded to represent English only/additional languages).
Only sub-sets of breakdowns by ethnicity are reported in this paper, in order to aid meaningful interpretation and comparison with DfE statistics. The census-based eight-category ethnicity categorisation is used throughout the analysis, and includes ‘other’ and ‘mixed’ classifications – but results for these groups are not presented. Descriptive statistics according to ethnicity may therefore not sum to 100 per cent, while in modelling, noted sample sizes are for the whole sample with ethnicity data – as all are included in analysis – although only results for selected groups are outlined.
Teacher judgements and pupil characteristics
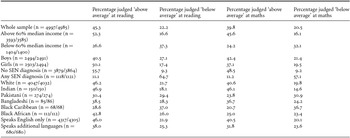
Table 1 shows the percentage of MCS pupils with each characteristic who are evaluated by their teacher as relatively more or less able than their peers, according to the definitions described above. It indicates a lower chance of being evaluated as ‘above average’ at reading for low-income pupils, boys, pupils with SEN, pupils of all ethnicities except White and Indian, and pupils speaking languages in addition to English. The same pattern holds for judgements of maths ability, save for a reversal according to gender, with boys more highly rated here.
Percentage of pupils with each characteristic judged at each level by their teacher*

Note: *All estimates weighted for survey design and for attrition to the main wave four survey; n is unweighted.
Cognitive test scores
At age seven, the MCS children completed a number of cognitive tests during a home visit from a survey administrator. They included the British Ability Scale Word Reading test, and a shortened version of the Progress in Mathematics test. The Word Reading test is designed to assess children's English reading skills.Footnote 4 The ability score (a scaled but not otherwise standardised score) is used in analysis (see Hansen, Reference Hansen2012). The Progress in Mathematics test is designed to measure pupils’ mathematical ability across use of numbers, shapes and proficiency in data handling. It is intended to provide an indication of performance in maths at the given developmental stage.Footnote 5 A shortened version was used in the survey and entailed routing to sections of varying difficulty levels. Rasch scaling was used to convert the raw scores to a count score equivalent to that which would be attained were the full test completed (see Hansen, Reference Hansen2012). This scaled score is used in analysis here.
Performance on the two cognitive tests provide respective points of comparison to the teacher assessments of pupil reading and maths ‘ability and attainment’. Completion of the cognitive tests shortly preceded teacher completion of their survey: the mean average time lag between cognitive test and teacher survey was 3.8 months, the median 3 months, and the mode 2 months. Comparisons using the two measures necessitate assumptions: (a) that the lag between pupil test completion and teacher survey completion does not vary systematically across the pupil characteristics of interest; and (b) that children delineated by each of the characteristics of interest develop at equivalent rates in their reading and maths ability and performance at age seven (so that any apparent bias in teacher assessments cannot be attributed to slower progress during the time lag from pupil survey to teacher survey in some groups). The second of these assumptions cannot explicitly be tested using the MCS data, so remains a supposition (although as the modal time lag was short, at two months, it seems reasonably unproblematic); that the first holds is checked through additional analysis, reported later.
Test scores and pupil characteristics
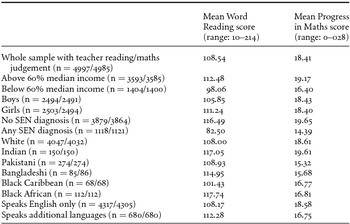
Table 2, above shows the mean Word Reading scores and Progress in Maths scores for the samples of pupils who took the tests and who also have responses to the teacher-completed question on reading/maths ability (respectively), according to each characteristic of interest.
Mean scores by characteristic on Word Reading and Progress in Maths tests*

Note: *All estimates weighted for survey design and for attrition to the main wave four survey; n is unweighted.
On average, sample girls’ scores on the Word Reading test are higher than boys’, pupils with SEN have lower scores than those with no recognised SEN, and mean scores for low-income and Black Caribbean pupils are also relatively low. Pupils speaking languages in addition to English have higher reading scores, on average, than pupils speaking only English; and Indian, Bangladeshi and Black African pupils also have comparatively high scores.
Though measured on different scales and not, therefore, directly comparable, these descriptive statistics begin to indicate incongruities between children's cognitive test scores and judgements by their teachers. Sample pupils speaking languages in addition to English appear more likely to score relatively well on the BAS Word Reading test – but are less likely than pupils speaking only English to be rated highly at reading by their teacher. Similarly, Black African and Bangladeshi pupils score relatively highly on the Word Reading test – but are again less likely to be judged ‘above average’ and more likely to be judged ‘below average’ by their teacher.
As with Word Reading scores, Table 2 indicates that sample pupils with SEN and low-income pupils are more likely to attain relatively low scores on the Progress in Mathematics test. In contrast to Word Reading, however, pupils speaking languages in addition to English score lower, on average, than pupils speaking English only, and pupils of all reported ethnicities except for White and Indian are relatively more likely to attain a lower score on this test. Mean scores for boys and girls are very similar, which again indicates some discrepancy between scores and teacher judgements of pupils’ maths ability, which showed a tendency to favour boys (Table 1).
Modelling: are some groups of pupils systematically over/under-rated by their teachers?
That there are apparent incongruities between average scores of pupils with varying characteristics for the Word Reading test and teacher judgements of reading ‘ability and attainment’ begins to support the possibility that there may be biases in teacher perceptions of pupils according to the pupils’ characteristics. In order explicitly to investigate this, regression modelling compares teacher judgements of pupils who differ according to a given characteristic but who score at the same level on the relevant cognitive test.
The methodology here relies on a general overall relationship, across the sample, between performance on each cognitive test and teacher assessment of pupil ‘ability and attainment’ in the relevant domain. This relationship is strong. Within the whole sample, a naïve regression of BAS Word Reading test score on whether a pupil's teacher perceives their reading as ‘above average’ indicates that each additional point scored on the Word Reading test (range 10–214) is related to a likelihood of being judged ‘above average’ increased by 1.1 percentage point (p <0.001). For teacher judgements of reading ‘below average’, the relationship is inverted and there is a decrease of –0.8 of a percentage point (p < 0 .001). The relationship between point increase in Progress in Maths score (range 0–28) and judgement of ‘above average’ in maths is 4.2 percentage points (p < 0.001). For judgements below average, it is –3.4 percentage points (p < 0.001).
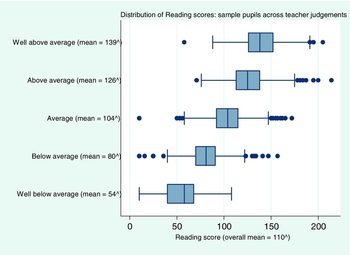
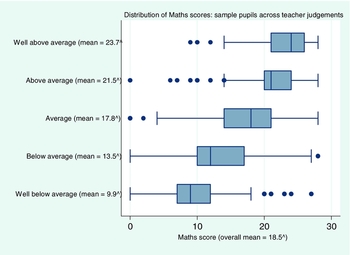
Figure 1 presents the means and distributions of BAS Word Reading test scores for pupils judged to be at each level of reading ‘ability and attainment’ by their teacher, and Figure 2 presents the equivalent information for maths scores and judgements. These figures again illustrate, across all sample pupils, overall linear associations between test scores and teacher judgements. Pupils with a higher cognitive test score tend to be judged to have a higher level of ‘ability and attainment’ by their teacher, though this is not a perfect relationship, and there are also overlaps.
Distribution of and mean BAS Word Reading scores of pupils with each teacher judgement of reading ‘ability and attainment’. Notes: *n = 4997 (unweighted). ^Means are unweighted; weighted estimates: overall mean = 109; well above average = 139; above average = 126; average = 104; below average = 79; well below average = 54. Line represents median, box represents 25th and 75th percentiles (Q1 and Q3, respectively), whiskers represent Q3+1.5(Q3‒Q1) / Q1‒1.5*(Q3‒Q1).

Distribution of and mean Progress in Maths scores of pupils with each teacher judgement of maths ‘ability and attainment’. Notes: *n = 4985 (unweighted). ^Means are unweighted; weighted estimates: overall mean = 18.4; well above average = 23.7; above average = 21.4; average = 17.7; below average = 13.6; well below average = 10.3. Line represents median, box represents 25th and 75th percentiles (Q1 and Q3, respectively), whiskers represent Q3+1.5(Q3‒Q1) / Q1‒1.5*(Q3‒Q1).

If there are no biases in teacher judgements according to the pupil characteristics of interest, these associations should not vary, nor the imperfection of the relationship be explained, by income-level, gender, SEN status, language or ethnicity. Girls and boys, for example, who score at the same level on the Word Reading test, should have equal probabilities of being judged ‘above average’ at reading by their teacher.
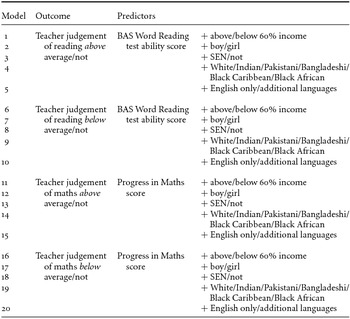
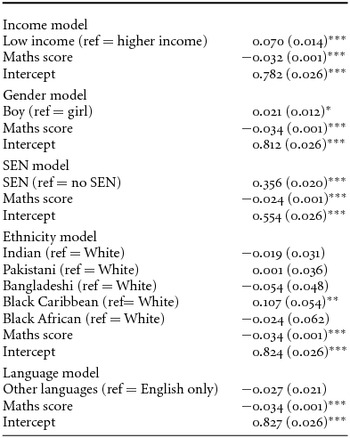
A linear probability model is used to test whether this is the case. The outcome (for example) is whether a child is judged ‘above average’ at reading, and the predictors are: pupil gender and ability score on the reading test. The likelihood of boys being judged ‘above average’ at reading by their teacher is thereby compared to the likelihood of girls who score at the same level. Analysis takes the following form:
 \begin{eqnarray*}
&&Probability\, of\, being\, judged\, above\, average\, at\, reading\, by\, teache{r_{0 - 1}}\\
&&\quad = Constant + \, \beta 1Bo{y_{0/1}}\, + \, \beta 2BAS\, word\, reading\, score + error
\end{eqnarray*}
The coefficient for boys represents the percentage point difference in likelihood, compared to girls who score equivalently on the Word Reading test, of being judged ‘above average’. A coefficient of 0 would therefore indicate that there is no bias according to gender in teacher assessments of reading ability. A positive coefficient indicates a positive bias for boys, and a negative coefficient a negative bias.
Analysis is repeated separately for each pupil characteristic and outcome, resulting in the following basic models (Table 3). All analyses use Stata (versions 12 and 13), and include “svy” commands for weighting, unless otherwise stated.
Variables used in and structure of linear probability models

Results
Biases in teacher judgements of pupils’ reading ability
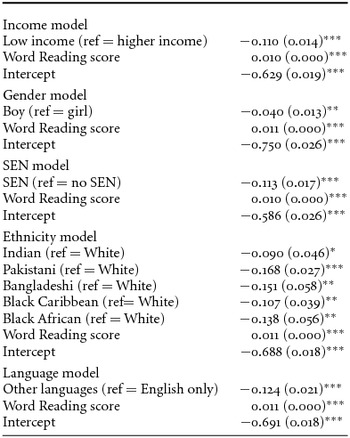
Table 4 indicates variation in the average likelihood of MCS pupils who differ according to each characteristic (income-level, gender, SEN status, ethnicity and language) being rated relatively highly at reading, compared to peers who score equivalently on the Word Reading test. As described in Table 3, separate models were estimated for each characteristic, and findings from each discrete model are presented.
Difference in percentage point likelihood of pupils with each respective characteristic being judged ‘above average’ at reading by their teacher, compared to pupils with the reference characteristic, and controlling for reading cognitive test score^

Notes: n for each model = 4997 (unweighted). *** = p <0.001; ** = p < 0.05; * = p < 0.10. Standard errors in brackets. ^All estimates weighted for survey design and for attrition to the main wave four survey.
Children from low-income families, boys, pupils with any recognised diagnosis of SEN, and children who speak other languages in addition to English appear less likely to be judged ‘above average’ at reading by their teacher – despite scoring equivalently to their comparison counterparts in the reading test. All these differences are significant at p <0.05 at a minimum. MCS pupils of all non-White ethnicities also appear less likely to be judged ‘above average’ at reading (compared to White pupils), and differences from the White reference group are, again, highly significant for most.
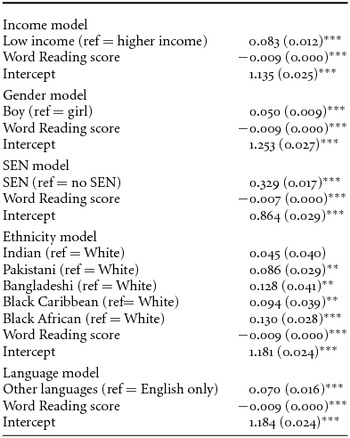
Separate models estimate the likelihood of each pupil group being judged ‘below average’ at reading, and these result are presented in Table 5. They are entirely in line with findings ‘above average’, inverting the direction of effect. As well as being 11 percentage points less likely to be rated ’above average’ by their teachers, for example, low-income pupils are 8.3 percentage points more likely to be judged ‘below average’, and, again, this is highly significant.
Difference in percentage point likelihood of pupils with each respective characteristic being judged ‘below average’ at reading by their teacher, compared to pupils with the reference characteristic, and controlling for reading cognitive test score^

Notes: n for each model = 4997 (unweighted). ***= p < 0.001; **= p < 0.05; *= p < 0.10. Standard errors in brackets. ^All estimates weighted for survey design and for attrition to the main wave four survey.
Biases in teacher judgements of pupils’ maths ability
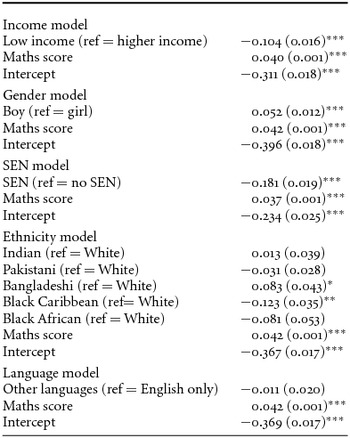
In line with the lesser incongruity within the descriptive statistics, slightly fewer disparities emerge for maths (Table 6). No significant difference in teacher perceptions is found between MCS pupils speaking only English/speaking an additional language, and pupils of most ethnicities are as likely as White pupils scoring at the same level on the Progress in Maths test to be evaluated as ‘above average’.
Difference in percentage point likelihood of pupils with each respective characteristic being judged ‘above average’ at maths by their teacher, compared to pupils with the reference characteristic, and controlling for Maths cognitive test score^

Notes: n for each model = 4985 (unweighted). *** = p < 0.001; ** = p < 0.05; * = p < 0.10. Standard errors in brackets. ^All estimates weighted for survey design and for attrition to the main wave four survey.
However, inverting the relationship indicated for judgements of reading ‘above average’, boys are more likely than girls to be judged relatively highly at maths. Sample Black Caribbean pupils are significantly less likely than their equivalently performing White counterparts to be judged ‘above average’ – along with children from low-income families, and those with any recognised SEN.
Again, separate models estimate the likelihood of each pupil group being judged ‘below average’ at maths (Table 7), and though more results again are non-significant here, those significant at p <0.05 are entirely in line with findings ‘above average’. Pupils with any diagnosis of SEN are more likely to be judged as ‘below average’ at maths compared to those without a diagnosis, low-income pupils are more likely than higher-income pupils, and Black Caribbean pupils more likely than White pupils.
Difference in percentage point likelihood of pupils with each respective characteristic being judged ‘below average’ at maths by their teacher, compared to pupils with the reference characteristic, and controlling for Maths cognitive test score^

Notes: n for each model = 4985 (unweighted). *** = p < 0.001; ** = p < 0.05; * = p < 0.10. Standard errors in brackets. ^All estimates weighted for survey design and for attrition to the main wave four survey.
Which characteristics underpin biases in judgements of reading and maths ability?
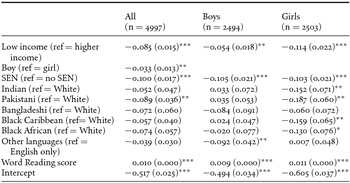
In order to begin to assess which characteristics might be important in driving these apparent biases and which stereotypes might be pertinent, analysis now incorporates each predictor variable simultaneously in a comprehensive model, and is repeated separately for teacher judgements of ‘above average’ reading and maths. The sample is then split between boys and girls to investigate any variation in patterns according to gender. Table 8 presents reading results for the whole sample, followed by findings for boys and girls, respectively.
Difference in percentage point likelihood of pupils with each respective characteristic being judged ‘above average’ at reading by their teacher, controlling for each other factor and reading cognitive test score^

Notes: *** = p < 0.001; ** = p < 0.05; * = p < 0.10. Standard errors in brackets. ^All estimates weighted for survey design and for attrition to the main wave four survey; n is unweighted.
Though there is a general lessening in the magnitude of biases for each characteristic, all remain significantly related at the 5 per cent level to teacher judgements of sample children's reading, even when covariates are accounted for – though disparities by ethnic group appear to be moderated by the other factors, and language spoken is significant only for boys. Biases according to income-level and ethnicity appear generally to be stronger for girls, while, overall, boys remain assessed at a relatively lower level.
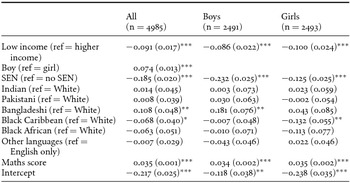
Table 9 presents results for teacher judgements of maths ‘above average’. It suggests that gender may be key to teacher judgements of the maths ability and attainment of sample pupils (given the larger significant coefficient here than when gender is considered alone, without covariates [Table 6]). SEN status and income-level also remain significant predictors here, but biases for Black Caribbean boys and Black African pupils seem to be moderated by the covariates, and are non-significant. Accounting for confounders also renders the relationship between spoken language and teacher ratings non-significant and, in contrast to analysis for reading, there is some suggestion that biases in judgements for maths according to SEN status may be stronger for boys – though, overall, boys are more likely to be judged ‘above average’ at maths.
Difference in percentage point likelihood of pupils with each respective characteristic being judged ‘above average’ at maths by their teacher, controlling for each other factor and Maths cognitive test score^

Notes: *** = p < 0.001; ** = p < 0.05; * = p < 0.10. Standard errors in brackets. ^All estimates weighted for survey design and for attrition to the main wave four survey; n is unweighted.
Across these analyses for reading and for maths, there appears to be some degree of bias according to each of four factors: income-level, gender, SEN status and ethnicity – even accounting for every other factor, and for language spoken. Some differences in magnitude and significance are revealed according to gender among the MCS children, and relationships vary by academic domain. It seems, therefore, that stereotyping according to each of these four characteristics might underpin biases in teacher judgements of pupils, but that it may follow different trends according to subject area and gender.
Robustness checks
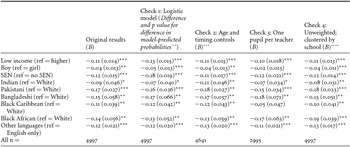
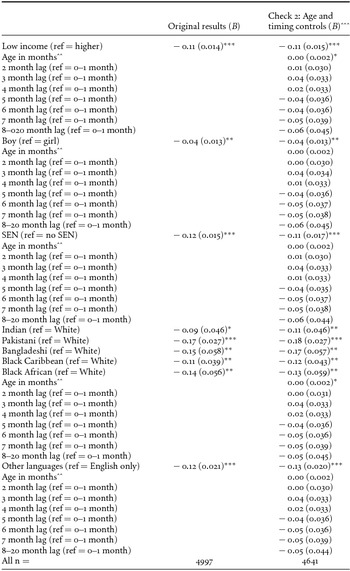
Four discreet robustness checks have been carried out to ensure that choices in modelling, weighting and sample selection have not influenced overall findings. Firstly, analyses are repeated using binary logistic rather than linear probability models. Results are equivalent (1). Secondly, analyses are repeated incorporating controls for age at cognitive test and time lag between test and teacher survey. This reduces sample sizes due to missing data on the timing variables, but makes little difference to the direction, significance or magnitude of findings (2).
As the pupils in the teacher sample are unevenly distributed across schools, and because some schools have several pupils and others only a single child, an additional check is carried out to examine whether extreme groups of teachers in more populous schools may be driving results. The pool for analysis is restricted to one pupil per teacher, and few differences are made to overall findings (3). Lastly, analysis is carried out without the wave four main sample weights, but with clustering at the school level, Again, the overall findings hold (4).
As an example, Table 10 shows key coefficients across these different analyses (1‒4) for teacher judgements of reading ‘above average’, according to the first model (Table 4). Further checks and model specifications may be found in Campbell (Reference Campbell2013).
Difference in likelihood of pupils with each respective characteristic being judged ‘above average’ at reading by their teacher, compared to pupils with the reference characteristic, controlling for reading cognitive test score: robustness checks^

Notes: *** = p <0 .001; ** = p < 0.05; * = p < 0.10. Standard errors in brackets.
^All estimates bar Check 4 weighted for survey design and for attrition to the main wave four survey; n is unweighted.
^^Calculated using ‘margins, pwcomp (eff)’ in Stata 13.
^^^See Annex 2: Table 12 for coefficients of age and timing controls.
^^^^Robust SEs estimated using ‘vce (cluster)’ in Stata 13.
These include interactions of quintile versions of the cognitive test scores with each characteristic of interest, and reduced samples comprising pupils exclusively from MCS sample strata with relatively high numbers of minority ethnic and low-income families (findings hold for children in these areas).
Summary and discussion
Analysis set out to explore the possibility that biases in teacher judgements of pupils may result from stereotyping within the teaching profession and that these biases might contribute to variation in recorded attainment among primary school children. It finds that, in this MCS English sample of seven-year-olds, there are inequalities in teacher perceptions of pupils’ reading and maths ‘ability and attainment’ which correspond to the characteristics delineating these achievement gaps. On average, low-income pupils seem to be under-rated by their teachers, along with pupils with any SEN diagnosis, non-White pupils, pupils speaking languages in addition to English and boys (reading)/girls (maths). Because both independent measures of pupil test performance and indicators of teacher perceptions of pupils, which are not required by or implicit with formal in-school assessments are used in this paper, findings support the possibility that the socio-cognitive process of stereotyping may indeed be instrumental in systematic attainment differentials.
Results here are congruent with previous research indicating over- and under-assessment of pupils according to their characteristics. They provide enhanced support for the possibility that mechanisms beyond the level of the individual pupil and their family, and outside of the control of the child or their parents, appear to be at work determining assessment levels awarded. Unless these tendencies are addressed, they may continue to play some part in creating and perpetuating inequalities.
Analysis here also began tentatively to unpick the constitution of the stereotypes proposed to explain biases. It finds that income-level, gender, SEN status and ethnicity all appear to play a part in accounting for disparities in judgement of sample pupils, and that there is some variation by gender and by subject domain. This suggests that any intervention aimed at alleviating stereotyping and its effects on teacher perceptions and assessments may need to take account of the complex nature of the process and of its components, rather than simply targeting biases associated with one characteristic in isolation.
It should be noted that findings and conclusions in this paper do not serve as any condemnation of teachers – as a profession or as individuals – as enacting the process of stereotyping to any unusual (or to any deliberate) degree. As outlined in the introduction, stereotyping is conceived to be a universal, non-conscious, automatic cognitive function which enables speed and efficiency in thought and behaviour. According to theory, all individuals have a propensity to enact this function to some degree: there is no reason that teachers should be exempt, nor unusually prone. Bias in judgements of pupils is just one manifestation of the human tendency to stereotype.
Where might stereotypes of pupils originate?
Analyses here cannot indicate what may be creating and forming the stereotypes that seem to provide a template for biased teacher perceptions, and there are a number of possible explanations. Firstly, it is feasible that the expectations of different groups of children that are made pertinent to teachers through explicit characteristic-based regulation of pupil, teacher and school performance levels (Bradbury, Reference Bradbury2011b) might reify and reinforce differentiated notions of potential and ability which become embedded and self-fulfilling.
Secondly, the messages conveyed by the various policy initiatives which require schools and teachers to focus on selected pupil groups might perpetuate an assumption that these groups are fundamentally lacking. For example, the current concentration on low-income families through the pupil premium may inadvertently imply and contribute to a stereotype that poorer pupils across the board are deficient in ability and potential. Similarly, recent initiatives targeting certain ethnic groups (Maylor et al., Reference Maylor, Smart, Kuyok and Ross2009; Tikley et al., Reference Tikly, Haynes, Caballero, Hill and Gillborn2008) might build a sense that these groups are essentially less capable, and feed into differentiated expectations.
Thirdly, as suggested by Burgess and Greaves (Reference Burgess and Greaves2009), direct personal experience might inform the process of stereotyping. Teachers may form generalised templates through their everyday experiences and interactions with pupils, and if a proportion of children from a given group are observed to perform in a certain way, a teacher may form a stereotype and over-generalise to all children in this group.
Lastly, of course, teachers function not only within schools and the education system but also within wider society. Media and other discourses regarding the societal positioning and features of different social groups may create stereotypes of these groups, potentially seeping into and influencing teachers’ perceptions of the children in their classroom.
Unfortunately, the data used in this paper do not offer the possibility of testing the extent to which any or all of these potential mechanisms play a part in developing the stereotypes which appear to be held by teachers, and the interrelationships between teachers and the systems and structures within which they function cannot be established here. There may conceivably be a number of points and means of intervention through which stereotyping of pupils could be mitigated, and findings from this paper initially support one in particular: addressing and confronting the process at the teacher-level.
Tackling stereotyping
It has long been argued that self-awareness of perceptions and expectations, and self-reflectiveness, are crucial to effective teaching:
for teachers to optimise learning they need to have a greater awareness of the complexities of individual differences [and] the importance of perceptions and expectations of pupils on learning outcome. (Hallam and Ireson, Reference Hallam, Ireson and Mortimore1999)
Earp (Reference Earp2010) reviews the cognitive-psychological literature on stereotype activation and consequential behaviours and also argues (here, in relation to stereotyping according to ethnicity) for mindfulness:
A teacher who is unaware of the basis for her judgments may conclude that they stem from the realities of her student's performance, rather than (directly or indirectly) from the activation of stereotypes about that student's [ethnic] group.
Discussing the research on ways in which teachers may thwart the stereotyping process, Earp suggests that, ‘Teachers are just the sort of people who are in a position to automate egalitarian motives’, and describes how recent cross-disciplinary studies have indicated that it is feasible that teachers may, with time and effort, ‘train’ and tame the stereotyping mechanism. Potentially this might involve actively learning to draw on alternative stereotypes of pupils, to presume motivation and ability in each student, and/or consciously to be balanced and constructive in feedback to and interactions with all pupils. Earp concludes that, ‘it is essential that schools of education include in their curricula state-of-the-science resources on the unconscious nature of prejudice and the corresponding implications for [the] classroom’.
Though it provides the beginnings of suggestions for change, this existing literature is limited regarding the exact means by which teachers, managers and policy-makers may effectively intervene to alleviate the stereotyping process. The current paper suggests, however, that this is an area very much worthy of further investigation and trial. Increased credibility and importance should be given to the accumulating evidence that biased judgements and stereotyping might be impacting upon and shaping pupil experiences and attainment, and national resources and efforts should be concentrated upon addressing this possibility. Extending the current study further to explore, unpick and test the drivers of the patterns it has found should play a part in this. Analysis in this paper uses just a sample of children (albeit a relatively large one), so tendencies found particularly in the results regarding the characteristics appearing to underpin stereotypes should be explored further, in enhanced and alternative datasets. The data used in this paper are moreover extremely limited in the extent to which they can examine any role of differential school-level tendencies in creating or mitigating the biases suggested; this should also be an area for further research.
At the policy-level, consideration should be given and investigation instigated into the ways in which initiatives and communications might create or reinforce stereotypes and result in unintended consequences. If, as speculated, characteristics-based targeting and monitoring inadvertently perpetuate attainment differentials based upon these characteristics, this would be a point for intervention and reformulation. Similarly, if ostentatious implementation of targeted policies, such as the pupil premium, proves detrimental to the treatment of its recipients, this again suggests reconsideration and revision of methods. Finally, the recent encouragement of work-based initial teacher training (in contrast to the university-based model) may be considered in light of the findings in this paper. If a trainee learns predominantly from the practices and norms in their placement school, with less time devoted to critical pedagogical theory, might this serve only to reinforce active stereotypes and expectations, with less scope for new ideas and the challenging of normative templates?
Conclusion
This paper finds that historical efforts to ensure parity, equality and meritocracy in the education system have not yet resulted in a parity of perception, judgement and assessment. Resources might usefully be directed as suggested here: towards building the evidence base on stereotyping; towards developing relevant interventions and strategies within teacher training and professional development; and towards avoiding the reinforcement of stereotypes and the worsening of their effects during policy intervention and associated publicity. By recognising and challenging the existence and effects of stereotyping in these ways, it is possible that some of the long-standing and widespread inequalities among primary school children may come to be alleviated.
Acknowledgements
This study uses data from the Millennium Cohort Study. I am grateful to the Centre for Longitudinal Studies, Institute of Education for the use of these data, and to the UK Data Archive and Economic and Social Data Service for making them available. However, these organisations bear no responsibility for the analysis or interpretation in this paper. Thanks also to the Economic and Social Research Council for the PhD funding which enabled this analysis.
Many thanks to Lucinda Platt, Lorraine Dearden, Ellen Greaves, Meghan Rainsberry and two anonymous reviewers for useful comments, suggestions, and critique.
Appendix 1
Key descriptive statistics for respective Millennium Cohort Study English single-cohort baby household samples, for comparison*

Appendix 2
Difference in likelihood of pupils with each respective characteristic being judged ‘above average’ at reading by their teacher, compared to pupils with the reference characteristic, controlling for reading cognitive test score – Robustness check 2: Age and timing controls, with full coefficients^