
I. INTRODUCTION
Industrial hot deformation processes such as hot rolling and hot forging are usually applied in several passes. The previous investigations have shown that the mechanical and microstructural changes during the interpass times are as important as those occurring during deformation. The static softening processes, such as static recrystallization (SRX) and metadynamic recrystallization (MDRX), may be activated depending on the material characteristics and deformation variables. Reference Uranga, Fernández, López and Rodriguez-Ibabe1–Reference Cho and Yoo4 SRX is the softening mechanism in a material that is mostly work-hardened before starting the interpass period. When the pass strain is below, which is required to propel dynamic recrystallization (DRX) or the material is naturally reluctant to bear DRX (high stacking fault energy [SFE] materials), the work-hardened material is softened by SRX in the interpass period. On the other hand, MDRX is the softening mechanism when the material has undergone DRX in the previous deformation pass. Characterizing the dependence of static softening mechanisms on chemical composition and processing parameters has been a challenge to the researchers of the field.5 –8
Due to the important role of beta Ti alloys in the high-tech industries, their behavior during hot working has drawn a lot of attention in the past decades. Reference Matsumoto, Kitamura, Li, Koizumi and Chiba9–Reference Ouyang, Wang and Cui11 Though many works have reported the tendency of beta Ti alloys for extensive dynamic recovery (DRV) and partial DRX, Reference Abbasi, Momeni, Akhondzadeh and Ghazi Mirsaed12–Reference Chandra, Ionescu and Mantovani15 more investigations are still necessary to identify the mechanism of microstructural evolution during single or multi-hit hot working processes.
Despite the devoted efforts, the issues like the competition between DRV and DRX and the mechanism of DRX have been the sources of controversies. Reference Fan, Kou, Lai, Tang, Chang and Li16–Reference Momeni and Abbasi18 In a recent work conducted by the authors, it was reported that extensive DRV and continuous DRX (CDRX) happen consecutively during single-hit hot working of Ti–13V–11Cr–3Al. Reference Abbasi, Momeni, Lin and Jafarian19 Although the combination between DRV and CDRX has been reported by some other researchers, Reference Ebrahimi, Momeni, Abbasi and Monajatizadeh20,Reference Longfei, Wangyue and Zuqing21 the change in the microstructural mechanism to discontinuous DRX (DDRX) at certain deformation condition is not impossible. While the devoted efforts have focused on the single-hit hot deformation processes, the lack of information on the microstructural evolutions through multistep operations has still remained. Hence, in current investigation double-hit hot compression tests have been conducted on Ti–13V–11Cr–3Al beta alloy to study the mechanical and microstructural changes accompanied by the interpass period in industrial multistep hot working operations.
II. MATERIAL AND METHODS
A. Studied material
The studied material was Ti–13V–11Cr–3Al beta Ti alloy with the chemical composition according to Table I. The alloy was cast using a vacuum arc remelting furnace and subsequently homogenized at 1100 °C for 3 h. The cast ingot was hot rolled at 1100 °C and rate of 0.5 s−1 and then quenched in water. The microstructure before double-hit hot compression tests is shown in Fig. 1. The micrograph shows equiaxed β grains with the average grain size of 220 µm.
Chemical composition of the studied material.

Starting microstructure of the studied material.

B. Hot compression tests
Cylindrical compression samples with 8 mm diameter and 12 mm height were prepared according to the ASTM E209 standard. Single- and double-hit hot compression tests were carried out on an Instron 8502 testing machine (Instron, Norwood, Massachusetts) equipped with a computerized controlled furnace. Graphite was applied on top and bottom surfaces of the samples to reduce friction with the contacting anvils. Before testing (single or double-hit), the specimens were reheated to the test temperature and held for 10 min to obtain a uniform temperature. After the tests, the load-stroke data were converted to true stress–true strain curves using the standard equations.
1. Single-hit tests
Single-hit hot compression tests were performed at 1030 °C and strain rate of 0.1 s−1 up to strain of 0.35. After interrupting the tests, the deformed samples were quenched in water within 1–3 s to retain the microstructure developed during hot working. The microstructures of the samples were revealed by standard metallographic techniques.
To determine the influence of starting grain size on the flow behavior at the same deformation condition, a starting material with the average grain size of 96 μm was produced by cold rolling and annealing of the hot rolled plate. Similar single-hit hot compression tests at 1030 °C and strain rate of 0.1 s−1 were performed on the samples with starting grain sizes of 220 and 96 μm up to true strain of 0.7.
2. Double-hit tests
Double-hit hot compression tests were performed at 1030 °C and strain rate of 0.1 s−1. In the first set of samples, the first pass was interrupted at strain of 0.35 and the deformed samples were kept at the deformation temperature for 10, 50, 100, and 300 s and then quenched in water to the ambient temperature. The microstructures of the deformed and annealed samples were revealed and the influence of interpass time on the microstructures was studied. The second set of samples was subjected to two-pass hot compression tests with the same deformation condition. The acquired data were used to calculate the flow softening in the interpass time.
C. Microstructure characterization
The deformed specimens were sectioned parallel to the compression axis and prepared by the standard metallographic techniques (ASTM E3-11). After etching in Kroll's reagent (2 mL HF, 6 mL HNO3, 92 mL H2O), the hot compressed samples were examined by the optical and scanning electron microscope-electron back scatter diffraction (SEM-EBSD) microscopy techniques. The EBSD analysis was performed with a JEOL JSM-6500F scanning electron microscope (JEOL Ltd., Freising, Germany) equipped with Channel 5 software. The ‘‘beam controlled’’ mode was applied with a step size of 0.6 μm and WD was 15 mm.
III. RESULTS AND DISCUSSION
A. Flow curves and microstructural observations
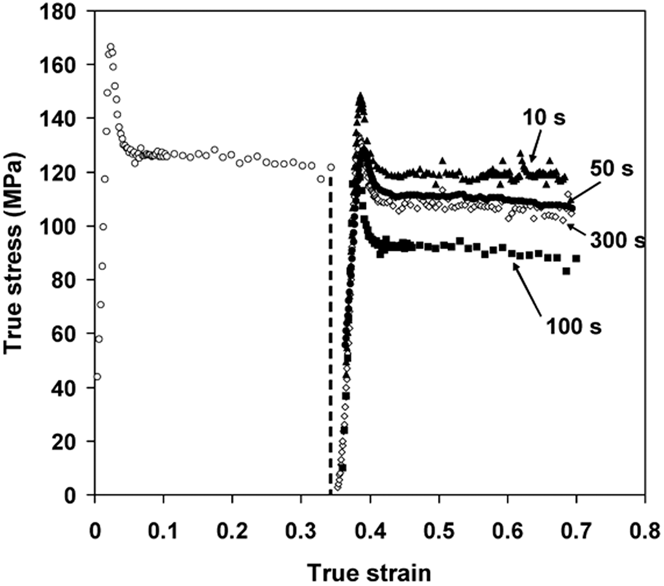
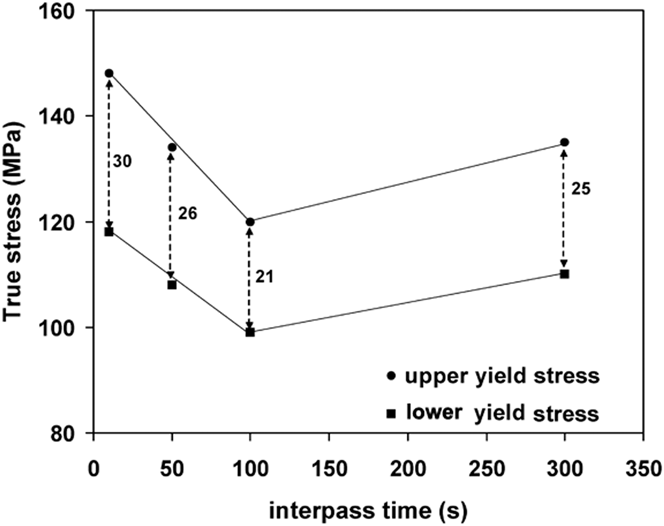
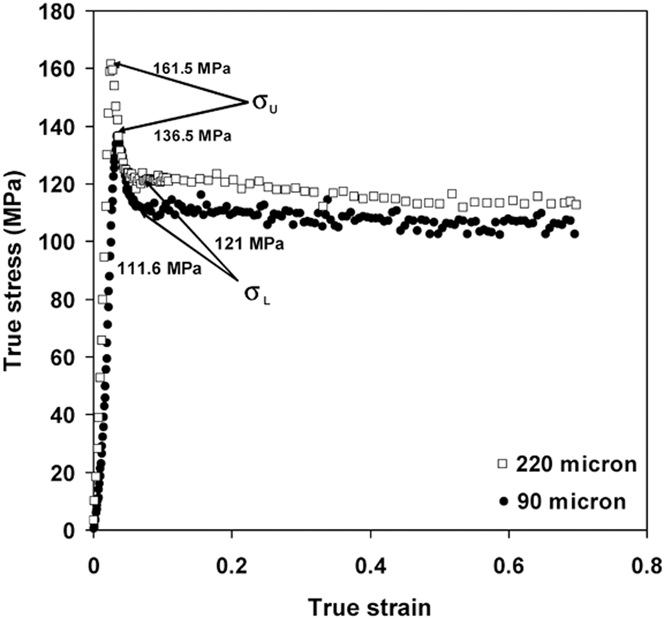
The flow curves of the studied material deformed at 1030 °C and strain rate of 0.1 s−1 are presented in Fig. 2. The flow curves show sharp yield points due to the so-called “yield point phenomena (YPP)” around the strain of 0.05 and a gradual flow softening at larger strains. The appearance of YPP in beta Ti alloys and the underlying mechanisms have been extensively investigated in the literature. The immobilization of dislocations by the solute atoms has been found responsible for the observation of YPP in such metals. Reference Abbasi, Momeni, Lin and Jafarian19–Reference Longfei, Wangyue and Zuqing21 It is worthy of note that in the double-hit hot compression tests YPP appears in both passes. This is inferred that the interpass time help the solute atoms to recombine with dislocations and immobilize them at the start of the second pass. The influence of interpass period and the corresponding microstructural evolutions on the extent of YPP is an important question that should be addressed. There is no report in the literature about the influence of double-hit hot deformation tests and interpass softening on the extent of YPP. The intensity of YPP can be quantified by the drop of flow stress at the yield point, termed as yield drop (YD). YD, which is calculated as the difference between the upper and lower yield points (σU − σL), strongly depends on the deformation temperature and strain rate. Reference Abbasi, Morakabati, Sheikhali and Momeni14 This is because the interaction between dislocations and solute atoms depends on the deformation variables. Figure 3 shows the variations of σU and σL with the interpass times, where YD has been written between the curves. Since constant temperature and strain rates have been applied in both passes, the variations of σU, σL, and YD can be attributed to the effect of interpass time. It is observed that the increase in the interpass time to 100 s decreases σU, σL, and YD. However, further increase in the interpass time to 300 s has inverse effects on σU, σL, and YD. In other words, the minimal YPP is obtained after the interpass time of 100 s. Previous researches have shown that YPP depends on grain size. Reference Kang, Jung, Kang, Woo and Lee22 It has been well known that the grain boundary ledges can emit dislocations when the material is subjected to large stresses. In fine grain structures, the grain boundary sources take part in the dislocation multiplication at the early stages of yielding and therefore the abrupt increase in stress to unravel the pre-existing dislocations from solute atoms is no longer required. Therefore, grain refinement weakens the effect of YPP and decreases YD. The influence of two-pass hot compression tests on the extent of YPP can be therefore discussed by considering the effect of interpass period on the grain size. According to the discussion, grain refinement has been the reason for the decrease in YD after the interpass period of 100 s and when grains begin to coarsen at longer times, i.e., 300 s and over, σU, σL, and YD tend to increase again. To verify the above assumptions regarding the influence of grain size on YPP and the dynamic softening region of flow curve two similar tests were performed on the samples with starting grain sizes of 220 and 96 μm. The results in Fig. 4 clearly show that as grain size decreases from 220 to 96 μm, YD degrades from about 40 to 25 MPa. Moreover, the decrease in grain size leads to a decrease in flow stress level in range of 10–15 MPa in the dynamic softening range. The results indicate that decreasing grain size not only degrades YPP but also favors the occurrence of dynamic softening processes.
Double-hit flow curves at 1030 °C and strain rate of 0.1 s−1 and various interpass times.

Variations of the upper and lower yield points (σU and σL) with the interpass time. The YD at each interpass time is shown between the curves.

Single-pass hot compression tests on the samples with different starting grain sizes of 220 and 96 μm.

Figures 2 and 4 illustrate that the flow stress tends to gradually descend as a result of progressive dynamic softening at large strains. The flow behavior is sharply different when the DDRX is the dominant mechanism. Materials which suffer DDRX often show a single or multi peak flow curve followed by fast dynamic softening. Recently, Abbasi et al. Reference Abbasi, Momeni, Lin and Jafarian19 showed that the sluggish dynamic softening in the material occurs with a continuous disintegration of old deformed grains by the well-developed subgrains. This process which is termed as the CDRX has been the topic of many previous works in the past decades. When DRV in a material easily progresses to form well-developed subgrains, the critical dislocation density for DDRX never meets. Hence, the subgrains in such materials gradually enlarge to reduce the sub-boundary areas. It has been observed that rotation and coalescence of adjacent subgrains and normal growth are the major mechanisms of subgrains enlargement. Reference Momeni, Abbasi and Shokuhfar23 Through the subgrains enlargement, the misorientation along the sub-boundaries increases. Reference Momeni, Abbasi and Shokuhfar23 Therefore, when the misorientation exceeds 15°, the subgrain turns into a CDRX new grain. This process justifies why CDRX proceeds with strain very gradually.
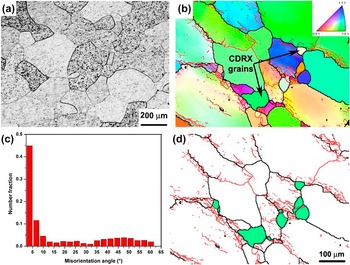
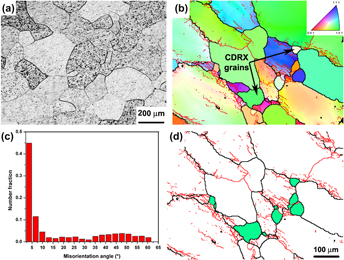
To characterize the microstructure at the onset of the interpass period, optical microscope (OM) and EBSD microscopy techniques were used and the results are presented in Fig. 5. Comparing Fig. 5(a) with the starting material (Fig. 1) indicates that grain growth has occurred during the reheating step and before starting the hot compression test. Figure 5(a) also shows that a bimodal grain structure of small and large grains has formed during the first pass of deformation. The EBSD measurements were used to find the reason for the bimodal structure. Figures 5(b) and 5(c) show the grain boundary maps of the sample deformed in the first pass to strain of 0.35. In Fig. 5(b), the high-angle grain boundaries (HAGBs) (θ > 10–15°) are black and the low-angle (LAGBs) ones (θ < 10–15°) are shown in red. It is observed that the bimodal structure has been resulted due to the formation of some small CDRX nuclei from the large deformed grains. The absence of interior substructure and different crystallographic orientations are the major characteristics of the CDRX nuclei which help to distinguish them from the parent grains. The misorientation angle distribution in Fig. 5(c) indicates that most of boundaries in the deformed sample are LAGBs. In other words, through the first pass DRX has partially progressed and the rest of microstructure is in the unrecrystallized state. The recrystallized regions of the microstructure have been highlighted by green color in Fig. 5(d). This result helps us to identify that what we should expect during the interpass period. In the green regions, we have nearly strain-free dynamically recrystallized grains which tend to grow by MDRX mechanism during the interpass time. However, in other parts of the microstructure where the material is unrecrystallized, there is enough stored energy in form of dense dislocation substructure which can propel SRX within the interpass period. It has been well known that SRX is the interpass softening mechanism when the material has remained unrecrystallized through the previous deformation. Otherwise, when a material is fully recrystallized by DRX, the interpass softening mechanism is MDRX. Reference Uranga, Fernández, López and Rodriguez-Ibabe1–Reference Cho and Yoo4 According to the results of Fig. 5, the microstructure at the onset of the interpass time is characterized by unrecrystallized + partially recrystallized by DRX condition and therefore SRX + partial MDRX should be the mechanism of microstructural evolution in the interpass time. The applied strain of 0.35 is tantamount to a 30% reduction in thickness which is commonly applied in one pass of hot rolling mills for the studied material and other similar alloys. Therefore, the results of current research can be helpful to predict the microstructural evolution through industrial hot working operations. SRX and MDRX have opposite effects on the microstructure which is subjected to the interpass time. This is because SRX tries to refine the deformed grains, while MDRX coarsens the DRX fine grains. Indeed, MDRX is the growth step of the grains nucleated by DRX. Therefore, the result of competition between SRX and MDRX depends on the extent of DRX during the first deformation pass. In other words, to have a uniform small grain structure, SRX is preferred and MDRX should be controlled in the interpass time. To achieve this goal, one should take care of the amount of DRX during the first pass. The material which is almost in the deformed state without a considerable DRX during hot working can be simply softened by SRX and a refined uniform grain structure is obtained. When a considerable amount of DRX occurs during the first pass, the interpass time should be minimized to hinder the progress of MDRX.
Microstructural features of the samples deformed to strain of 0.35 (the interrupted strain of the first pass): (a) optical microscopy image of the deformed sample, (b) the inverse pole figure image with the grain boundaries, (c) misorientation angel distribution chart, and (d) boundary map highlighting the new CDRX grains (green colored) within the old deformed ones. In (b) and (d) the LAGBs and HAGBs are colored red and black, respectively.

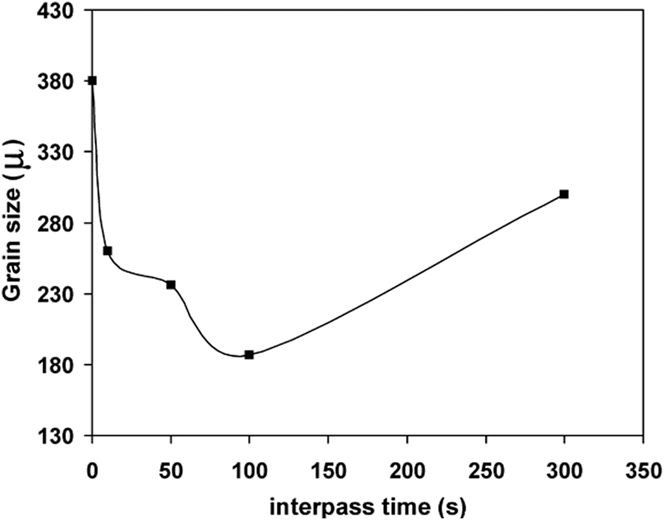
The micrographs of the samples deformed in the first pass and then subjected to different interpass times are presented in Fig. 6. It is evident that after 10 s of interpass time, the microstructure in Fig. 6(a) contains large deformed grains, medium-sized grains of MDRX and a few small grains produced by SRX. By increasing the interpass time to 50 and further to 100 s [Figs. 6(b) and 6(c)] the number of small grains increases at the expense of larger ones. Some larger grains which have equiaxed shape seem to be the MDRX grains which have grown to some extent. The large equiaxed grain structure in Fig. 6(c) indicates a remarkable growth after the completion of SRX at 300. The variation of grain size represented in Fig. 7 shows that the coarse grain structure with the average size of about 380 μm at the onset of the interpass period decreases abruptly to about 190 μm after 100 s in the interpass period. The finest grain structure at the interpass time of 100 s is attributed to the completed SRX. However, by increasing the interpass time to 300 s, the grain size increases again to about 300 μm. The results of Fig. 7 are also consistent with the variations of YD in Fig. 3 and flow stress in Fig. 2. As aforementioned, in coarse grain structures fewer dislocation sources are available to take part in yielding. To provide enough dislocations to contribute to yielding stress increases abruptly up to the upper yield point. Then, when the material yields, the stress falls down to the lower yield point. Therefore, YD increases in coarse grain materials. According to the results of Figs. 3 and 7, the increase in the interpass time from 100 s to 300 s leads to a 55 and 20% increase in the grain size and YD, respectively. In addition, the flow stress level of the material at the second pass increases from about 90 MPa after the interpass of 100 s to about 110 MPa after 300 s.
Optical micrographs of the samples deformed at 1030 °C up to strain of 0.35 and then subjected to the various interpass times of (a) 10 s, (b) 50 s, (c) 100 s, and (d) 300 s.

Variation of grain size before starting the second pass as a function of the interpass time.

The kinetics of SRX and MDRX are often described by the Avrami equation, as follows Reference Momeni, Abbasi and Shokuhfar23–Reference Lin, Liu, Chen, Huang, Ma and Long25 :
 $$X = 1 - \exp \left( { - k{t^n}} \right)\quad ,$$
where X is the fractional softening, t is the interpass time, and k and n are the material constants which are commonly called Avrami constant and exponent, respectively. The value of X can be determined by considering the variation of flow stress at the interrupted point of first pass and that at the second pass resume point. On this basis, X can be written as follows:
 $$X = {{{\sigma _{{\rm{fs}}}} - {\sigma _{\rm{L}}}} \over {{\sigma _{{\rm{fs}}}}}}\quad ,$$
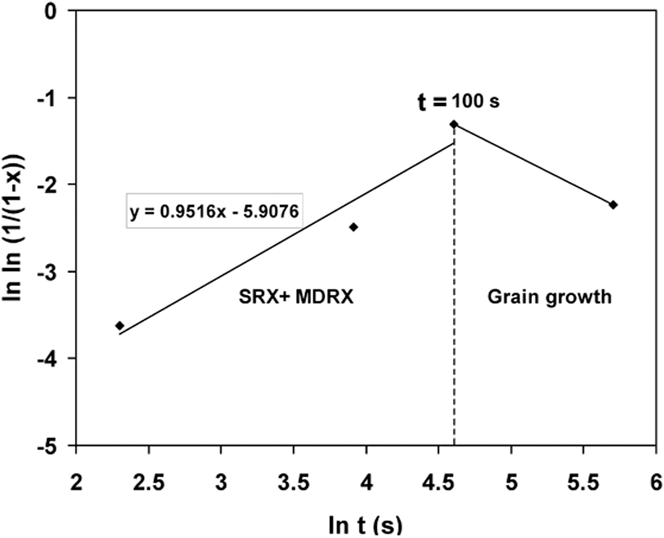
where σfs refers to the flow stress on the first pass curve at the interruption point and σL stands for the lower yield point of the second pass. To determine the values of k and n, the plot of ln{ln(1/(1 − X))} was drawn against ln t in Fig. 8. Based on Eq. (2), the linear regression of data could provide n as the slop and ln k as the intercept. Figure 8 shows that the curve is consisted of two regions, corresponding to SRX + MDRX at the interpass times below 100 s and grain growth at the interpass time over 100 s. The line fitted to the data points in SRX + MDRX region gives the values of n and k as 0.95 and 0.0027 [=exp(−5.9) on the curve], respectively. The inflection of the curve at the interpass times over 100 s reflects a sharp variation in the mechanism of microstructural evolution. As mentioned, SRX + MDRX are nearly completed within 100 s and grain growth occurs at longer interpass times. The apparent decrease in the value of X or ln{ln(1/(1 − X))}, as observed in Fig. 8, can be easily signified by considering the double-hit flow curves in Fig. 2. As discussed in Figs. 2–4, an increase in grain size degrades the kinetics of dynamic softening processes, giving rise to increasing the flow stress level. Hence, the decrease in the value of X for the samples with the interpass time of 300 s is associated with the increase in grain size and the value of σL.
Plot of the fractional softening due to the static softening (SRX + MDRX) as a function of interpass time in the frame of the Avrami kinetics model [Eq. (1)].

IV. CONCLUSIONS
Single- and double-hit hot compression tests were performed on Ti–13V–11Cr–3Al beta Ti alloy to investigate the mechanism of microstructural evolution and the effect of processing condition on the flow behavior before and after the interpass period. The major results of this research are listed as below:
-
(1) The flow stress level and the extent of YPP were increased by an increase in the grain size.
-
(2) After the first pass of deformation (strain of 0.35), the grain structure was bimodal of large deformed grains and small grains of CDRX.
-
(3) In double-hit compression tests, the YD decreased with increasing the interpass time to 100 s. Longer interpass times led to increasing the YD in the second pass of deformation.
-
(4) A combination between SRX and partial MDRX was responsible for grain refinement of the samples subjected to the interpass times up to 100 s. At longer interpass times, i.e., 300 s, grain growth led to a coarser grain structure.