Background
Atypical social cognitive processing is a hallmark of the autism spectrum condition (ASC). Processing emotion through components of facial expression is a fundamental mechanism during social interaction. The ‘Reading the Mind in the Eyes’ task (the Eyes task) tests the attribution of mental states from the eye region of the face alone. It involves both complex emotion recognition and the first stage of theory of mind, namely mental state attribution. Impairments on the Eyes task have been identified in adults with ASC compared to typical adults (Baron-Cohen et al. Reference Baron-Cohen, Jolliffe, Mortimore and Robertson1997, Reference Baron-Cohen, Wheelwright, Hill, Raste and Plumb2001a ; Lai et al. Reference Lai, Lombardo, Ruigrok, Chakrabarti, Wheelwright, Auyeung, Allison and Baron-Cohen2012). Kaland et al. (Reference Kaland, Callesen, Moller-Nielsen, Mortensen and Smith2008) found that children and adolescents with Asperger syndrome (AS) also perform worse on the Eyes task compared to typically developing controls. Performance was found to correlate with other theory of mind measures in individuals with AS. Difficulty in processing information from the eye region is characteristic of the atypical social cognition and social perception in ASC.
Endophenotypes are heritable components associated with increased risk for a condition. They are apparent in family members at a higher rate than the general population, independent of whether or not the family member has the condition (Gottesman & Gould, Reference Gottesman and Gould2003). As endophenotypes are thought to be controlled by the effects of fewer genes than the clinical phenotype, investigating endophenotypes could aid the identification of more homogeneous subgroups within the broad symptom criteria of autism (Viding & Blakemore, Reference Viding and Blakemore2007), thus aiding the identification of genetic associations. The detection of neuroendophenotypes contributes to the identification of neural markers, characteristic of individuals with ASC. As neural characteristics are thought to be closer to the action of genes than behavioural endophenotypes, similarities between individuals with ASC and their siblings at this level are therefore informative.
Endophenotype identification within the field of psychiatry has resulted in the identification of familial aspects associated with different conditions (Ersche et al. 2012; Pironti et al. Reference Pironti, Lai, Müller, Dodds, Suckling, Bullmore and Sahakian2013). In relation to ASC, these features are also referred to as the broader autism phenotype (BAP); subtle characteristics qualitatively similar to those seen in individuals with autism (Piven et al. Reference Piven, Palmer, Jacobi, Childress and Arndt1997; Wheelwright et al. Reference Wheelwright, Auyeung, Alison and Baron-Cohen2010; Sucksmith et al. Reference Sucksmith, Roth and Hoekstra2011). Studies have found that parents of children with ASC also experience difficulty inferring mental states from the eye region of the face (Baron-Cohen & Hammer, Reference Baron-Cohen and Hammer1997; Losh et al. Reference Losh, Adolphs, Poe, Couture, Penn, Baranek and Piven2009). Losh & Piven (Reference Losh and Piven2007) found that a subset of parents, judged to be aloof, had impaired performance on the Eyes task. However, the subgroup of parents not judged to have BAP characteristics did not have impaired performance on this task, suggesting that impairments are not universal in all relatives of individuals with autism but are specific to those with BAP characteristics. Subtle impairments on theory of mind tasks have also been identified in siblings of individuals with ASC (Dorris et al. Reference Dorris, Espie, Knott and Salt2004; Goken et al. Reference Goken, Bora, Erermis, Kesikci and Aydin2009; Yoder et al. Reference Yoder, Stone, Walden and Malesa2009). These findings suggest that performance on the Eyes task may serve as a potential endophenotype for ASC.
When performing the Eyes task, both typical male and female adults activate a network of brain regions involved in social cognition, including the superior temporal gyrus and amygdala. By contrast, Baron-Cohen et al. (Reference Baron-Cohen, Ring, Wheelwright, Bullmore, Brammer, Simmons and Williams1999) identified a differential pattern of activation in adults with ASC, comprising reduced activation in the amygdala, insula and inferior frontal gyrus, and increased superior temporal gyrus activation relative to controls. These suggest that the neural response to emotion and mental state recognition through the eye region may be different in people with and without ASC. Adams et al. (Reference Adams, Rule, Franklin, Wang, Stevenson, Yoshihawa, Nomura, Sato, Kveraga and Ambady2010) provide a summary of previous functional magnetic resonance imaging (fMRI) studies using the Eyes task. While performing the Eyes task, parents of children with ASC show reduced activation in the mid-temporal gyrus and inferior temporal gyrus, compared to controls (Baron-Cohen et al. Reference Baron-Cohen, Ring, Chitnis, Wheelwright, Gregory, Williams, Brammer and Bullmore2006). Group differences were also identified by Greimel et al. (Reference Greimel, Schulte-Ruther, Kircher, Kamp-Becker, Remschmidt, Fink, Herpertz-Dahlmann and Konrad2010), who found reduced fusiform activation in both children with autism and their fathers while inferring mental states of faces, compared to controls. However, activation differences on the Eyes task in siblings of individuals with autism as a potential neuroendophenotype have not yet been investigated.
An additional issue is the possible differential effects based on biological sex. Performance on the Eyes task may differ according to sex (Baron-Cohen et al. Reference Baron-Cohen, Jolliffe, Mortimore and Robertson1997; Dorris et al. Reference Dorris, Espie, Knott and Salt2004; Losh et al. Reference Losh, Adolphs, Poe, Couture, Penn, Baranek and Piven2009). Previous studies have reported sex differences in typical individuals for neural activation associated with the Eyes task (Baron-Cohen et al. Reference Baron-Cohen, Ring, Chitnis, Wheelwright, Gregory, Williams, Brammer and Bullmore2006); specifically, activation differences have been identified in the dorsolateral prefrontal cortex and the medial temporal gyrus. More generally, previous studies of brain structure and function have shown that males and females with autism differ substantially compared with same-sex typical controls (Bloss et al. Reference Bloss and Courchesne2007; Beacher et al. Reference Beacher, Minati, Baron-Cohen, Lombardo, Lai, Gray, Harrison and Crichley2012a , Reference Beacher, Radulescu, Minati, Baron-Cohen, Lombardo, Lai, Walker, Howard, Gray, Harrison and Crichley b ; Lai et al. Reference Lai, Lombardo, Suckling, Ruigrok, Chakrabarti, Ecker, Deoni, Craig, Murphy, Bullmore and Baron-Cohen2013c ). Overall, these studies raise the issue that atypical social cognition and its underlying neural processing in ASC may also be partly sex dependent (Baron-Cohen et al. Reference Baron-Cohen, Knickmeyer and Belmonte2005, Reference Baron-Cohen, Lombardo, Auyeung, Ashwin, Chakrabarti and Knickmeyer2011; Lai et al. Reference Lai, Lombardo, Chakrabarti and Baron-Cohen2013b ). This issue, however, has not been well studied to date. To establish whether Eyes task performance and/or associated neural activation may serve as an endophenotype for autism, potential sex-differential effects should be considered.
This study aimed to examine group differences (ASC versus controls and unaffected siblings versus controls) in performance and neural activity on the Eyes task, for male and female participants, to establish whether they are potential phenotypic or endophenotypic markers for autism at the cognitive and neural levels. Additionally, we examined possible sex-differential effects in neural activity associated with performing the task between males and females with autism, to build upon the limited literature about potential sex differences within ASC.
Method
Participants
A total of 130 adolescents (aged 12–18 years) participated in the study: 50 with high-functioning autism or AS (34 males, 16 females), 40 full siblings without a diagnosis of ASC (12 males, 28 females), and 40 typically developing controls with no family history of ASC (20 males, 20 females). Participants were recruited through local autism support groups, schools and community groups and the volunteer database of the Autism Research Centre, University of Cambridge (www.autismresearchcentre.com). No participant had a diagnosis of any other psychiatric condition or a history of psychotropic medication use. One participant from the male ASC group was excluded from the demographic data and further analysis as there was a lack of response to a significant proportion of the task items (performance accuracy was an extreme outlier, Z score –5.98).
A diagnosis of ASC (high-functioning autism or AS) was confirmed using the Autism Diagnostic Observational Schedule – Generic (ADOS-G; Lord et al. Reference Lord, Risi and Lambrecht2001) and the Autism Diagnostic Interview – Revised (ADI-R; Le Couteur et al. Reference Le Couteur, Lord and Rutter2003). All participants with ASC scored above the cut-offs for ‘autism spectrum’ on the ADOS-G and ‘autism’ on the ADI-R. All participants had a full-scale IQ above 70 assessed by the Wechsler Abbreviated Scale of Intelligence (WASI; Wechsler, Reference Wechsler1999). The control and sibling groups were screened for symptoms of ASC using the Social Communication Questionnaire (SCQ; Rutter et al. Reference Rutter, Bailey, Berument, Lord and Pickles2003), and all scored below the suggested cut-off (of 15). Imaging data from this study have been published elsewhere (Spencer et al. Reference Spencer, Holt, Chura, Suckling, Calder, Bullmore and Baron-Cohen2011, Reference Spencer, Chura, Holt, Suckling, Calder, Bullmore and Baron-Cohen2012a ,Reference Spencer, Holt, Chura, Calder, Suckling, Bullmore and Baron-Cohen b ; Floris et al. Reference Floris, Chura, Holt, Suckling, Bullmore, Baron-Cohen and Spencer2013), where potential neuroendophenotypes relating to the neural response to implicit face recognition and visual search were identified.
The Eyes task – adolescent version
Stimuli from the revised version of the Eyes task (Baron-Cohen et al. Reference Baron-Cohen, Wheelwright, Hill, Raste and Plumb2001a ) were adapted to ensure the task was suitable for 12–18-year-olds and for use in the MRI scanner where stimulus presentation time is limited. For this reason, two of the four original emotional state words were chosen for each stimulus, and where necessary were replaced with simplified response options from the child version of the Eyes task (Baron-Cohen et al. Reference Baron-Cohen, Wheelwright, Scahill, Lawson and Spong2001b ) to ensure that word difficulty did not confound performance on this task. This adapted version of the task was piloted outside of the scanner, with 10 typically developing 12–18-year-olds, to determine whether the word difficulty was suitable for this age group and to ensure that the presentation time was sufficient. Data from these pilot participants revealed that task performance was above chance but not yet reaching ceiling level.
Task administration in the scanner
A short practice task (using stimuli not included in the main task) and detailed instructions were given to all participants outside the scanner, before the scanning session. Individuals were also given the instructions in the scanner prior to the task. The task involved making judgments from photographs of the eye region of the face. There were 32 mental state stimuli and equal numbers of gender judgment stimuli. Each block (mental state or gender judgment) lasted 23 s, and stimuli were presented for 5 s with an interstimulus interval of 0.75 s and an interblock interval of 2 s. The task consisted of 16 blocks of stimuli with four stimuli in each; lasting for 7 min. Stimuli were presented in e-Prime version 2.0 professional (Psychological Software Tools, USA).
For the mental state blocks, participants were instructed to choose between two words that best described what the person might be thinking or feeling. For the gender judgment blocks, participants were asked to judge the gender of the stimuli. Participants indicated their response by pressing one of the two buttons on a button box held in their right hand. The order of the mental state blocks and that of the gender judgment blocks were counterbalanced across participants in each group. The order of this task and that of the two other fMRI tasks administered in the same study were also counterbalanced.
fMRI protocol and preprocessing
Participants were scanned using a Siemens 3-T TimTrio scanner (Siemens Healthcare, Germany) at the Medical Research Council Cognition and Brain Sciences Unit (MRC CBU) in Cambridge, UK. Echoplanar imaging (EPI) was collected with the following parameters: repetition time (TR) = 2000 ms, echo time (TE) = 30 ms, voxel size 3 × 3 × 3 mm, 32 slices acquired sequentially descending in the transverse plane with a slice thickness of 3 mm and an interslice gap of 0.75 mm. Preprocessing and first- and second-level analyses were carried out using the SPM8 package (Wellcome Trust Centre for Neuroimaging, UK). A structural image (magnetization prepared rapid gradient echo, MPRAGE) was also acquired for co-registration and normalization purposes, with the following parameters: voxel size 1 × 1 × 1 mm, TR = 2250 ms, TE = 2.98 ms, inversion time (TI) = 900 ms, flip angle = 9°, total scan time 4 min 32 s. The prepossessing steps included realignment of the functional image, sinc interpolation to correct for acquisition of different brain slices at different times and co-registration of EPI and structural scans. The images were normalized to the standard Montreal Neurological Institute (MNI) space through the structural scans (Evans et al. Reference Evans, Marrett, Neelin, Collins, Worsley, Dai, Milot, Meyer and Bub1992) and smoothed by a 4-mm Gaussian kernel. fMRI responses were modelled using a canonical haemodynamic response function.
Analysis of behavioural data
A parsimonious univariate ANCOVA model was first used to examine the between-group differences in performance on the Eyes task with group and sex as fixed factors and age as a nuisance covariate. Follow-up analyses with an ANCOVA design were carried out using a sex-stratified approach to investigate group differences. This strategy was taken to reflect the approach taken for the imaging data and to avoid the potential detrimental effects of unequal sex ratios when both males and females are analysed together. These were repeated including verbal IQ as an additional nuisance covariate because of recent evidence of a substantial correlation between verbal IQ and Eyes task performance in typically developing individuals (Peterson & Miller, Reference Peterson and Miller2012). According to the rationale outlined earlier, we also carried out these analyses stratified by sex. A polynomial trend analysis was applied to determine if there was a linear trend across the groups in the order of ASC<siblings<controls.
Imaging analysis
A first-level within-participant contrast was performed on the functional imaging data, subtracting activation in the gender judgment blocks from that in the mental state blocks, to identify mental state judgment specific activations. This contrast was used to control for other aspects of task performance (e.g. motor and visual processes).
Whole-brain voxel-level analysis on these contrast maps was then performed first using a parsimonious factorial design including group (ASC, sibling, controls) and sex (male, female) as the fixed factors and age as a nuisance covariate. As discussed earlier, previous studies have indicated possible sex-differential effects in ASC; however, this 3 × 2 factorial design is potentially underpowered to detect such an interaction. Because of the a priori consideration of sex-differential effects, a sex-stratified approach was also taken using general linear models with group as the fixed factor and age as a nuisance covariate. All analyses were constrained in a brain mask (with a threshold of partial volume estimate > 0.2 for either grey or white matter). Statistical outcomes were corrected for multiple comparisons at the cluster level by controlling topological false discovery rate (FDR) calculated under Gaussian random field theory (Chumbley & Friston, Reference Chumbley and Friston2009). We applied a cluster-forming voxel-level height threshold of p < 0.025 for each contrast and a spatial extent threshold that ensures a cluster-wise FDR at q < 0.05.
Endophenotype identification
Three strategies were applied to detect the presence of an endophenotype at the neural level. First, to localize brain structures with an activation pattern suggestive of being an endophenotype, differences in brain activation between siblings and controls are required in overlapping brain regions seen between the ASC and control groups. Second, we aimed to identify whether siblings' neural response was intermediate between the ASC and control groups or comparable to the ASC group in regions showing significant differences between the ASC and control groups. Separately for the male and female groups, signal changes from the clusters that differ significantly between the control and ASC groups were extracted and averaged for each individual using the CAMBA library (Brain Mapping Unit, Department of Psychiatry, University of Cambridge, UK). An ANOVA model was used to identify differences between sibling and control groups, followed by a polynomial trend analysis to identify if there was a linear trend across all three groups where the sibling group is intermediate between the ASC and control groups. The models were repeated including verbal IQ as a nuisance covariate to confirm that between-group differences were not explained by differences in verbal IQ. Third, to examine the presence of neuroendophenotype effect across different statistical thresholds, we calculated the extent of spatial overlap between activation-difference maps for control compared to ASC groups and control compared to sibling groups from voxel-level p < 0.05 down to p < 0.0001, to illustrate if the overlap pattern was consistent, and to test whether the overlap was significantly larger from random. The presence of non-random overlap between control–ASC difference and control–sibling difference maps across thresholds indicates a neuroendophenotype. We performed conjunction analyses with logical ‘AND’ masking (Nichols et al. Reference Nichols, Brett, Anderson, Wager and Poline2005) and computed the overlap as a proportion of the total number of suprathreshold voxels for each map. Conjunction analyses were performed separately for males and females, examining two pairs of group-difference maps for each (control>ASC AND control>sibling, ASC>control AND sibling>control). As previous studies have shown hypoactivation during the Eyes task in individuals with ASC (Baron-Cohen et al. Reference Baron-Cohen, Ring, Wheelwright, Bullmore, Brammer, Simmons and Williams1999), the former pair was considered more informative.
To test statistical significance, we ran Monte Carlo simulations (5000 iterations) to create the null distribution of random overlaps at each voxel-level threshold from p = 0.05 to 0.0001 (500 in total) to assess the probability that the overlap was not random (Lombardo et al. Reference Lombardo, Ashwin, Auyeung, Chakrabarti, Taylor, Hackett, Bullmore and Baron-Cohen2012; Lai et al. Reference Lai, Lombardo, Suckling, Ruigrok, Chakrabarti, Ecker, Deoni, Craig, Murphy, Bullmore and Baron-Cohen2013c ). For each Monte Carlo simulation we generated two whole-brain maps filled with values sampled randomly from a Gaussian distribution and having the same spatial smoothness as the observed group-difference maps. The simulated maps were then thresholded at the same voxel-level threshold as the observed maps, and the percentage of overlapping voxels in the two suprathreshold simulated maps was calculated. Over the 5000 iterations we constructed the null distribution of the overlap percentage that occurred by random. We computed p values by counting the number of instances where overlapping percentages were greater than or equal to the observed overlapping percentage in the real data. All computations were performed with MATLAB version 2012b (The MathWorks Inc., USA).
Ethical standards
All procedures contributing to this work complied with the ethical standards of the relevant national and institutional committees on human experimentation and with the Declaration of Helsinki of 1975, as revised in 2008.
Results
Behavioural data
2 × 3 factorial design
A univariate ANCOVA with mental state judgment accuracy as the dependent variable and age as a covariate revealed a significant effect of group (F 2,122 = 5.37, p = 0.006). There was no significant effect of sex and no significant group × sex interaction. Post-hoc tests showed significant differences between the ASC and control groups [ASC mean = 25.27, standard error (s.e.) = 0.602; control mean = 27.78, s.e. = 0.357; p = 0.002] and between the ASC and sibling groups (sibling mean = 27.0, s.e. = 0.471, p = 0.031) but not between the sibling and control groups.
Sex-stratified analysis: males
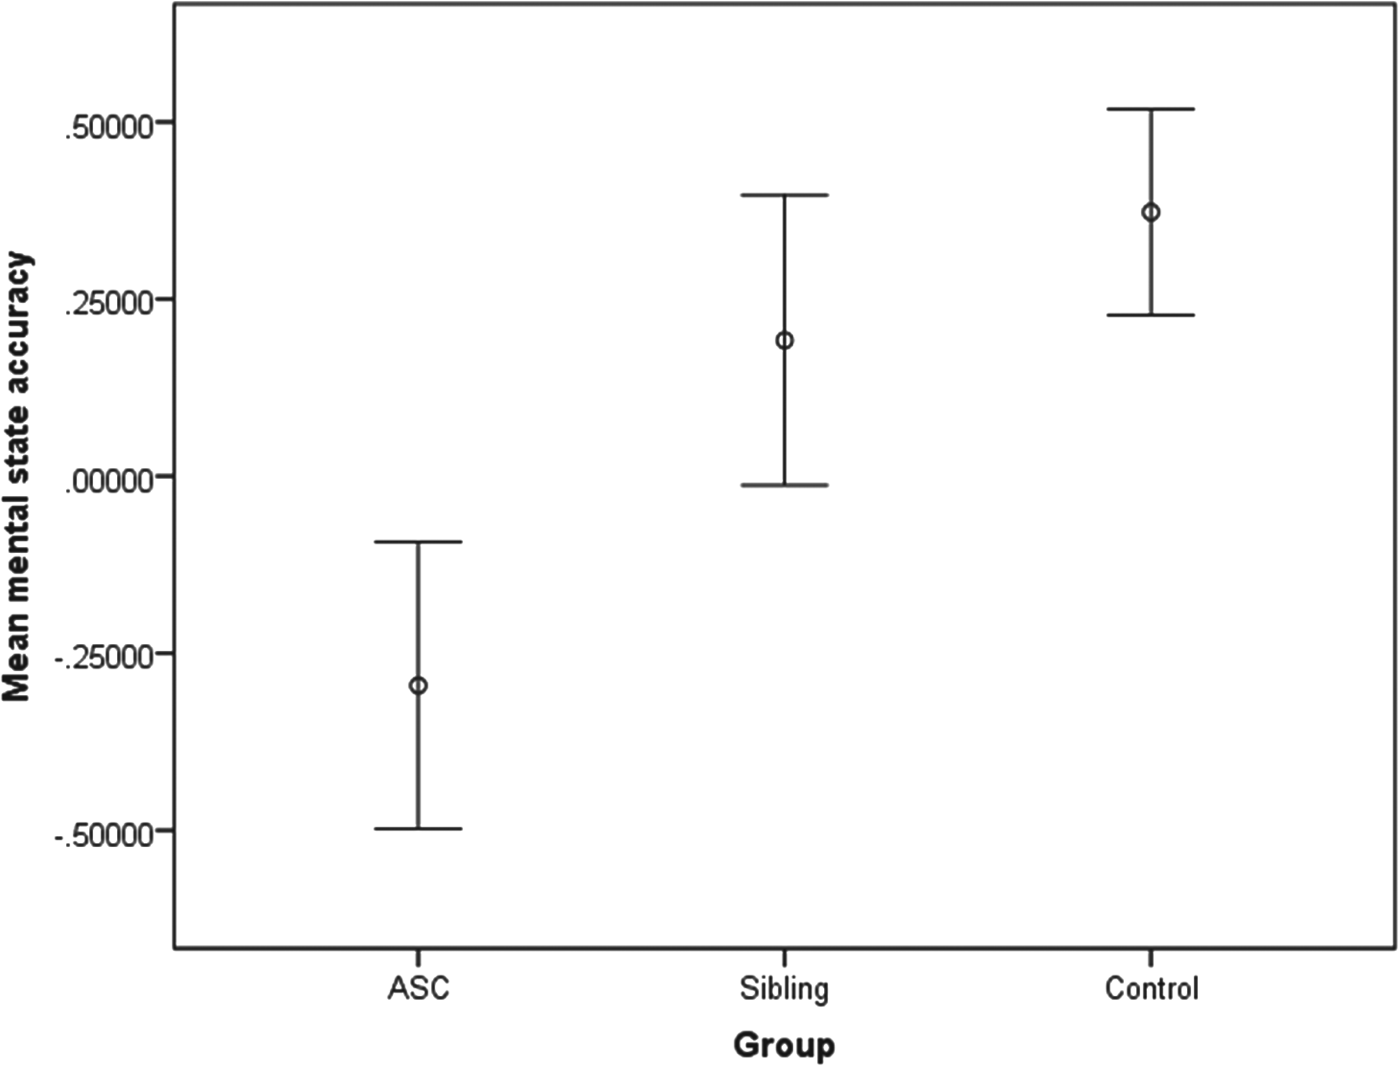
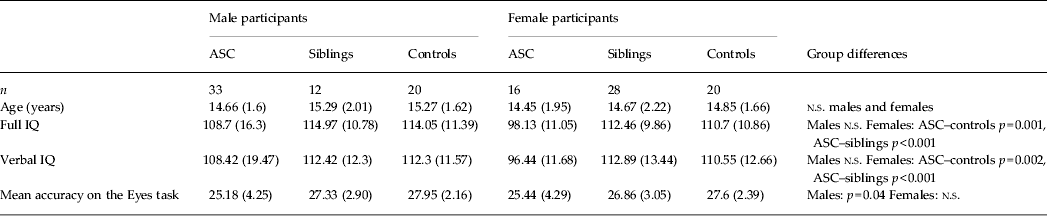
ANCOVA revealed a significant difference between the groups (F 2,61 = 3.39, p = 0.04) for accuracy of mental state judgments. Post-hoc analysis identified a significant difference (p = 0.016) between the ASC (mean = 25.18, s.e. = 0.74) and control groups (mean = 27.95, s.e. = 0.48). This contrast remains significant at the Bonferroni-corrected threshold (p = 0.025). There were no significant differences between the sibling and control groups. A polynomial regression indicated that there was a significant linear trend between the three groups (p = 0.016), with the sibling group being intermediate between the ASC and control groups. Table 1 presents means and standard errors for the sex-stratified sample and Fig. 1 shows the accuracy across groups. In a subsidiary analysis controlling for the effects of verbal IQ (F 2,60 = 2.93, p = 0.061), the difference between the ASC and control groups remained significant (p = 0.023). The polynomial trend across groups also remained significant (p = 0.023). There were no significant between-group differences for accuracy on the gender judgment section and no differences in reaction time for either sections of the task. Accuracy in the male ASC group was not normally distributed according to a Kolmogorov–Smirnov test (p = 0.007), and therefore between-groups analysis was repeated using a non-parametric test. A Kruskal–Wallis test revealed that the difference in performance between ASC and control groups remained significant (p = 0.016).
Mean accuracy for mental state judgments in male participants, with the effects of age regressed out. Error bars indicate ± 1 standard error of the mean.

Means and standard deviations for accuracy of mental state judgments for male and female participants on the Reading the Mind in the Eyes task

ASC, Autism spectrum condition; n.s., not significant.
Sex-stratified analysis: females
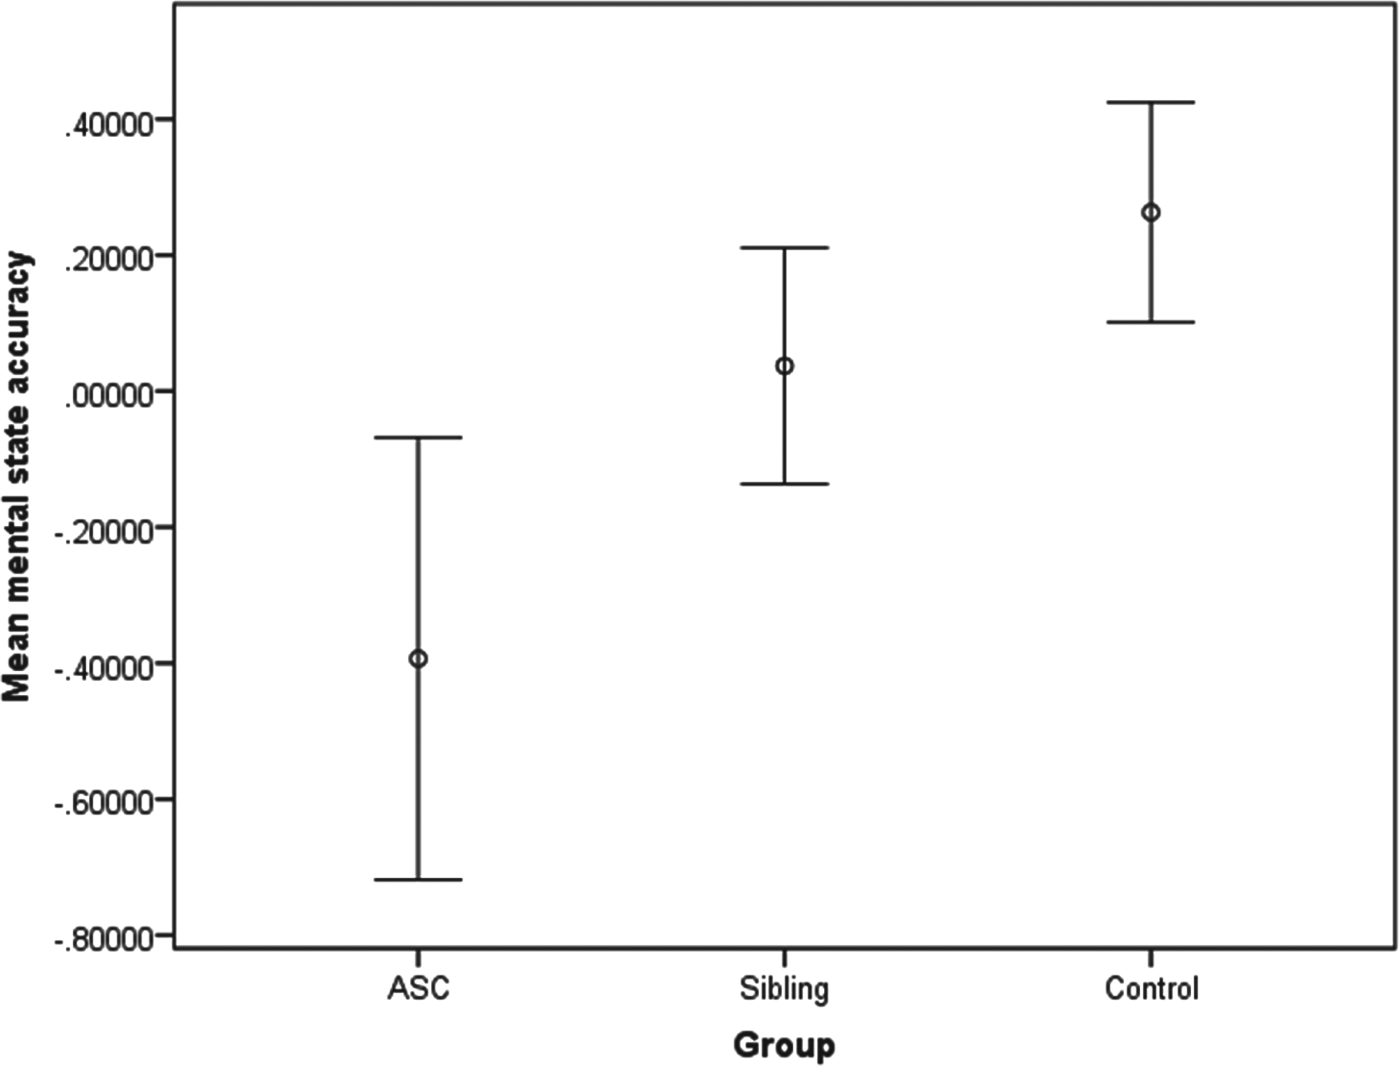
ANCOVA did not reveal a significant difference between the three groups (F 2,60 = 2.02, p = 0.141). Post-hoc analysis showed a trend-level difference (p = 0.051) for the accuracy of mental state judgments between the ASC (mean = 25.86, s.e. = 1.07) and control groups (mean = 27.6, s.e. = 0.54). This difference was non-significant following Bonferroni correction. There were no significant differences between the sibling and control groups (see Fig. 2). There was a linear trend in the groups (p = 0.051). Differences between ASC and control groups were non-significant when verbal IQ was included in the model (p = 0.297) (where effect of group F 2,59 = 0.718, p = 0.492). There were no significant between-group differences for accuracy of gender judgments or reaction times for either part of the task. Analysis of the difference between the ASC and control groups was repeated using a non-parametric test as the data were not normally distributed. The Kruskal–Wallis test showed no significant differences in accuracy between the ASC and control groups (p = 0.172).
Mean accuracy for mental state judgments in female participants, with the effects of age regressed out. Error bars indicate ± 1 standard error of the mean.

Imaging results
3 × 2 factorial design
There was a cluster showing a main effect of sex, where greater activation was found in males compared to females (FDR q < 0.001, z = 3.72, cluster size k e = 4561), located in the left anterior prefrontal cortex, right middle temporal gyrus and auditory cortex. There was no overall main effect of group, but there was significantly greater activation in the control compared to ASC groups (males and females combined) (FDR q = 0.003, z = 4.7, k e = 3071) at the inferior frontal gyrus, temporal pole and retrosubicular area. There was no significant difference between sibling and control groups. There was no cluster showing a group × sex interaction that survived multiple comparison correction.
Sex-stratified analysis: males
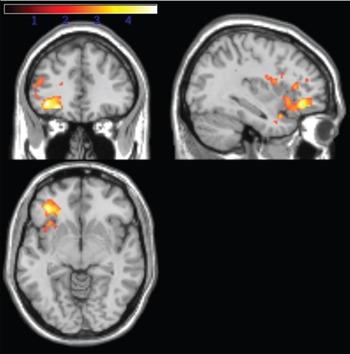
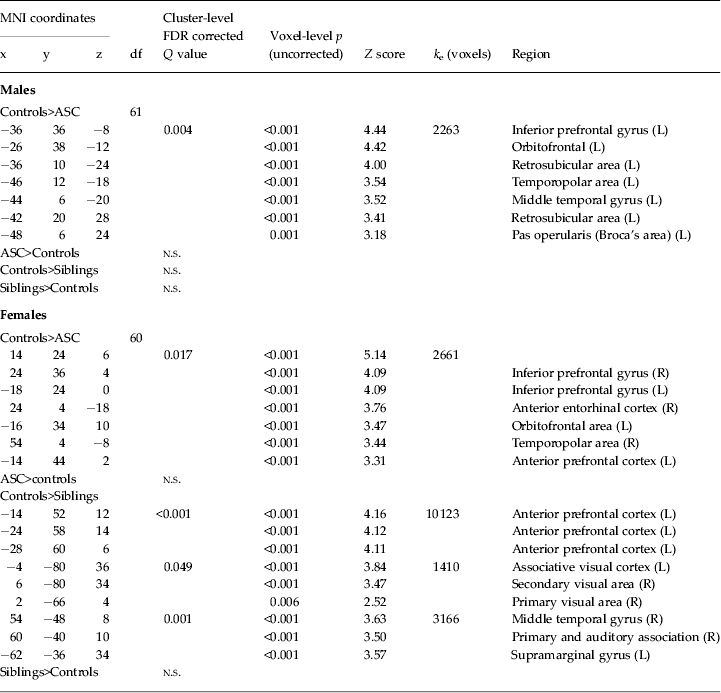
Significantly increased activation in the control compared to the ASC groups was identified in one large cluster that encompassed the left inferior prefrontal cortex, left orbitofrontal cortex and temporopolar area. There were no significant differences in activation between the control and sibling groups (see Table 2 and Fig. 3). In this case the first approach to identify neuroendophenotype was not applicable here.
Activation contrast for male participants: red/yellow (yellow indicating greater t values) shading indicates regions of significantly reduced activation in the autism spectrum condition (ASC) compared to control groups thresholded at a cluster-level false discovery rate (FDR) of q < 0.05 as described in the Method section.

Group differences in neural activation for gender-stratified analyses (activity in the mental state minus the gender condition)

MNI, Montreal Neurological Institute; ASC, autism spectrum condition; FDR, false discovery rate; n.s., not significant; df, degrees of freedom; L, left; R, right.
Second, signal changes were extracted for each individual from the clusters showing a group difference when comparing only the control and ASC groups as listed in Table 1. There were differences in these regions between the ASC and sibling groups (p = 0.023) but not between the control and sibling groups (p = 0.231). Between-group differences remained significant when co-varying for verbal IQ (between ASC and sibling groups at p = 0.029) but not between the sibling and control groups (at p = 0.231). In sum, the second approach failed to show evidence of the presence of a neuroendophenotype in the male groups.
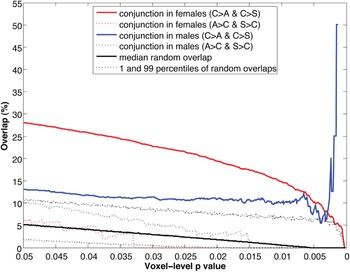
Finally, overlap analysis across voxel-level p values showed that there were consistent, modest but non-random overlaps between the control>ASC and control>sibling maps across all thresholds (Fig. 5, blue solid line, constantly locating above the 99th percentile of the null distribution). By contrast, the overlaps between the ASC>control and sibling>control maps (not related to established findings and not relevant in this study) were indistinguishable from random overlaps (Fig. 5, blue dotted line, constantly locating between the 1st and 99th percentiles). In sum, the third approach showed positive but modest indications of the presence of a neuroendophenotype in males.
Sex-stratified analysis: females
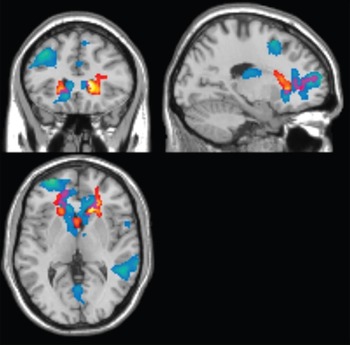
Control females had significantly greater activation compared to the ASC group in a cluster that involved the bilateral inferior prefrontal cortex, anterior prefrontal, orbitofrontal and temporopolar areas. Control females also showed significantly greater activation than siblings in the anterior prefrontal cortex, visual areas and middle temporal gyrus. An examination of the conjunction of group-difference maps showed that greater activation was evident when comparing controls with both ASC and sibling groups, at the left dorsal anterior cingulate cortex, anterior prefrontal cortex, inferior prefrontal gyrus, dorsolateral prefrontal cortex and retrosubicular area (Fig. 4). This first approach provided significant evidence for the presence of a neuroendophenotype in the female groups
Brain activation contrasts for female participants, thresholded at a cluster-level false discovery rate (FDR) of q < 0.05. Red/yellow shading (yellow indicating greater t values) indicates regions of significantly reduced activation in the autism spectrum condition (ASC) compared to the control groups. Blue regions (colder colours indicating greater t values) represent differences between control and sibling groups. Purple regions indicate the conjunction where both ASC and control groups and sibling and control groups display differential activation.

Second, activation in the overall cluster found to differ between ASC and control groups (Table 2) in the SPM analysis was also different between the siblings and control groups (p = 0.002) and between the ASC and sibling groups (p = 0.004). When controlling for verbal IQ, between-group differences remained significant between the sibling and control groups (p = 0.002) and between the ASC and sibling groups (p < 0.001). Polynomial regression showed a significant linear trend between the three groups (p < 0.001), where the sibling group was intermediate between the ASC and control groups. In brief, the second approach also showed strong evidence suggesting the presence of a neuroendophenotype in females.
Finally, overlap analysis showed that there were consistently substantial and non-random overlaps between the control>ASC and control>sibling maps across all thresholds (Fig. 5, red solid line, constantly locating above the 99th percentile of the null distribution). As in males, the overlaps between the ASC>control and sibling>control maps (not related to established findings and not relevant) were not distinguishable from random (Fig. 5, red dotted line). In sum, findings from the third approach confirm findings from the previous two approaches, demonstrating substantial evidence for the presence of a neuroendophenotype in females.
Spatial overlap of activation contrast maps between groups across multiple voxel-level thresholds. Black lines indicate the null distribution of random overlaps generated from 5000 iterations of Monte Carlo simulation: the black solid line shows the median overlap percentage, and black dotted lines show the 1st and 99th percentile of the distribution. The red solid line indicates the percentage of voxels that characterize both control>autism spectrum condition (ASC) and control>sibling differences for female participants. The blue solid line indicates the same for male participants. The red and blue dotted lines indicate the spatial overlap percentage in the opposite direction, that is ASC>control and sibling>control, in females and males respectively, which are not relevant in the present study.

Discussion
This study examined the behavioural performance and neural activation differences during complex emotion recognition and mental state attribution, using the Eyes task, in adolescents with ASC, unaffected siblings and matched typically developing adolescents, stratified by sex. The behavioural data indicated a significant impairment in accuracy on the Eyes task in male adolescents with ASC compared to controls. This replicates and extends previous studies on adults and children that showed reduced accuracy in ASC. Differences between females with ASC and control females were only at trend-level significance, possibly because of insufficient power in this subsample. No significant differences were observed between the control and sibling groups in either sex, suggesting that behavioural impairment on this mental state and emotion judgment task is a phenotypic, rather than an endophenotypic, marker of ASC.
At the level of neural function, we found significant differences in brain activation between the ASC and control groups during the Eyes task. In males, greater activation was identified in the control than the ASC groups, in the left inferior prefrontal gyrus, orbitofrontal cortex, temporopolar and middle temporal gyrus. Greater activation was also observed in the female control compared to ASC groups, similarly in the left orbitofrontal and temporopolar areas, and also the bilateral inferior and anterior prefrontal cortices. To identify neuroendophenotypes, in females the above-mentioned activation differences were also observed in comparable regions between sibling and control groups, which gave a significant sequential effect of control>sibling>ASC. The spatial overlap analysis also provided substantial evidence suggesting the presence of an endophenotype in the neural response to the Eyes task in females. For males, however, such evidence was far less striking, although there was still positive and modest evidence from the spatial overlap analysis. In sum, neural activation during the Eyes task could serve as an endophenotype of ASC in females, and possibly also in males.
Some of the regions showing a diagnostic group difference here have been reported in previous imaging studies using the Eyes task, where activation in the inferior frontal gyrus and inferior temporal gyrus (among two networks including frontotemporal and subcortical structures) were found to differ between adults with and without ASC (Baron-Cohen et al. Reference Baron-Cohen, Ring, Wheelwright, Bullmore, Brammer, Simmons and Williams1999). In another study (Baron-Cohen et al. Reference Baron-Cohen, Ring, Chitnis, Wheelwright, Gregory, Williams, Brammer and Bullmore2006), the middle temporal gyrus and inferior frontal gyrus showed greater activation in controls than in parents of children with ASC. These regions were found to differ between males with ASC and male controls in the current study. Our present findings similarly point to the key roles of these frontotemporal regions in the Eyes task serving as potential neuroendophenotypic markers for ASC.
These regions have been associated with social cognition and language processing. The orbitofrontal cortex is involved in social intelligence (Brothers, Reference Brothers1990; Baron-Cohen et al. Reference Baron-Cohen, Ring, Moriarty, Schmitz, Costa and Ell1994). The temporal poles have been implicated in accessing social scripts, where previous experience is drawn on to help interpret and guide behaviour (Frith & Frith, Reference Frith and Frith2003). The left inferior prefrontal cortex and Broca's area have been implicated in language comprehension in typically developing individuals (Huang et al. Reference Huang, Zhu, Zhang, Wu, Chen and Wang2012). Differential activation was identified in these regions in the current study, suggesting a group difference in both social and language processing elements while making judgments on complex emotions associated with mental states.
In a meta-analysis, Di Martino et al. (Reference Di Martino, Ross, Uddin, Sklar, Castellanos and Milham2009) reported differential neural activation in individuals with ASC compared to controls across a range of social cognition tasks and identified parallel regions of differential activation to that of the present study, namely the right and left inferior frontal gyrus and inferior temporal gyrus. A meta-analysis of mentalizing tasks also identified the inferior frontal gyrus as a region of differential activation in individuals with ASC compared to controls (Philip et al. Reference Philip, Dauvermann, Whalley, Baynham, Lawrie and Stanfield2012). These provide converging support that a differential neural response to the Eyes task is related to ASC.
On the one hand, the functional brain response provides evidence of a difference between ASC and control groups (in both males and females), suggesting that neural responses to the Eyes task might be a neurophenotypic marker for ASC. On the other hand, we found substantial evidence that the neural response might also be an endophenotypic marker for ASC in females, mainly involving the left anterior prefrontal cortex, inferior prefrontal gyrus, dorsal lateral prefrontal cortex, dorsal anterior cingulate cortex and right inferior prefrontal gyrus. This finding suggests that activation in these regions during mental state judgment may be a neural functional endophenotype of females with ASC. This endophenotypic pattern, however, was not observed to the same extent in the male groups. This sex-differential finding is noteworthy. Sex-differential effects of neurophenotypic characteristics of ASC have been demonstrated in both functional (Beacher et al. Reference Beacher, Radulescu, Minati, Baron-Cohen, Lombardo, Lai, Walker, Howard, Gray, Harrison and Crichley2012b ) and structural imaging (Bloss et al. Reference Bloss and Courchesne2007; Nordahl et al. Reference Nordahl, Lange, DD, Barnett, Lee, Buonocore, Simon, Rogers, Ozonoff and Amaral2011; Beacher et al. Reference Beacher, Minati, Baron-Cohen, Lombardo, Lai, Gray, Harrison and Crichley2012a ; Lai et al. Reference Lai, Lombardo, Suckling, Ruigrok, Chakrabarti, Ecker, Deoni, Craig, Murphy, Bullmore and Baron-Cohen2013c ), indicating that the moderating effect of sex should not be ignored. Here we further showed that, even for neuroendophenotypic markers, the sex-differential effect plays a role. Normative sex differences may contribute to the susceptibility and risk of developing ASC, in addition to how ASC is characterized at the phenotypic and endophenotypic levels (Baron-Cohen et al. Reference Baron-Cohen, Knickmeyer and Belmonte2005, Reference Baron-Cohen, Lombardo, Auyeung, Ashwin, Chakrabarti and Knickmeyer2011; Kirkovski et al. Reference Kirkovski, Enticott and Fitzgerald2013; Lai et al. Reference Lai, Lombardo and Baron-Cohen2013a ; Werling & Geschwind, Reference Werling and Geschwind2013a ,Reference Werling and Geschwind b ). A sex-stratified approach should be used in the future for both phenotypic and endophenotypic studies in ASC.
No behavioural impairment on the Eyes task was identified in siblings in the current study. This is inconsistent with some previous reports showing differences in performance on this task in family members of individuals with autism, possibly because they focused on a subset of parents with characteristics of the broader phenotype (Losh & Piven, Reference Losh and Piven2007; Losh et al. Reference Losh, Adolphs, Poe, Couture, Penn, Baranek and Piven2009). In our sample, as task performance was unimpaired in siblings, brain regions conforming to the pattern indicative of an endophenotype may be areas that are not integral to the Eyes task performance. Alternatively, neural level hypoactivation at these structures may have been ‘compensated’ by the recruitment of other neural systems so the behavioural task performance was intact (Kaiser et al. Reference Kaiser, Hudac, Shultz, Lee, Cheung, Berken, Deen, Pitskel, Sugrue, Voos, Saulnier, Ventola, Wolf, Klin, Vander Wyk and Pelphrey2010). Further analysis of alternate neural pathways and how these differ across the groups is required to confirm this hypothesis of neural compensation in unaffected siblings.
Limitations
The unequal sex ratios across the ASC and sibling groups (particularly the smaller sample size in females with ASC and male siblings) and consequently potentially insufficient power is a limitation of the current study. For example, a group × sex interaction was not identified in the parsimonious 3 × 2 ANCOVA models. Replication with additional numbers of male siblings is needed to strengthen the tests for a neuroendophenotype in the male groups on the Eyes task. The modest positive finding from the overlap analysis, however, supports this possibility.
Another limitation is that IQ in females with ASC was not matched with the other groups, so it is difficult to delineate to what extent the observed group differences are attributable to the effect of verbal IQ, versus the effect of group membership. However, females with ASC (particularly those with classic autism) recruited in previous studies generally have more cognitive impairments (Tsai et al. Reference Tsai, Stewart and August1981; Lord et al. Reference Lord, Schopler and Revicki1982; Tsai & Beisler, Reference Tsai and Beisler1983; Lord & Schopler, Reference Lord and Schopler1985). Our sample characteristics may similarly reflect a bias in recruitment of females with a formal clinical diagnosis of ASC due to current diagnostic practice. However, when controlling for verbal IQ in the current study, differences in neural response in females remained significant, suggesting that the effect of group is substantial even when the effects of verbal IQ have been removed. Further studies are required with IQ-stratified samples to clarify the effects of general cognitive ability on the neural response during social cognition tasks.
Conclusions
Consistent with the previous literature, both the behavioural performance and neural responses in the Eyes task are potential phenotypic markers of ASC. The neural response during the Eyes task may be an endophenotypic marker for ASC, particularly in females. These findings contribute to the understanding of the neural mechanism underlying social cognition in autism, indicating a possible genetic basis to the associated neural responses.
Acknowledgements
We thank the participants and their families for taking part in our study and the autism support organizations that assisted us with recruitment. We are grateful to M. V. Lombardo for assistance with statistical analysis, and to C. Ooi for technical assistance. Tragically, our colleague Andy Calder unexpectedly passed away at the time of writing. This paper is dedicated to his memory and is a tribute to his highly valued scientific contributions.
This study was funded by a Clinical Scientist Fellowship from the UK Medical Research Council (MRC) (G0701919) to M.D.S. During the period of this work, L.R.C. was funded by the Gates Cambridge Scholarship trust, M.-C.L. by the Waterloo Foundation and European Autism Interventions – A Multicentre Study for Developing New Medications (EU-AIMS), A.J.C. by the MRC, and S.B.-C. by the Wellcome Trust, the MRC, EU-AIMS, and the Autism Research Trust. This study was conducted in association with the National Institute for Health Research (NIHR) Collaboration for Leadership in Applied Health Research and Care (CLAHRC) for Cambridgeshire and Peterborough National Health Service (NHS) Foundation Trust.
Declaration of Interest
E.T.B. is employed half-time by the University of Cambridge and half-time by GlaxoSmithKline plc.