INTRODUCTION
Mayo’s Older Americans Normative Studies (MOANS) have served as an important resource for clinicians for nearly three decades, providing valuable normative data for older adults (Ivnik et al., Reference Ivnik, Malec, Smith, Tangalos, Petersen, Kokmen and Kurland1992a, Reference Ivnik, Malec, Smith, Tangalos, Petersen, Kokmen and Kurland1992b, Reference Ivnik, Malec, Smith, Tangalos, Petersen, Kokmen and Kurland1992c; Malec et al., Reference Malec, Ivnik, Smith, Tangalos, Petersen, Kokmen and Kurland1992), especially those older than 75 years, for whom normative data are historically limited (Smith & Ivnik, Reference Smith, Ivnik and Petersen2003). These norms are freely available, are provided in published normative textbooks (Strauss et al., Reference Strauss, Sherman, Spreen and Spreen2006), and have been widely applied in clinical and research contexts. However, normative data benefit from updates to help account for historical cohort differences (Hessel et al., Reference Hessel, Kinge, Skirbekk and Staudinger2018). Updates are also needed, because prior MOANS studies only included older adults, which limits broader application of this important normative resource.
Despite the rigor of the original MOANS study procedures at the time of data collection, which excluded persons with a dementia diagnosis, data collection began in the late 1980s, before the development and widespread use of mild cognitive impairment (MCI) as a construct (Petersen, Reference Petersen2004; Petersen et al., Reference Petersen, Smith, Waring, Ivnik, Tangalos and Kokmen1999, Reference Rey2009). Thus, a sizeable proportion of those included in the original MOANS cohort most likely had undetected MCI, particularly in older age groups, because the prevalence of MCI increases substantially with age (Petersen et al., Reference Petersen, Lopez, Armstrong, Getchius, Ganguli, Gloss and Rae-Grant2018). Updated norms that exclude persons with MCI are needed, because their inclusion will artificially lower the sensitivity of normative data when applied to patient groups. Word list memory tests consistently demonstrate high diagnostic accuracy for distinguishing persons who are cognitively unimpaired (CU) from those with clinically diagnosed MCI or Alzheimer’s dementia, often outperforming other memory measures; the sensitivity of memory measures, however, is lower for MCI than Alzheimer’s dementia (Weissberger et al., Reference Weissberger, Strong, Stefanidis, Summers, Bondi and Stricker2017).
Over the human life span, women perform better than men on tests of verbal memory (Aartsen et al., Reference Aartsen, Martin and Zimprich2004; Kramer et al., Reference Kramer, Delis, Kaplan, O’Donnell and Prifitera1997). This female advantage in verbal memory is maintained even when women have the same levels of neuropathologic burden (cortical amyloid β deposition or hippocampal atrophy) relative to men (Sundermann et al., Reference Sundermann, Biegon, Rubin, Lipton, Mowrey, Landau and Alzheimer’s Disease Neuroimaging2016, Reference Sundermann, Maki, Biegon, Lipton, Mielke, Machulda and Alzheimer’s Disease Neuroimaging2017). As a result of this advantage in verbal memory, women may have a delay in the diagnosis of amnestic MCI when tests that do not adjust for sex are used (Roberts et al., Reference Roberts, Geda, Knopman, Cha, Pankratz, Boeve and Petersen2012). Sundermann et al. (Reference Sundermann, Maki, Biegon, Lipton, Mielke, Machulda and Alzheimer’s Disease Neuroimaging2019) show that using standard, non-sex-adjusted norms underestimates MCI in 10% of women and overestimates it in 10% of men. They further show that sex-adjusted normative data improve the diagnostic accuracy of memory measures for distinguishing the presence or absence of MCI based on positivity rates of cerebrospinal fluid levels of phospho-tau/amyloid β and cortical amyloid β deposition (by florbetapir F 18 positron emission tomography) and APOE-ϵ4 frequency in misclassified persons. This implies that failure to use sex-adjusted normative data may contribute to missed diagnosis of MCI in women and an observed higher prevalence of MCI in men (Di Carlo et al., Reference Di Carlo, Lamassa, Baldereschi, Inzitari, Scafato, Farchi and Inzitari2007; Petersen et al., Reference Petersen, Roberts, Knopman, Geda, Cha, Pankratz and Rocca2010).
Thus, the availability of sex-adjusted normative data for clinical use is critical for minimizing sex-related health disparities by helping to prevent underdiagnosis in women and overdiagnosis in men. The original MOANS norms for the Auditory Verbal Learning Test (AVLT) did not adjust for sex or education because of a decision not to correct for demographic variables accounting for less than 10% of shared variance. Subsequent MOANS norms for recognition percentage correct, however, found that the observed degree of sex differences warranted separate recognition norms for men and women (Harris et al., Reference Harris, Ivnik and Smith2002).
The current study aimed to (1) demonstrate the need for updated AVLT normative data by examining base rates of low delayed recall performances between men and women when applying original MOANS norms; (2) illustrate the effect of adjusting for additional demographic variables other than age; and (3) provide updated normative data for the AVLT. These new norms are referred to as the Mayo Normative Studies (MNS) to differentiate them from the MOANS. These normative data will improve upon past MOANS norms by including adjustment for age, sex, and education, expanding the age range and sample size through use of a new population-based sample, and excluding persons with MCI. We hypothesized that application of original MOANS norms to an independent sample would result in lower-than-expected base rates of low performance, particularly in women, and that updated AVLT norms adjusting for sex would provide more balanced base rates of low scores across men and women relative to updated norms that adjust only for age.
METHOD
Participants
The current study follows in the tradition of the MOANS, but the study sample is independent of previously published MOANS norms (Ivnik et al., Reference Ivnik, Malec, Smith, Tangalos, Petersen, Kokmen and Kurland1992a, Reference Ivnik, Malec, Smith, Tangalos, Petersen, Kokmen and Kurland1992b, Reference Ivnik, Malec, Smith, Tangalos, Petersen, Kokmen and Kurland1992c). This study uses the extensive epidemiologic data collected through the Mayo Clinic Study of Aging (MCSA), which provides an excellent basis for the development of normative standards. The MCSA was initiated in 2004 as a population-based study of aging. Participants were randomly sampled from Olmsted County, Minnesota, using the Rochester Epidemiology Project Medical Records linkage system (St Sauver et al., Reference St Sauver, Grossardt, Yawn, Melton and Rocca2011); 97% of Olmsted County residents agree to the use of their medical records for research. More than 60% of contacted residents enroll in the MCSA. The details of the study design and sampling procedures have been previously published; enrollment follows an age- and sex-stratified random sampling design to ensure that men and women are equally represented in each 10-year age stratum (Roberts et al., Reference Roberts, Geda, Knopman, Cha, Pankratz, Boeve and Rocca2008). The MCSA initially enrolled residents aged 70–89 years. Enrollment was extended in 2012 to include ages 50–69 years and was again extended in 2015 to include ages 30–49 years, following the same sampling methods. The study protocols were approved by the Mayo Clinic and Olmsted Medical Center institutional review boards. All participants provided written informed consent.
Study visits included a neurologic evaluation, interview by a study coordinator, and neuropsychological testing conducted by a psychometrist (Roberts et al., Reference Roberts, Geda, Knopman, Cha, Pankratz, Boeve and Rocca2008). Neurologic evaluation was completed by a physician and included medical history review, complete neurologic examination, and administration of the Short Test of Mental Status (Kokmen et al., Reference Kokmen, Smith, Petersen, Tangalos and Ivnik1991). The study coordinator collected demographic information, medical history, and information about subjective memory and daily functioning from both the participant and informant by using the Clinical Dementia Rating (CDR®) instrument (Morris, Reference Morris1993). The neuropsychological battery included nine tests covering four domains, as previously described (Roberts et al., Reference Roberts, Geda, Knopman, Cha, Pankratz, Boeve and Rocca2008; Wennberg et al., Reference Wennberg, Hagen, Machulda, Hollman, Roberts, Knopman and Mielke2018). To decrease the possibility of circularity or incorporation bias, the neuropsychologist’s diagnostic impression was not considered for diagnosis for this study, which varies from the consensus diagnosis typically used in the MCSA. Instead, a determination of cognitively unimpaired by both the interviewing study coordinator and examining physician (who were blind to neuropsychological data) was required to be eligible for study inclusion (Petersen, Reference Petersen2004; Petersen et al., Reference Petersen, Roberts, Knopman, Geda, Cha, Pankratz and Rocca2010; Roberts et al., Reference Roberts, Geda, Knopman, Cha, Pankratz, Boeve and Rocca2008).
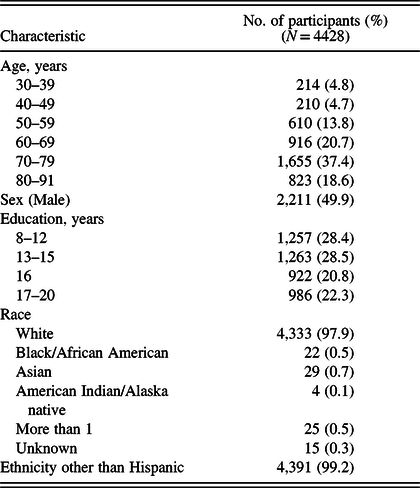
The current study included cognitively unimpaired persons aged 30 years or older who completed the AVLT at a baseline study visit and were test naïve (i.e., participants were excluded if they had previously participated in the Mayo Clinic Alzheimer’s Disease Research Center and were administered the AVLT). Additional exclusion criteria were having a terminal illness or being in hospice. Baseline AVLT data were available for 4428 cognitively unimpaired adults aged 30–91 years, a sample size eight times larger than that for previously published MOANS AVLT data (Ivnik et al., Reference Ivnik, Malec, Smith, Tangalos, Petersen, Kokmen and Kurland1992a, Reference Ivnik, Malec, Smith, Tangalos, Petersen, Kokmen and Kurland1992b, Reference Ivnik, Malec, Smith, Tangalos, Petersen, Kokmen and Kurland1992c; Malec et al., Reference Malec, Ivnik, Smith, Tangalos, Petersen, Kokmen and Kurland1992). Participants are predominantly White (see Table 1). The mean (SD) age of the overall sample was 68.3 (13.1) years, and the mean (SD) education level was 14.7 (2.6) years. Results by decade for demographics and all AVLT variables are provided in Supplemental Table 1 to further characterize the sample.
Demographic characteristics

Table used with permission of Mayo Foundation for Medical Education and Research.
Auditory Verbal Learning Test
The AVLT is a widely used word list memory test that is also known as the Rey Auditory Verbal Learning Test (RAVLT) (Rey, Reference Rey1964). Participants are read a list of 15 words (list A) and asked to recall as many as possible over five learning trials, after one intervening list, and again 30 min later. A written recognition test is then administered. The procedures for test administration are the same as those used in the original MOANS studies (Ivnik et al., Reference Ivnik, Malec, Smith, Tangalos, Petersen, Kokmen and Kurland1992a, Reference Ivnik, Malec, Smith, Tangalos, Petersen, Kokmen and Kurland1992b, Reference Ivnik, Malec, Smith, Tangalos, Petersen, Kokmen and Kurland1992c; Malec et al., Reference Malec, Ivnik, Smith, Tangalos, Petersen, Kokmen and Kurland1992). Ferman et al. (Reference Ferman, Lucas, Ivnik, Smith, Willis, Petersen and Graff-Radford2005) provide details about the specific form used, including the full word lists, recognition items, and verbatim instructions.
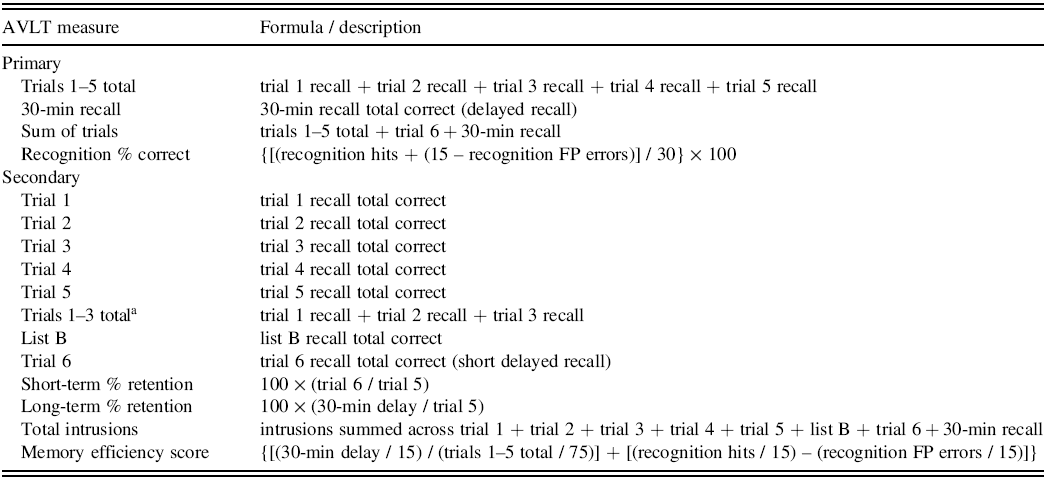
The four primary variables of interest for the current study were (1) the total recall score for trials 1–5; (2) 30-min delayed recall; (3) sum of trials (trials 1–5 total + trial 6 + 30-min recall); and (4) recognition percentage correct. Sum of trials is sensitive to early changes in memory (Jack et al., Reference Jack, Wiste, Weigand, Knopman, Vemuri, Mielke and Petersen2015). When recognition measures have an equal number of targets and distractors, simple methods correlate robustly with more complex methods such as d-prime (Delis et al., Reference Delis, Kramer, Kaplan and Ober2000). Thus, we used the same method as in prior MOANS studies to calculate recognition percentage correct (Ferman et al., Reference Ferman, Lucas, Ivnik, Smith, Willis, Petersen and Graff-Radford2005; Harris et al., Reference Harris, Ivnik and Smith2002). Secondary variables were collected to allow for further interpretation and to facilitate investigation of multiple aspects of memory performance; however, use of the primary variables is encouraged for clinical decision making. See Appendix (Table A1) for a full list of AVLT indices and relevant formulas. The full five trial version of the AVLT is recommended, but trials 1–3 total are included to support use of an abbreviated administration when needed. If an abbreviated version of the AVLT with only three learning trials is administered, normative data cannot be applied to any other AVLT measures beyond trial 3. One secondary measure, the memory efficiency score, can be calculated across different versions of the AVLT. It combines measures of encoding and retention and has demonstrated good sensitivity and specificity in distinguishing persons with Alzheimer’s dementia from those with behavioral variant frontotemporal dementia and cognitively unimpaired persons (Ricci et al., Reference Ricci, Graef, Blundo and Miller2012). Data for repetition errors were not available. Item-level data were not available; thus, serial position effects were not included.
Statistical Methods
To demonstrate the need for updated normative data that exclude participants with MCI and adjust for sex, we applied original age-adjusted MOANS norms (Ivnik et al., Reference Ivnik, Malec, Smith, Tangalos, Petersen, Kokmen and Kurland1992a, Reference Ivnik, Malec, Smith, Tangalos, Petersen, Kokmen and Kurland1992b, Reference Ivnik, Malec, Smith, Tangalos, Petersen, Kokmen and Kurland1992c; Malec et al., Reference Malec, Ivnik, Smith, Tangalos, Petersen, Kokmen and Kurland1992) for AVLT 30-min delayed recall to cognitively unimpaired participants aged 56 years or older. We used one-sample tests of proportions comparing observed rates of low test performance with rates expected on the basis of a normal distribution of performance for the full sample and when stratified by sex. These scaled scores are expected to approximate a normal distribution (mean [SD], 10 [3]) due to the forced normalization and smoothing process applied in MOANS (Ivnik et al., Reference Ivnik, Malec, Smith, Tangalos, Petersen, Kokmen and Kurland1992a, Reference Ivnik, Malec, Smith, Tangalos, Petersen, Kokmen and Kurland1992b, Reference Ivnik, Malec, Smith, Tangalos, Petersen, Kokmen and Kurland1992c; Malec et al., Reference Malec, Ivnik, Smith, Tangalos, Petersen, Kokmen and Kurland1992). On this basis, we can compute the expected percentage of participants performing below conventional cutoff values based on a normal distribution and compare them against the observed percentage in our sample. Analyses focused on rates of low test performance using a < −1 SD cutoff. Descriptors applied in clinical practice, including the recently published American Academy of Clinical Neuropsychology Consensus Statement (Guilmette et al., Reference Guilmette, Sweet, Hebben, Koltai, Mahone, Spiegler, Stucky and Westerveld2020), often include several descriptor categories to indicate degree of departure from average performance. Our focus on a < −1 SD cutoff captures all performances below that cutoff together, thus collapsing across several descriptor categories. For this reason, we describe all performances below −1 SD as “low.”
Normative Data Development
In contrast to cell-based methods used in prior MOANS studies, we used a regression-based normative approach. First, each test score distribution was normalized similarly to approaches described by other groups (Casaletto et al., Reference Casaletto, Umlauf, Beaumont, Gershon, Slotkin, Akshoomoff and Heaton2015; Heaton, Reference Heaton2004). Raw test scores were converted to normalized scaled scores by calculating their percentile rank based on the cumulative frequency distributions of raw scores and scaling them to a mean (SD) of 10 (3). Converting to scaled scores allows for easier comparison between measures by putting all measures on the same scale and led to improved distribution properties for a few non-normally distributed variables.
Demographic Corrections/Derivation of Fully Corrected T-Scores
Selecting Demographic Variables
The normalized test scores were regressed on age, age squared, sex, and education. Given the broad age range of the sample, we decided a priori to include a nonlinear age term, on the basis of past research (Salthouse, Reference Salthouse2010; Van der Elst et al., Reference Van der Elst, van Boxtel, van Breukelen and Jolles2005; Verhaeghen & Salthouse, Reference Verhaeghen and Salthouse1997) and visual inspection of our data. Expected correlations of age, sex, and education with AVLT performance were confirmed in our sample. Traditional stepwise procedures to evaluate the need for additional predictors based on p-values were overly sensitive given our large sample size. To avoid overfitting the model, we considered the need for additional predictors using 1% incremental variance explained where the R-squared from a model including the additional predictor was required to be improved by 1% or better. None of the terms for non-linear education (quadratic, cubic), cubic age, or two-way interactions met this requirement.
Derivation of Fully Corrected T-Scores
Linear regression models were fit on each primary and secondary scaled score and adjusted for age, age squared, sex, and education. To assess normality of standardized residuals, Q–Q plots were reviewed. Each participant’s covariate-adjusted score was converted to a T-score by rescaling the residuals (e i = Y i − Y pred) to mean (SD) of 50 (10). We computed mean (SD) values by age group (30–59 years, 60–69 years, 70–79 years, and ≥80 years), sex, and years of education (8–12, 13–15, 16, and 17–20) and compared them against expected criteria. If means were within 3 T-score points of the expected value of 50 (47–53) (Heaton, Reference Heaton2004) and if the SD was 9.4–10.6 T-score points, then we made no further adjustments for mean and SD. Four variables had SDs outside the specified range, which indicated the need for smoothing. Smoothing by age and age squared was considered, with age squared performing best. To continuously estimate the variances, we fit a new linear regression between absolute value of residuals and age squared. The T-score equations for measures list B, short- and long-term percentage retention, and memory efficiency score involve adjusted means and SDs based on these fits. A scaled score lookup table and T-score formulas were created for the generation of age, age squared, sex, and education-corrected T-scores (Appendix; Tables A2 and A3).
Derivation of Alternative T-Scores
Use of fully corrected T-scores is recommended to understand a person’s level of performance relative to their expected level of performance compared with an average peer of the same age, sex, and education. This is most helpful in determining whether performance represents a decline from an estimated baseline of performance. However, in some circumstances, a different standard of comparison may be helpful. For example, age-adjusted scores may be useful when comparing memory performance with other neuropsychological measures that only adjust for age. An option to calculate an age- and sex-adjusted score may be helpful if applying these norms to a person with an atypical educational background. For these circumstances, and to help facilitate future comparison of the effect of these differing levels of demographic adjustments, we also present regression equations adjusting for age alone and age and sex for our four primary variables (Appendix).
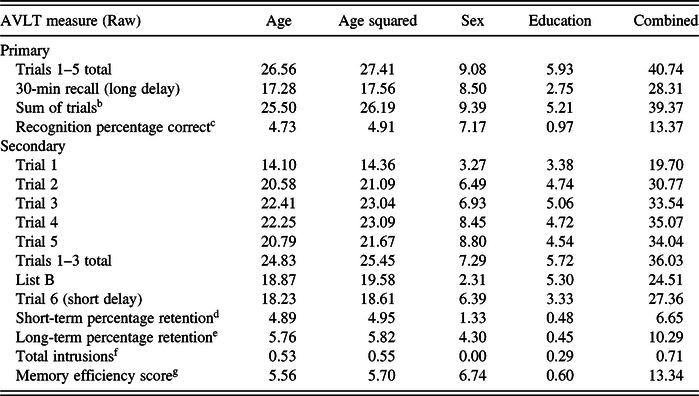
Cumulative Percentiles
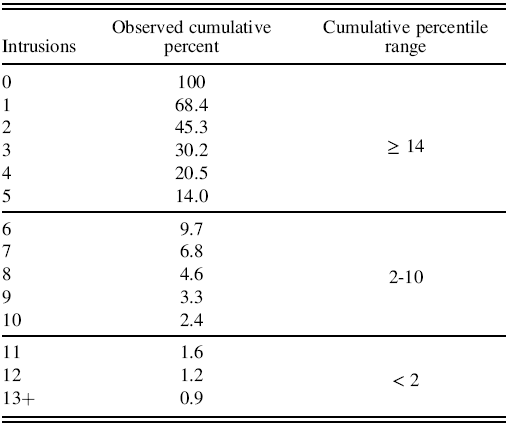
Intrusion errors are extra-list intrusions during recall trials (i.e., inserting an incorrect word not from the presented list during recall). Because total intrusions were highly skewed, there were too few positive observations to be able to use the normative approach described above, and demographic variables explained very little variance (<1% combined; Table 2), we provide cumulative percentiles for the entire sample without stratifying by demographic variables for total intrusions (Appendix; Table A4). Inclusion of intrusions in these normative data is important, given recent evidence that total intrusion errors on AVLT contributed to predicting progression from normal cognition to MCI or mild dementia, whereas learning slope and interference scores did not (Thomas et al., Reference Thomas, Eppig, Edmonds, Jacobs, Libon, Au and Alzheimer’s Disease Neuroimaging2018).
Percentage variance explained (Pearson correlation coefficient, squared) for each demographic variable and the full regression model (combined) a

Abbreviation: AVLT, Auditory Verbal Learning Test.
a Pearson Correlation Coefficients, Squared is equivalent to R 2. All P values for Pearson correlation coefficients (before squaring) are P < .001, except for intrusions, which are not significantly related to sex (Pearson or Spearman; P > .66).
b Trials 1–5 total + trial 6 + 30-min recall.
c ([Recognition hits + {15–recognition false positive errors}]/30) × 100.
d 100 × (trial 6/trial 5).
e 100 × (30-min delay/trial 5).
f Intrusions summed across trial 1 + trial 2 + trial 3 + trial 4 + trial 5 + list B + trial 6 + 30-min recall.
g {[(30-min delay/15)/(trials 1–5 total/75)] + [(recognition hits/15) – (recognition false positive errors/15)]}.
RESULTS
Need for Updated Norms
Application of original age-adjusted MOANS norms to cognitively unimpaired participants aged 56 years or older (n = 3,603) resulted in significantly fewer-than-expected participants demonstrating low performance on delayed recall. By using a lenient cutoff value for low performance (< −1 SD, which is a scaled score <7), only 7.3% of participants demonstrated low performance (vs. 15.9% expected; P < .001), and women were three times less likely to show low performance than men (3.5% vs. 11.1%). Furthermore, only 0.6% of participants demonstrated performance at a cutoff of < −2 SD (scaled score <4), none of whom were aged 80–91 years (2.3% expected; P < .001).
Effects of Demographic Characteristics on AVLT Performance
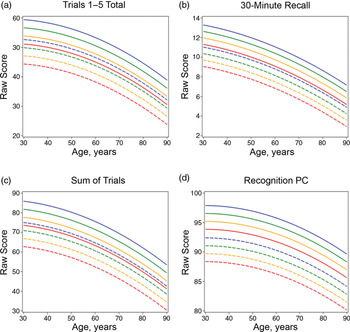
Figure 1 and Table 2 demonstrate the robust and important effect of age on AVLT performance across nearly all variables. Age effects were most prominent for recall performances and explained 17–26% of the variance in performance across most recall variables, except for trial 1 recall, which showed relatively less but still significant variance explained by age. Measures reflecting memory storage, including percentage retention (short and long delay), recognition percentage correct, and the memory efficiency score, which combines retention and recognition performances, showed a less robust but significant relationship with age and explained 4–5% of the variance in performance.
Regression models. Raw Auditory Verbal Learning Test scores were modeled on age/sex/education/age squared. Each graph shows the effect of age, age squared, sex (women, solid lines; men, dashed lines), and years of education (blue, 20 years; green, 16 years; orange, 12 years; red, 8 years on raw scores for trials 1–5 total (A), 30-min recall (B), sum of trials (C), and recognition percentage correct (recognition PC) (D).

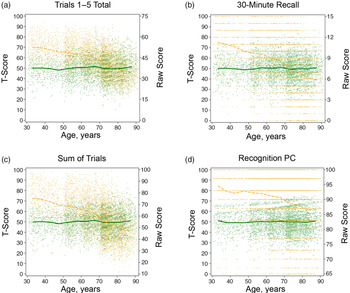
Auditory Verbal Learning Test (AVLT) T-scores correct for age effects. Raw AVLT scores (orange, right side of Y-axis) and demographically corrected (for age/sex/education/age2) AVLT T-scores (green, left side of Y-axis) demonstrating that T-scores correct for age effects. Corrected and raw AVLT T-scores are plotted versus age (lines represent mean scores within age quinquennia). Scores are for trials 1–5 total (A), 30-min recall (B), sum of trials (C), and recognition percentage correct (Recognition PC) (D). For recognition percentage correct, the raw scores had a skewed distribution, with the majority of participants scoring between 65% and 100%. However, a small number of participants (n = 86) scored in the range of 10–63%. For improved visualization, those values were plotted at 65%. This does not affect the computation of the mean (orange) line.

Sex effects were also robust across numerous AVLT response variables. Sex explained 6–9% of variance across most recall variables (except trial 1 and list B). Sex explained more variance (7%) than age (5%) for recognition percentage correct.
Education effects were significant but explained less variance than both age and sex. Education explained 4–6% of variance across most immediate-recall variables. Less variance was explained by education for delayed recall performances (2–3%), and education explained less than 1% of variance for retention and recognition measures.
Assessing Performance Characteristics of Fully Adjusted T-Scores
For every test variable, visual inspection of Q–Q plots was used to ensure normality. We inspected several plots to determine whether T-score corrections performed in the expected manner across the different levels of age, sex, and education for all variables. Means and 95% CIs for all groups by age (30–59 years, 60–69 years, 70–79 years, and 80–91 years), years of education by bins (8–12, 13–15, 16, and 17–20), and sex were inspected (Supplemental Figure 1). All observed means were within 3 points of the expected value of 50 (Heaton, Reference Heaton2004), and SDs were within 0.6 units of 10 (except where specified above). The derived fully corrected T-scores had a mean of approximately 50 across all ages (Figure 3), and the average T-score for persons with 12 or more years of education was approximately 50 (Supplemental Figure 2). Subtle deviations from 50 can be seen for those with less than 12 years of education, but the mean is still within our a priori specified range. The sample size for participants with less than a high school degree was small relative to our other education groups (Supplemental Table 2), which may be related to the method of defining education in the MCSA that counts a General Educational Development (GED) certificate as 12 years of education (Appendix). Fully adjusted T-scores effectively removed relationships to demographic variables as desired (all Pearson r < .003; all P > .84).
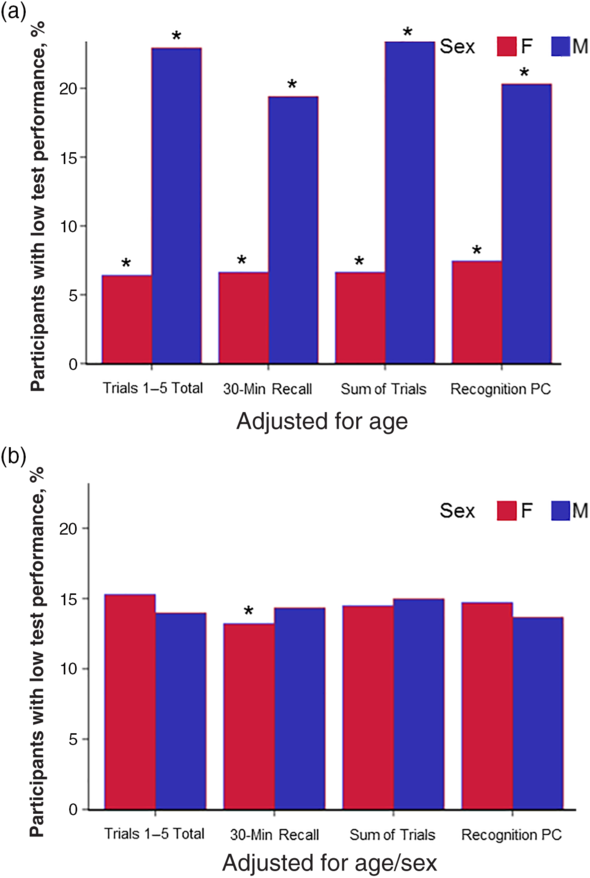
Percentage of Participants Showing Low Test Performance (T-score <40). Percentage of participants showing low test performance for age-adjusted (A) and age- and sex-adjusted (B) T-scores for the primary variables shown. The expected base rate is 14.7%. *Confidence Interval does not contain the 14.7% expected base rate value. F indicates female; M, male; PC, percentage correct.

Assessing Performance Characteristics of Alternative T-Scores: Effect of Sex
Derived alternative T-scores had a mean of approximately 50 across all ages. Supplemental Figure 1 shows the effect of adjusting for sex and education, in addition to age alone, for the primary variables. When stratifying by age group, sex, and education level, T-scores deviated widely from the expected mean of 50 if only age adjustment was used, narrowing substantially when sex was added to the model and to a lesser degree with the addition of education adjustment. Figure 3 shows the effect on base rates of low performance between men and women when sex adjustments are applied. When applying T-scores that adjust only for age, even in normative data derived from this sample, rates of low performance in women (T < 40) are approximately three times lower (6–7%) than in men (19–23%), and all are significantly different than expected base rates of low performance (95% CIs did not include the expected 14.7%). Application of fully corrected T-scores yielded expected base rates of low test performance (see Supplemental Table 3).
Validation in Independent Sample
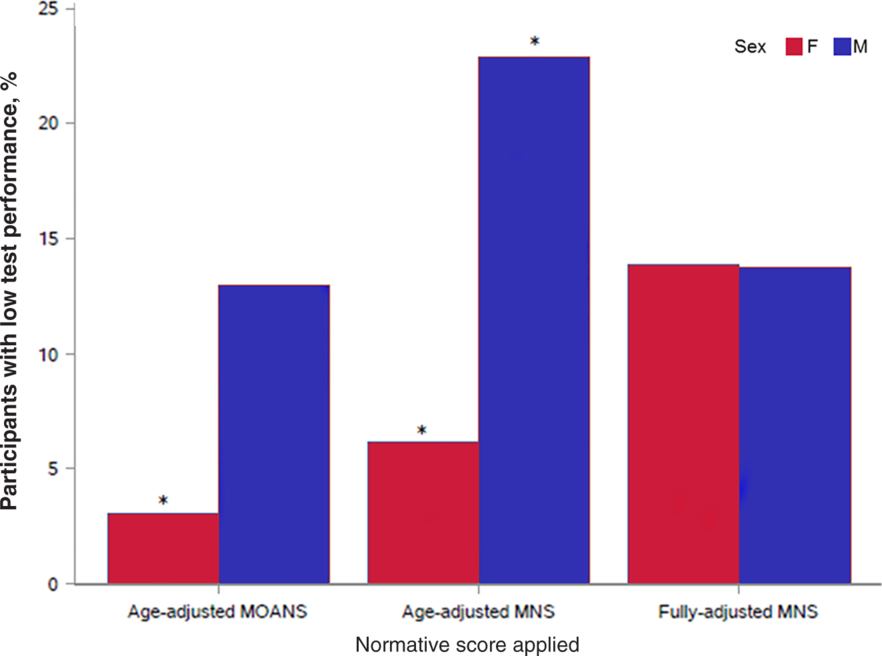
To validate results in an independent sample, we replicated several analyses using individuals newly enrolled in the MCSA after the time of data freeze used for this normative sample (March 2018) by including individuals age 56 or older to facilitate comparison to MOANS. Based on diagnosis per physician and study coordinator, we had 261 CU participants with mean age 73.3 (8.0 SD) and mean education 15.2 (2.4), and 50.2% were male. We applied MOANS and the new MNS to 30-min delayed recall. In CU individuals, Wilcoxon signed rank with continuity correction for dependent sample analyses showed there were significant differences when we have the same participant with the same raw score but two evaluation systems (MOANS age-corrected scaled scores and MNS fully corrected T-scores) for the overall group and among women (p < 0.001). There was no difference among men (p > .05). Figure 4 illustrates the percentage of participants showing low test performance across MOANS and MNS systems (age-adjusted and fully adjusted T-scores), with results replicating analyses within the normative sample (also see Supplemental Table 4).
Percentage of Participants in Validation Sample Showing Low Test Performance on 30-min Recall (< −1 SD). Percentage of participants showing low test performance on 30-min delayed recall when applying age-adjusted MOANS scaled scores (SS < 7), age-adjusted MNS T-scores (T-score <40), and fully adjusted MNS T-scores (T-score <40). The expected base rate is 14.7%. *Confidence Interval does not contain the 14.7% expected base rate value. F indicates female; M, male. MOANS = Mayo’s Older Americans Normative Studies. MNS = Mayo Normative Studies.

Test–Retest Reliability
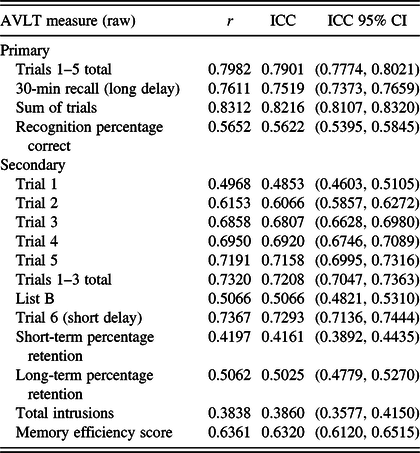
For a subset of participants (80.3%) with one follow-up AVLT visit available, we assessed test-retest reliability of raw scores by computing single-rating, absolute-agreement, two-way mixed intraclass correlation coefficients (ICC; Shrout & Fleiss, Reference Shrout and Fleiss1979). We also report Pearson correlation coefficients (Table 3). The average time between the baseline and follow-up test administrations was 16.7 months (SD = 4.5; range = 8.1–37.7). The mean age of the subsample at baseline was 68.6 (12.5 SD), mean education was 14.8 (2.6), and 50.2% were male. Sum of trials showed high reliability. Several other recall measures showed adequate reliability (trials 1–5 total, trials 1–3 total, trial 5, trial 6, 30-min recall). Single-trial immediate recall scores (e.g., trial 1, list B, etc.) and measures of encoding (recognition percent correct, percent retention scores, memory efficiency scores) showed marginal to low reliability.
Reliability coefficients: Pearson’s rho and ICC for test-retest sample (N = 3,555)

Abbreviation: AVLT, Auditory Verbal Learning Test.
Discussion
This study demonstrates a clear need for updated AVLT normative data that exclude persons with MCI, in addition to dementia, and that adjust for sex. Consistent with our first hypothesis, application of the original MOANS to this independent sample results in lower-than-expected base rates of low performance, with 7% of participants having a delayed recall AVLT scaled score less than 7, and only 0.6% having a scaled score less than 4. This suggests that despite screening participants for dementia, the original MOANS normative cohort may have included persons with MCI, because data collection predated the introduction of formal MCI diagnostic criteria (Petersen et al., Reference Petersen, Smith, Waring, Ivnik, Tangalos and Kokmen1999). The normative samples of many test publishers similarly do not exclude persons with MCI and, therefore, may similarly have lower sensitivity than expected when applied to patients (Delis et al., Reference Delis, Kramer, Kaplan and Ober2017). Our results demonstrate that this issue is amplified in women: Only 3.5% of women older than 55 years in our cohort had a delayed recall MOANS AVLT scaled score less than 7, compared with 11.1% of men.
These findings are particularly salient given that many clinicians view a −1 SD cutoff as a minimum expectation for mild levels of cognitive impairment, and the Jak/Bondi comprehensive criteria for MCI diagnosis require two scores lower than a −1 SD cutoff in one domain (Jak et al., Reference Jak, Bondi, Delano-Wood, Wierenga, Corey-Bloom, Salmon and Delis2009). In addition, although participants in this sample are cognitively unimpaired on the basis of consensus diagnosis between the study physician and the study coordinator, a portion of the sample would still be expected to show low performance on normative scores based on an expected normal distribution of test scores. It is notable that none of our participants aged 80 years or older had a delayed recall MOANS AVLT scaled score less than 4 (i.e., <2 SD below the mean). This highlights the importance of the updated norms we provide, particularly for older adults and women. Results suggest that normative data collected without careful exclusion criteria and participant screening most likely result in decreased sensitivity of normative scores and lower-than-expected base rates of low performance in cognitively unimpaired participants.
In agreement with previous studies, we found that sex accounts for variance in AVLT performance above and beyond age (8–10%), with women consistently outperforming men on AVLT measures. For example, Van der Elst et al. (Reference Van der Elst, van Boxtel, van Breukelen and Jolles2005), in a large sample of 1855 healthy participants aged 24–81 years, showed significant effects of sex on all AVLT measures, with women consistently outperforming men. Similarly, Sundermann et al. (Reference Sundermann, Biegon, Rubin, Lipton, Landau, Maki and Alzheimer’s Disease Neuroimaging2017; Reference Sundermann, Biegon, Rubin, Lipton, Mowrey, Landau and Alzheimer’s Disease Neuroimaging2016) found better immediate and delayed recall performance on the AVLT in female versus male controls; they further demonstrated that this female advantage held for AVLT delayed recall in persons with amnestic MCI despite comparable temporal lobe glucose metabolic rates and cortical amyloid β deposition. In a cognitively unimpaired cohort, Caselli et al. (Reference Caselli, Dueck, Locke, Baxter, Woodruff and Geda2015) also found that women had significantly better long-term memory on the AVLT than men regardless of APOE-ϵ4 status. Although the female advantage in verbal episodic memory may vary depending on task, it is not unique to the AVLT and has been observed consistently on other verbal memory measures (Asperholm et al., Reference Asperholm, Nagar, Dekhtyar and Herlitz2019).
This female advantage in verbal memory despite comparable levels of neuropathologic burden might imply preserved functioning, but evidence from our study suggests that base rates of cognitive impairment may be higher than previously thought. Consistent with our second hypothesis, adjusting for sex increased the base rate of low scores to expected levels relative to adjusting for age only. This indicates that sex-adjusted norms provide a better balance of sensitivity and specificity than the original MOANS norms and other normative sources that do not adjust for sex. These data support the increasing evidence that applying demographic adjustments to neuropsychological test norms is important for enhancing diagnostic accuracy.
In support of this, Sundermann et al. (Reference Sundermann, Maki, Biegon, Lipton, Mielke, Machulda and Alzheimer’s Disease Neuroimaging2019) recently demonstrated higher sensitivity in women and higher specificity in men by using sex-specific norms (compared with non-sex-specific norms) when applying the algorithmic Jak/Bondi psychometric criteria for amnestic MCI diagnosis to data from the Alzheimer’s Disease Neuroimaging Initiative (ADNI), as opposed to the typical clinical diagnosis applied in ADNI (Bondi et al., Reference Bondi, Edmonds, Jak, Clark, Delano-Wood, McDonald and Salmon2014; Jak et al., Reference Jak, Bondi, Delano-Wood, Wierenga, Corey-Bloom, Salmon and Delis2009). Specifically, they found that when applying sex adjustments to AVLT performance, 10% of women previously identified as normal were classified as amnestic MCI; conversely, 10% of men with a previous diagnosis of amnestic MCI were classified as normal, with results supported by biomarker status. Both underestimating and overestimating cognitive impairment have treatment implications, one resulting in missed treatment opportunities and the other resulting in stress and unnecessary treatment. Both types of misdiagnosis may negatively affect quality of life. We anticipate that our updated norms will help decrease misdiagnoses, and that inclusion of alternative T-scores will facilitate future investigations into the effects of sex on diagnostic accuracy across various neurologic disorders.
Although associations between memory performance and education are less robust than age and sex, our results show that education explains a significant amount of variance for most AVLT variables. This finding is consistent with evidence that those with higher education perform better on memory measures (Uchiyama et al., Reference Uchiyama, D’Elia, Dellinger, Becker, Selnes, Wesch and Miller1995; Van der Elst et al., Reference Van der Elst, van Boxtel, van Breukelen and Jolles2005). Application of our fully adjusted T-score formulas for persons with 8 versus 20 years of education results in a 10-point T-score difference for men (11 for women) on the score for trials 1–5 total. Thus, the 6% variance explained by education has important clinical influence for persons with high and low levels of education. Some studies have also demonstrated that adjusting for estimated or observed intelligence quotient (IQ) accounts for variance, otherwise, explained by education (Steinberg et al., Reference Steinberg, Bieliauskas, Smith, Ivnik and Malec2005), but these estimates are not always readily available or use test versions that may differ from those originally used in studies that apply an estimated IQ adjustment. Thus, adjusting for education affords greater flexibility than adjusting for IQ. Overall, adjusting for education remains a reasonable method to help determine the extent to which a score represents a decline from premorbid estimates or is atypical for an individual examinee.
There are several strengths of the current normative data. Whereas prior MOANS studies only included older adults, the current sample includes persons aged 30 years and older, thereby expanding the AVLT normative data to younger adults. In addition, the current study used a large population-based sample. Whereas similar large-scale research studies exist and could be used for development of normative data, the majority include only older adults and mirror a memory clinic in their recruitment designs. For instance, in the ADNI (Weiner et al., Reference Weiner, Veitch, Aisen, Beckett, Cairns and Green2017), participant recruitment was designed to match that of clinical trials; thus, a high proportion of participants enroll because they have a memory concern or family history of dementia. Our population-based sample is representative of typical aging adults in the general community; participants are not seen in a clinical context. This has several important implications. For instance, the normative data presented here can be applied to a wide range of clinical populations besides those with memory concerns or risk of dementia, because inclusion criteria for the MCSA are broad. Test-retest reliability data are provided for a nearly 1.5 year average follow-up interval, which approximates what is often seen in clinical practice. Clinicians and researchers are encouraged to prioritize AVLT measures with at least adequate reliability coefficients (Slick, Reference Slick, Strauss, Sherman and Spreen2006), and should note that process scores and recognition have low to adequate reliability.
The AVLT is sensitive to verbal memory deficits across numerous neurologic conditions (Strauss et al., Reference Strauss, Sherman, Spreen and Spreen2006), and the AVLT has demonstrated better sensitivity than the California Verbal Learning Test (CVLT) to left temporal abnormality (Loring et al., Reference Loring, Strauss, Hermann, Barr, Perrine, Trenerry and Bowden2008). These updated norms will facilitate continued widespread use of the AVLT and provide an important alternative to calculating z-scores based on cell means and SDs, as is currently available via the AVLT meta-norms (Schmidt, Reference Schmidt1996). Also, unlike a typical research design using convenience sampling, our epidemiologic study design prospectively sampled persons to match the census of Olmsted County. Therefore, the current study is less susceptible to selection bias, which further improves the generalizability of these results.
The current study also has limitations. First, our sample is predominantly white and not of Hispanic origin. We recommend using available Mayo’s Older African Americans Normative Studies norms for African American persons (Ferman et al., Reference Ferman, Lucas, Ivnik, Smith, Willis, Petersen and Graff-Radford2005). Second, the overall study sample remains heavily weighted toward older adults, with 76% of the current sample older than 60 years. However, because the sample is large (N = 4,428), representation in the younger adult age ranges is sufficient for derivation of normative data. To put our sample size in perspective relative to other commonly used normative datasets, AVLT meta-norms (Strauss et al., Reference Strauss, Sherman, Spreen and Spreen2006) provide a sample of 2699 persons, only 359 of whom are older than 57 years. The CVLT, second edition, norms were based on 1087 adults aged 16–89 years, with 397 older than 60 years (Delis et al., Reference Delis, Kramer, Kaplan and Ober2000). The recently released CVLT, third edition, included 700 examinees, with even distribution across the following age groups: 16–19, 20–29, 30–44, 45–59, 60–69, 70–79, and 80–90 years (Delis et al., Reference Delis, Kramer, Kaplan and Ober2017). In comparison, our older adult sample is 8.5–11 times larger, with 3375 participants aged 60 years or older. Third, the way education data were collected coded individuals with a GED and individuals who graduated from high school as both having 12 years of education. There may be important differences in the educational experiences of these two groups that are not captured by these norms. Finally, some neuropsychologists have questioned whether age should be adjusted in normative data (Sliwinski et al., Reference Sliwinski, Hofer, Hall, Buschke and Lipton2003), and growing evidence suggests that a large proportion of late-life cognitive decline is driven by clinically silent common neuropathologic processes (Harrington et al., Reference Harrington, Schembri, Lim, Dang, Ames, Hassenstab and Group2018; Sliwinski et al., Reference Sliwinski, Hofer, Hall, Buschke and Lipton2003; Yu et al., Reference Yu, Boyle, Segawa, Leurgans, Schneider, Wilson and Bennett2015). Some of these processes can now be measured in vivo (Jack et al., Reference Jack, Bennett, Blennow, Carrillo, Feldman, Frisoni and Dubois2016), whereas a majority can only be measured at autopsy or remain unknown (Boyle et al., Reference Boyle, Yang, Yu, Leurgans, Capuano, Schneider and Bennett2017; Reference Boyle, Yu, Wilson, Leurgans, Schneider and Bennett2018). Although we recommend fully corrected T-scores for clinical use, neuropsychologists should remain aware of this issue and understand that a normal score for a person in a particular age group does not guarantee the absence of preclinical pathology-related cognitive change. For researchers interested in conceptualizing cognitive decline as a reflection of cumulative damage to the brain with increasing age, the use of age-corrected scores may confound the desired effect of interest (Jack et al., Reference Jack, Wiste, Weigand, Knopman, Vemuri, Mielke and Petersen2015).
In summary, the current study provides updated normative data for the AVLT for an expanded age range, excludes persons with MCI in addition to dementia, and adjusts for important demographic variables. Results highlight the importance of adjusting for sex; this adjustment will help to account for clinically meaningful variance in AVLT performance between men and women and provide a better balance of sensitivity and specificity than the original MOANS norms and other normative sources that do not adjust for sex. Results from the current study continue the MOANS tradition of providing normative data and will help keep the AVLT as an important alternative measure for clinicians and research centers.
Acknowledgments
We thank the participants and staff at the Mayo Clinic Study of Aging. This work was supported by the Rochester Epidemiology Project (R01 AG034676), the National Institutes of Health (grant numbers P50 AG016574, P30 AG062677, U01 AG006786, and R01 AG041851, RF1 AG55151), a grant from the Alzheimer’s Association (AARG-17-531322), the Robert Wood Johnson Foundation, The Elsie and Marvin Dekelboum Family Foundation, Alzheimer’s Association, and the Mayo Foundation for Education and Research.
N.H.S. and M.M.Mi. serve as consultants to Biogen and Lundbeck. D.S.K. serves on a Data Safety Monitoring Board for the DIAN-TU study and is an investigator in clinical trials sponsored by Lilly Pharmaceuticals, Biogen, and the University of Southern California. R.C.P. has served as a consultant for Hoffman-La Roche Inc., Merck Inc., Genentech Inc., Biogen Inc., Eisai, Inc., and GE Healthcare.
CONFLICT OF INTEREST
The authors have nothing to disclose.
Supplementary Material
To view supplementary material for this article, please visit https://doi.org/10.1017/S1355617720000752
Appendix
All materials in the Appendix used with permission of Mayo Foundation of Medical Education and Research. An excel file that automates T-scores calculations is available by request through the Mayo Clinic Study of Aging website at the following link: https://www.mayo.edu/research/centers-programs/alzheimers-disease-research-center/research-activities/mayo-clinic-study-aging/for-researchers/data-sharing-resources
AVLT measures.

Abbreviation: AVLT, Auditory Verbal Learning Test. %, percentage. FP = false positive.
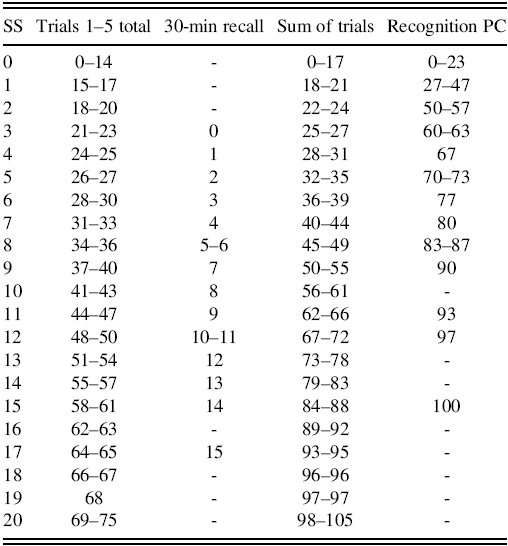
Table for converting raw scores to unadjusted scaled scores for primary variables. a

Note. 30-min recall = 30-min delayed recall; PC = percentage correct; sum of trials = trials 1–5 total + trial 6 + 30-min recall.
Table for converting raw scores to unadjusted scaled scores for secondary variables. a

Note. STPR = short-term percentage retention; LTPR = long-term percentage retention.
T- Score Formulas
Age, sex, and education-adjusted T-scores for a subject’s raw score(s) can be calculated with the formulas below.
SS = scaled score: determined from look-up tables A2 and A3.
Sex: 0 = Female, 1 = male
Education level determination rules were as follows:
-
If < 12 years, each full year of school completed is counted
-
Vocational/trade school years completed are counted
-
GED = 12 years
-
High school diploma = 12 years
-
College without degree: years completed are counted (13–15 years)
-
4 or more years of college, with no degree = 15 years
-
Bachelor’s degree = 16 years
-
Bachelor’s degree plus some graduate school = 17 years
-
Master’s degree = 18 years
-
Master’s degree plus some doctoral level courses = 19 years
-
Attorneys and priests = 19 years
-
Doctoral degree = 20 years
Note. Caution is suggested when interpreting performance in individuals with 8–11 years of education. Application of the fully demographically corrected normative formulas for individuals with age or education levels outside of the observed ranges is not recommended.
Equations for Fully Adjusted T-Scores:
Primary Variables
Trials 1–5 total T-score =rounde(50+((((AVLTSum5SS -(10.2048820335+(Age* 0.0696731708)+(Male*-2.0691847063)+(EDUC* 0.2076286782)+(Age**2 *-0.0014410120)))/1)+0.0000000637336)/0.23569807));
30-min recall T-score =rounde(50+((((AVDSS-(12.4118437425+(Age*-0.0016432817)+(Male*-1.8612455591)+(EDUC* 0.1380628944)+(Age**2 *-0.0007027918)))/1)+0.0000001024411)/0.25299505));
Sum of trials T-score =rounde(50+((((AVLTsum5p6DSS-(10.8349191766+(Age* 0.0514562686)+(Male*-2.0670904968)+(EDUC* 0.1915793153)+(Age**2 *-0.0012694294)))/1)-0.0000001038205)/0.23673872));
Recognition percentage correct T-score=rounde(50+((((AVRecPCSS -(10.7915054797+(Age* 0.0163995950)+(Male*-1.8832719513)+(EDUC* 0.1180746912)+(Age**2 *-0.0005488200)))/1)+0.0000001925238)/0.29155771));
Secondary Variables
Trial 1 T-score =rounde(50+((((AV1SS -(10.5554207904+(Age* 0.0361599800)+(Age**2 *-0.0009181852)+(Male*-1.2432854518)+(EDUC*0.1518778446)))/1)-0.0000001305326)/0.26867547));
Trial 2 T-score =rounde(50+((((AV2SS -(10.2054872384+(Age* 0.0513655747)+(Age**2 *-0.0011932848)+(Male*-1.7651639080)+(EDUC*0.1919280336)))/1)-0.0000000448036)/0.25613384));
Trial 3 T-score =rounde(50+((((AV3SS-(10.6083066798+(Age* 0.0436932539)+(Age**2 *-0.0011424483)+(Male*-1.7605746863)+(EDUC*0.1870822095)))/1)-0.0000001720072)/0.24470110));
Trial 4 T-score =rounde(50+((((AV4SS -(10.3271703981+(Age* 0.0637213583)+(Age**2 *-0.0013266346)+(Male*-1.9598250972)+(EDUC*0.1859304791)))/1)-0.0000002083300)/0.24650622));
Trial 5 T-score =rounde(50+((((AV5SS -( 9.9952872306+(Age* 0.0622550674)+(Age**2 *-0.0012837374)+(Male*-1.9754640301)+(EDUC*0.1870905944)))/1)-0.0000000482041)/0.24516225));
Trials 1–3 Total T-score =rounde(50+((((AVLTSum3SS -(10.4083623066+(Age* 0.0537576200)+(Age**2 *-0.0012667176)+(Male*-1.8439550539)+(EDUC*0.1987705165)))/1)-0.0000000560410)/0.23872421));
List B T-score =rounde(50+((((AVBSS -( 8.9167820377+(Age* 0.0780069203)+(Age**2 *-0.0013677187)+(Male*-1.1375184278)+(EDUC*0.1914262059)))/(2.3996448266+(Age**2 *-0.0000533322)))+0.00000967380900)/0.12287159));
Trial 6 T-score =rounde(50+((((AV6SS -(11.7981182251+(Age* 0.0154689603)+(Age**2 *-0.0008517340)+(Male*-1.6396477808)+(EDUC*0.1436500033)))/1)+0.0000000285607)/0.25404381));
Short-term percentage retention T-score =rounde(50+((((AVSTPRSS -(12.3521586103+(Age*-0.0320618335)+(Age**2 *-0.0001238422)+(Male*-0.7356439106)+(EDUC*0.0493228458)))/(1.7628871897+(Age**2 * 0.0001168168)))+0.00000072036751)/0.12110756));
Long-term percentage retention T-score =rounde(50+((((AVLTPRSS -(13.3565938006+(Age*-0.0448177870)+(Age**2 *-0.0000815093)+(Male*-1.3287251835)+(EDUC*0.0567713694)))/(2.0060197485+(Age**2 * 0.0000707217)))+0.00000042085768)/0.12427314));
Memory efficiency score T-score =rounde(50+((((AVMemEffScSS -(11.6072102613+(Age* 0.0018532956)+(Age**2 *-0.0004164258)+(Male*-1.6379708166)+(EDUC*0.0747602251)))/(1.8870824513+(Age**2 * 0.0000241449)))-0.00000100593800)/0.14018809));
Alternative T-Score Formulas for Primary Variables
Equations for age-adjusted and sex-adjusted T-Scores:
Trials 1–5 Total T-score =rounde(50+((((AVLTSum5SS -(13.3975677899+(Age* 0.0739281419)+(Age**2 *-0.0015449437)+(Male*-1.9300702911)))/1)-0.000000215137900)/0.24136506));
30-min recall T-score =rounde(50+((((AVDSS -(14.5348232863+(Age* 0.0011860656)+(Age**2 *-0.0007719013)+(Male*-1.7687412914)))/1)-0.000000142809100)/0.25534659));
Sum of trials T-score =rounde(50+((((AVLTsum5p6DSS-(13.7813144042+(Age* 0.0553751285)+(Age**2 *-0.0013653039)+(Male*-1.9391251867)))/1)+0.000000188774220)/0.24155121));
Recognition percentage correct T-score =rounde(50+((((AVRecPCSS -(12.6060146804+(Age* 0.0188551657)+(Age**2 *-0.0006082048)+(Male*-1.8039811735)))/1)+0.000000150739090)/0.29305345));
Equations for Age-Adjusted T-Scores:
Trials 1–5 total T-score =rounde(50+((((AVLTSum5SS -(12.7156031925+(Age* 0.0621605724)+(Age**2 *-0.0014370025)))/1)-0.000000053633100)/0.25992588));
30-min recall T-score =rounde(50+((((AVDSS-(13.9098621394+(Age*-0.0095978869)+(Age**2 *-0.0006729826)))/1)+0.000000048148911)/0.27021437));
Sum of trials T-score =rounde(50+((((AVLTsum5p6DSS-(13.0971814680+(Age* 0.0435109130)+(Age**2 *-0.0012564840)))/1)-0.000003235023000)/0.26026677));
Recognition percentage correct T-score =rounde(50+((((AVRecPCSS -(11.9632533397+(Age* 0.0080540559)+(Age**2 *-0.0005089992)))/1)+0.000000096505809)/0.30660879));
Total number of intrusions across all trials (trials 1–5, list B, trial 6, and 30-min recall). The second column includes the observed cumulative percent. The third column provides ranges for suggested bins for clinical decision-making.