One of the most noticeable dimensions along which second language (L2) learners differ is fluency—that is, temporal aspects of oral production that influence the degree of fluidity in speech (e.g., pauses, hesitation phenomena, speech rate). This interpretation of fluency is distinct from the notion of fluency as overall proficiency (Chambers, Reference Chambers1997; Lennon, Reference Lennon1990; Skehan & Foster, Reference Skehan and Foster1999; Trofimovich & Baker, Reference Trofimovich and Baker2006; Wood, Reference Wood2001). Even native speakers’ temporal fluency can differ quite widely, as evidenced by popular references to fast and slow talkers. The problems in defining oral fluency are well known (Riggenbach, Reference Riggenbach2000). Although this term denotes an automatic procedural skill on the part of the speaker, fluency must also be considered from the standpoint of the listener (Guillot, Reference Guillot1999). For this reason, the study of fluency necessarily entails an examination of both the temporal features of speech and their relationship to listener judgments. The present study focuses on these issues. However, because we are examining relatively low-proficiency learners, we are not concerned with Fillmore’s (Reference Fillmore, Fillmore, Kemple and Wang1979) higher features of native language fluency such as creativity but rather with the basic dimension of talking with “few pauses” (p. 93).
Because fluency is a defining feature of an individual’s first language (L1) output, one might expect that it is a trait (i.e., a relatively permanent characteristic specific to an individual) and that a relationship between the temporal characteristics of a speaker’s L1 and L2 productions can be attributed to cognitive factors such as working memory (see Towell & Dewaele, Reference Towell, Dewaele and Dewaele2005). For example, it seems unlikely that a person who is relatively dysfluent in his or her L1 would be highly fluent in a L2 (Raupach, Reference Raupach, Dechert and Raupach1980). An alternative view, however, is that fluency is a language-specific state, such that a speaker could be highly fluent in one language but not fluent at all in another, compared with others of the same general proficiency level. Of course, in reality, there may be aspects of fluency that are traitlike and others that are statelike. A clear understanding of L2 fluency requires an examination of all the factors that influence it, for both theoretical and pedagogical reasons. In view of the complex array of such influences on L2 fluency, we cannot expect to resolve the emerging issue of state versus trait in a single study. Nonetheless, we hope to contribute to the discussion about the relationship between L1 and L2 fluency through a longitudinal investigation of two L1 groups of adult immigrant English-as-a-second-language (ESL) students.
MODELS OF FLUENT SPEECH PRODUCTION
Current conceptions of speech production have been strongly influenced by Levelt’s (Reference Levelt1989) and Levelt, Roelofs, and Meyer’s (Reference Levelt, Roelofs and Meyer1999) model, a L1 framework that postulates that speakers have a general knowledge component; a conceptualizer, in which messages are generated; a formulator, in which grammatical and phonological encoding takes place once lemmas and forms have been accessed in the lexicon; an articulator that produces overt speech; and a speech comprehension system. In L1 speakers, production is highly automatized and rapid speech is the norm. This steady-state model has been adapted by de Bot (Reference de Bot1992) for bilingual speech production. He noted that a bilingual model needs to account for a variety of phenomena characteristic of L2 speech, including codeswitching, crosslinguistic influences, slower L2 speech production, and differences in L1 and L2 mastery. Additionally, he observed that a complete model should allow for multiple languages and interactions across those languages. More recently, Kormos (Reference Kormos2006) developed a comprehensive model of L2 speech production, also based on Levelt’s work, which takes into account previous theoretical constructs and empirical research. She argued that L2 speakers’ degree of automaticity affects the rate of speech production in the L2. Furthermore, Kormos’s model posits an additional “store of declarative knowledge of syntactic and phonological rules” (p. 178). Although these models are helpful in conceptualizing L2 speech production, they have not yet yielded much insight into the state versus trait issue. Moreover, although it has been argued that the site of L2 fluency problems is the formulator, because that is where declarative knowledge is converted to procedural knowledge (Towell, Hawkins, & Bazergui, Reference Towell, Hawkins and Bazergui1996), the possibility that L2 oral fluency is also affected in the articulator and the conceptualizer cannot be dismissed.
Insight into the state versus trait issue can be gained through empirical investigation of automatic processing in receptive abilities in both the L1 and the L2 (Segalowitz & Hulstijn, Reference Segalowitz, Hulstijn, Kroll and De Groot2005) as well as through a comparison of fluency measures (e.g., acoustic measures and rating data) of L1 and L2 productions. In general, a state view suggests that L1 and L2 fluency are relatively independent, whereas a trait view entails that L1 and L2 fluency are closely related. Although the data discussed here can be used to explore the relationship between L1 and L2 fluency, because we are only concerned with articulatory productions, we will not address where in the speech production process fluency problems arise.
L2 FLUENCY RESEARCH
SLA fluency research has primarily focused on the development of L2 fluency. Most studies have examined only one L1 group at a time—sometimes with very few learners (e.g., Lennon, Reference Lennon1990), often only from a foreign language learning perspective (e.g., Towell, Reference Towell2002), and often when the L1 and the L2 are related (e.g., English and another Indo-European language). For instance, Segalowitz and Freed (Reference Segalowitz and Freed2004) studied English-speaking learners of Spanish. A difference between the current study and others (e.g., Díaz-Campos, Reference Díaz-Campos2004; Freed, Segalowitz, & Dewey, Reference Freed, Segalowitz and Dewey2004; Lafford, Reference Lafford2004) is the availability of detailed longitudinal data from more than two points in time that include both temporal measures of speech and listener evaluations. Although Trofimovich and Baker (Reference Trofimovich and Baker2006) studied fluency measures of Korean speakers of English at 3 months, 3 years, and 10 years after arrival in the United States, their study was cross-sectional rather than longitudinal and did not include fluency ratings of L1 productions.
A few previous studies have directly compared L1 and L2 fluency; however, because of methodological differences, their relevance to the present work is limited. Riazantseva (Reference Riazantseva2001) focused on the relationship between L2 proficiency and pausing in both the L1 (Russian) and the L2 (English). The intermediate learners in her study showed more L1-like pause durations in English than did the advanced learners. She concluded that some differences in L1 and L2 fluency are due to a transfer of L1 pausing patterns that “could be language specific” (p. 522) but that increased proficiency in the L2 may allow speakers to overcome the transfer effects. Again, Riazantseva’s study differs from the present one in that she examined learners who were of intermediate proficiency or higher, whereas our participants were relative beginners at the outset of the study. Additionally, Riazantseva’s study focused entirely on pause phenomena, with no global assessments of fluency. Finally, her pause measures started at 100 ms, a much shorter criterion than the one used here.
Towell and Dewaele (Reference Towell, Dewaele and Dewaele2005) provided a detailed description of conceptual frameworks that have been invoked to account for oral fluency development in a L2. Relevant models make reference to such constructs as automatization (Segalowitz, Segalowitz, & Wood, Reference Segalowitz, Segalowitz and Wood1998), differences in working memory and ability to store knowledge (Just & Carpenter, Reference Just and Carpenter1992; Pienemann, Reference Pienemann1998), neurobiological factors (Dewaele, Reference Dewaele and Cook2002), and the distinction between declarative and procedural knowledge (Ullman, Reference Ullman2001). In a study designed to evaluate the role of these factors in L2 fluency, Towell and Dewaele observed a positive correlation between L1 and L2 speaking rates in adult learners of French who studied abroad; however, they found slightly higher Spearman correlations during the first or second year of study than after study abroad. Although L2 fluency improved over time in these learners, Towell and Dewaele’s hypothesis that differences in working memory would account for the results was not confirmed. Nonetheless, students whose speaking rates remained slow after study abroad performed less well on a recall task in their L1, which suggests that limited ability to store knowledge may have been a contributing factor. Another key finding of Towell and Dewaele’s investigation was that improvement in grammatical knowledge, which occurred for all learners, was not necessarily linked to improvement in oral fluency.
Segalowitz and Freed (Reference Segalowitz and Freed2004) examined both oral proficiency (ratings on the ACTFL Oral Proficiency Interview) and fluency (i.e., fluidity or smoothness) in learners of Spanish under two conditions: at home in an English-speaking environment and in Spain. Although the study-abroad students made superior progress in fluency development and oral proficiency, the relationship to the learning context was not straightforward. Not only did language contact time fail to predict gains in performance but a negative relationship between hours spent with homestay families and oral proficiency was found. The authors speculate that repetitive, somewhat superficial interactions in the homestay may have led some students to develop compensatory strategies rather than improved linguistic skills. Additionally, Segalowitz and Freed found that “initial oral performance levels may also influence learners’ predispositions to make use of extracurricular communicative activities” (p. 195); that is, higher proficiency learners were more likely to engage in extracurricular activities.
Study-abroad research provides important yet often difficult-to-interpret information about the role of context in language learning (Collentine & Freed, Reference Collentine and Freed2004). However, the generalizability of this type of research is limited because it centers on participants who have self-selected to study a new language. Immigrants, the focus of the present study, represent a different, more heterogeneous category of learners who are also immersed in a L2 context. They have not self-selected for language study, but rather most have chosen to move to a new country for reasons of employment, family, or security. Because of this difference, it is important not to overgeneralize any aspects of L2 learning, including fluency, on the basis of study-abroad research alone.
RATIONALE FOR THE CURRENT STUDY
This study is part of a series of investigations that examine the development of oral production and perception in Russian- and Ukrainian- (which we will refer to here as Slavic) and Mandarin-speaking adult L2 learners of English. Previous research has identified within-learner cognitive influences on L2 fluency, such as phonological memory (O’Brien, Segalowitz, Freed, & Collentine, Reference O’Brien, Segalowitz, Freed and Collentine2007), attention (Ellis, Reference Ellis2006), and facility in lexical access (Segalowitz, Reference Segalowitz2007; Segalowitz et al., Reference Segalowitz, Freed, Collentine, Lafford, Lazar and Díaz-Campos2004). In general, even proficient and fluent L2 speakers tend to speak more slowly than native speakers (Munro & Derwing, Reference Munro and Derwing2001); however, relatively little is known about the development of fluency over time. The current study examines the relationship between L1 and L2 fluency productions in light of influences such as overall exposure to spoken English, which is both a precursor and a prerequisite to oral fluency development. Although this influence is external to the learner, to some degree it is within the learner’s control. Indeed, Segalowitz observed that “it is reasonable to assume that a person normally develops high levels of access fluidity and attention control only through extensive exposure to and practice with the target language in naturalistic communicative situations” (p. 184).
In our previous work, observations and tests were conducted at approximately 2-month intervals throughout the participants’ first year of residence in Canada and at an additional point about 2 years after the outset of the study. In the first investigation, we (Derwing, Rossiter, Munro, & Thomson, Reference Derwing, Rossiter, Munro and Thomson2004) collected fluency ratings from phonetically untrained listeners of the Mandarin learners’ productions at 2 months into the study on three distinct tasks. We also measured several temporal factors typically used in research of this type (Towell et al., Reference Towell, Hawkins and Bazergui1996), such as pauses, mean length of run (i.e., the number of words between pauses), speaking rate, hesitations, and pruned syllables (i.e., a composite measure in which all dysfluencies, such as filled pauses, hesitation phenomena, and self-repetitions, are removed). Fluency varied across task types: A picture story task (the “suitcase narrative”) was found to be more difficult than tasks that offered the speakers more freedom of lexical and grammatical choice, such as a monologue or a conversation. Not only did the raters perform reliably on a judgment task, but several temporal measures correlated significantly with their ratings, which suggests that the listeners were reacting similarly to fluency features present in the recorded utterances.
The second investigation in the series (Derwing, Thomson, & Munro, Reference Derwing, Thomson and Munro2006) compared fluency ratings of both Mandarin and Slavic speakers at the start of the study, at 2 months, and at the end of the first year of residence in Canada. Although the Slavic speakers showed significantly improved fluency in terms of listener judgments over this 1-year time frame, the Mandarin speakers did not. In Derwing, Munro, and Thomson (Reference Derwing, Munro and Thomson2008), a subset of the same speakers’ fluency at 2 months, 1 year, and 2 years of residence in the L2 environment was judged by another set of untrained raters to assess ongoing improvement. Again, only the ratings of the Slavic speakers demonstrated a significant increase in fluency. We suggested that the differential performance of the two groups was related to overall exposure to English outside of ESL class time and that it could be understood in terms of the willingness to communicate framework proposed by MacIntyre, Clément, Dörnyei, and Noels (Reference MacIntyre, Clément, Dörnyei and Noels1998). In general, the Slavic speakers had considerably more interactions in English outside of their ESL classroom hours than did the Mandarin speakers. (See Derwing et al., Reference Derwing, Munro and Thomson2008, for a full description of the participants’ differential exposure to English.)
RESEARCH QUESTIONS
Here, we extend our previous research (Derwing et al., Reference Derwing, Rossiter, Munro and Thomson2004, Reference Derwing, Munro and Thomson2008; Derwing, Thomson, & Munro, Reference Derwing, Thomson and Munro2006) to explore the relationship between L1 and L2 fluency. Thus, the primary focus of this article is this first research question:
1. What is the relationship between fluency ratings in the L1 and the L2 over time?
We addressed this question by collecting fluency ratings from linguistically trained speakers of the participants’ L1s and from a cohort of phonetically trained English language raters who evaluated speech samples taken from the picture story task (the “suitcase narrative”) at 2 months, 1 year, and 2 years. The L1 and L2 ratings were then compared statistically.
2. What is the relationship between temporal measures of fluency in the L1 and the L2 over time?
To answer this question, we measured the number of pauses per second (pause/s), the speech rate (SR; i.e., the number of syllables per second), and the pruned syllables per second (pruned syll/s). These measures were then correlated with the rating data. Additionally, because Riazantseva (Reference Riazantseva2001) found that “Russian speakers with high English proficiency made significantly shorter pauses when they spoke their L2, English, than when they spoke their L1, Russian” (p. 510), it could be expected that the Russian speakers in the present study would also show changes in pause duration over time.
The data collected to address research questions 1 and 2 afforded us the opportunity to ask a third question, which has not received attention in previous studies:
3. To what extent are temporal measures of fluency in both the L1 and the L2 correlated with fluency judgments of L1 and L2 productions?
Although earlier work has revealed that temporal variables correlate strongly with fluency ratings in the L2 (Derwing et al., Reference Derwing, Rossiter, Munro and Thomson2004; Dewaele, Reference Dewaele and Regan1998), similar patterns of correlations for L1 data would indicate that raters are able to make reliable fluency judgments independent of accent and grammatical accuracy.
METHOD
Speakers
The speakers analyzed in this study are a subset of a larger pool of participants described in Derwing et al. (Reference Derwing, Thomson and Munro2006). Because this is a longitudinal study, there was some attrition at the 2-year point. We therefore chose to limit the number of speakers to 32 in the present study to ensure an equal number of participants in each language group. Sixteen adult native speakers of Mandarin (M = 34;4 years, range = 27–42; 6 men and 10 women) and 16 adult native speakers of Slavic languages (15 Russians and 1 Ukrainian; M = 38;6 years, range = 19–49; 8 men and 8 women) participated. All were well-educated immigrants to Canada who had arrived less than 4 months (M = 2;8 months, range = 1–4) before they were selected to participate. Using the Canadian Language Benchmarks Assessment tool, all participants were evaluated as beginners in listening and speaking, although most had studied English in China (M = 6;9 years) and the former Union of Soviet Socialist Republics (M = 5;7 years). The speakers were attending a full-time ESL program at the time of the first recording; by the final data collection, after 2 years, many had completed their formal ESL instruction and were either employed or enrolled in employment training programs. All speakers passed a pure-tone hearing screen (i.e., a standard test in which hearing thresholds are verified for normalcy).
Speaking Task
We sampled the Mandarin and Slavic speakers’ speech on seven occasions over 2 years, using a high-quality minidisk recorder in a quiet room. Each time, the participants performed a number of tasks, including picture narrations (the “suitcase narrative” was used a total of four times). During the first data collection period (time 1), the participants examined the picture story for 1 min and then described the eight-frame set of cartoons in their L1 and in English, their L2. Only the L1 version from time 1 was used in this study. We elicited English language versions of the same set of pictures 2 months later (time 2), 10 months after the first data collection (time 6), and once more 1 year later (time 7). To ensure that the L1 productions did not influence the L2 samples, we deliberately used L2 samples from times 2, 6, and 7 only rather than using the L2 production from time 1. The drawings in the picture narration task, the “suitcase narrative,” depicted a man and a woman carrying identical green suitcases. They approached the same corner from different directions, accidentally bumped into each other, and fell down. They then stood up, apologized, and continued on their respective ways, only to discover later that they had mistakenly taken the wrong suitcases.
Rating Stimulus Preparation
We selected the first 30 s from the Mandarin and Slavic L1 narratives and eliminated any initial pauses. This approach helped to ensure comparable content across all speakers (Derwing et al., Reference Derwing, Rossiter, Munro and Thomson2004; Munro, Derwing, & Morton, Reference Munro, Derwing and Morton2006). The two sets of L1 samples were randomized separately and recorded onto CDs to be played to native speakers of Mandarin and Slavic languages. Similar 20-s samples of the same speakers’ L2 English productions from times 2, 6, and 7 were pooled, randomized, and recorded onto a CD for the English-speaker raters. Because of the large number of speech samples (3 samples × 32 speakers), we used shorter samples for the L2 ratings to guard against listener fatigue.
There is no consensus in the field concerning the appropriate length of speech samples for fluency evaluation by judges. In earlier studies (e.g., Derwing et al., Reference Derwing, Thomson and Munro2006), we determined that 20 s was sufficient for raters to make a reliable assessment. It is not true that longer is necessarily better. Our decision represents a recognition of the inevitable trade-offs that occur in research of this type. Twenty seconds is subjectively perceived by raters as a long time. Using substantially longer speech samples not only lengthens the duration of the experiment, which in turn increases the demands on listeners, but also has the potential to make the rating of individual samples more difficult, because the raters must hold in memory a longer narrative. A further limitation of longer speech samples is that they may increase the likelihood of primacy and recency effects.
Native-Speaker Raters
Eight native speakers of Mandarin (two men and six women; M = 32 years) and eight native speakers of Russian (one man and seven women; M = 34 years) rated the Mandarin and Slavic productions, respectively. All of the raters were highly proficient speakers of English and all had some linguistics training. (The Russian raters were advised that one of the voices was Ukrainian. None of the raters reported difficulty judging the fluency of the Ukrainian speech samples.) Eight native speakers of Canadian English (two men and six women; M = 42;1 years), all of whom had backgrounds in linguistics, rated the L2 productions. All raters reported normal hearing, but because the native English raters were older, on average, than the Mandarin and Russian listeners, their hearing was tested with a pure-tone screen and was found to be normal.
Rating Tasks
The ratings of the Mandarin and Slavic productions were collected individually or in pairs from the L1 listeners. We showed the participants the picture stimuli used in the narrative prior to the listening task to avoid a familiarity bias in later samples. The judges listened to the entire 30-s sample before rating each speaker on a 9-point fluency scale in the L1 (from 1 = extremely fluent to 9 = extremely dysfluent). We told the raters that we were most interested in temporal aspects of the productions (e.g., the number and length of silent pauses, filled pauses, self-repetitions, false starts). We also told them that all the speakers were educated individuals with no speech disorders and that, for these reasons, we did not expect them to use the whole scale. The judges of the English L2 speech samples also saw the picture story before completing the rating task using the same 9-point scale, and they, too, were told to focus on temporal aspects of fluency rather than general proficiency in English.
Temporal Measures
The 30-s Mandarin and Slavic speech samples were each transcribed by a native speaker of Mandarin and Russian, respectively, in standard Chinese characters and Cyrillic. The transcribers also provided character-by-character or word-for-word English glosses and overall translations as well as marks for pauses (both filled and unfilled), lexical hesitation devices used in either Mandarin or Russian, self-corrections, self-repetitions, false starts, nonlexical filled pauses, and asides. Using a waveform display program, one of the researchers then measured these phenomena to the nearest millisecond.
Similar measurements were made of the speakers’ L2 productions, which were then standardized by dividing the total value of each measure by the total number of seconds of each production. We chose to use pause/s, SR, and pruned syll/s as the measures of fluency because they have been employed extensively in other studies (e.g., Lennon, Reference Lennon1990; Riggenbach, Reference Riggenbach1991; Towell et al., Reference Towell, Hawkins and Bazergui1996). Following common practice (Derwing et al., Reference Derwing, Rossiter, Munro and Thomson2004), only pauses of 400 ms or longer were considered. Once the numbers of self-corrections, self-repetitions, false starts, nonlexical filled pauses, and asides were established, we subtracted all of these measures from the total number of syllables to arrive at a pruned syllables measurement, which was then standardized by calculating pruned syll/s. None of the components of the pruned syll/s measure are frequent enough to stand on their own in statistical analyses, but taken together, they result in a measurement that is a strong predictor of fluency judgments (Derwing et al.; Mehnert, Reference Mehnert1998; Ortega, Reference Ortega1999).
Because informal, impressionistic assessments by the researchers suggested that the Mandarin speakers’ vowel durations in English were noticeably prolonged compared with those of the other speakers, we added a further temporal measure—vowel durations of the first 12 vowels produced by each speaker in both the L1 and the L2 productions. These vowels were measured from the onset of voicing. In open syllables, the end of each vowel was defined as the point at which audible voicing concluded, whereas in closed syllables, the end point was defined as the beginning of the following consonant. For comparative purposes, we drew 16 speech samples from a database of adult native speakers of English (3 men and 13 women) who produced the same suitcase narrative. These narrators ranged in age from 24 to 46 years (M = 34 years). All reported normal hearing. Recordings were made under the same conditions and with the same equipment as for the nonnative speakers.
RESULTS
Interrater Reliability
The intraclass correlation coefficient was used to measure the degree of interrater reliability for each group of raters’ evaluations of the speakers’ productions. The Mandarin L1 raters’ coefficient was .90, the Russian raters’ coefficient was .89, and the English native-speaker raters’ coefficient was .92. These results indicate high levels of agreement among all three groups of raters.
Preliminary Analyses
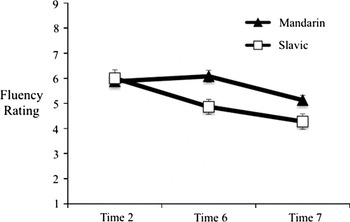
Prior to addressing our research questions, we conducted some preliminary analyses to verify that the data from this cohort of raters were consistent with the data obtained in our previous studies (Derwing et al., Reference Derwing, Thomson and Munro2006, Reference Derwing, Munro and Thomson2008). After determining consistency with the previous results, the fluency ratings were submitted to a mixed-design ANOVA with L1 group (Mandarin, Slavic) as a between-groups factor and time (2, 6, and 7) as a within-groups factor. The effect of L1 group just missed significance, F(1, 30) = 4.17, partial η2 = .122, p = .05. However, the effect of time, F(2, 60) = 23.71, partial η2 = .441, p < .001, was significant, as was the two-way interaction, F(2, 60) = 7.30, partial η2 = .196, p < .005. The interaction was explored by means of post hoc t tests (Bonferroni adjusted to require p < .008 for statistical significance), which revealed that the Mandarin group’s fluency ratings did not show significant improvement between times 2 and 7, t(15) = 2.32, p = .035, whereas those of the Slavic group did, t(15) = 6.67, p < .008. However, the Mandarin group’s scores between times 6 and 7 improved significantly, t(15) = 4.53, p <.008. These results generally confirm the findings of Derwing et al. (Reference Derwing, Munro and Thomson2008), which used different raters and a different scale (seven points). In particular, the Slavic speakers, but not the Mandarin speakers, were rated as more fluent at the end of the study than at the beginning. The difference in the Mandarin speakers’ scores at times 6 and 7 appears to have been due to a nonsignificant tendency for that group to regress slightly from time 2 to time 6, a pattern observed in both Derwing et al. (Reference Derwing, Munro and Thomson2008) and the present study (see Figure 1). Nevertheless, no significant net change in fluency scores for the Mandarin speakers was found over the course of the study.
Mean fluency ratings (with standard error) for the Mandarin and Slavic groups at times 2, 6, and 7 (1 = extremely fluent, 9 = extremely dysfluent).

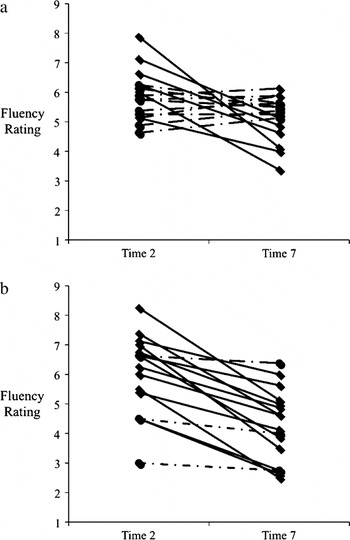
Individual patterns of performance within groups were also examined, as shown in Figures 2a and 2b. A comparison of the two figures shows a much larger number of learners who improved in the Slavic group (n = 13) than in the Mandarin group (n = 6). Furthermore, two of the Slavic speakers who did not improve were rated as having the best fluency at time 2; they therefore had less room to improve than the other participants. Of the eight top performers at time 2 in the Mandarin group, only one showed improvement of one point or more, whereas for the Slavic speakers, six of the top eight showed improvement.
Changes in individual speakers’ fluency ratings from time 2 to time 7. The speakers represented by solid lines improved at least one scalar unit, whereas those represented by broken lines showed either no improvement or worse ratings at time 7: (a) Mandarin group; (b) Slavic group.

Finally, in preparation for the parametric correlational analyses, we submitted all rating data and temporal measures to tests of normality (i.e., Shapiro-Wilks). No significant deviations from normal were observed.
Relationship Between Fluency Ratings in the L1 and the L2 Over Time
Although the data allow a correlational examination of L1 and L2 fluency, they cannot be used to compare L1 and L2 fluency directly because different raters were used and the variability within the L1 and the L2 speaker groups was different. In the L1 condition, for example, the listeners’ reference points for highly fluent versus dysfluent speech were likely quite different from those of the listeners who heard the L2 samples. Thus, the range for the listeners of fluent versus dysfluent speech was somewhat smaller.
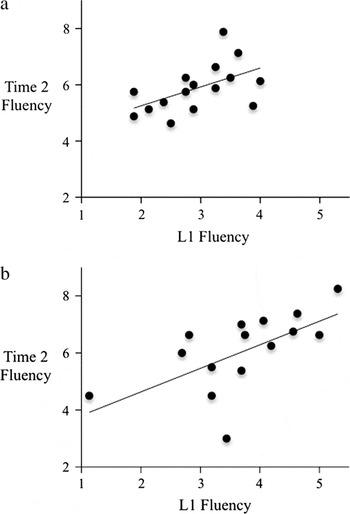
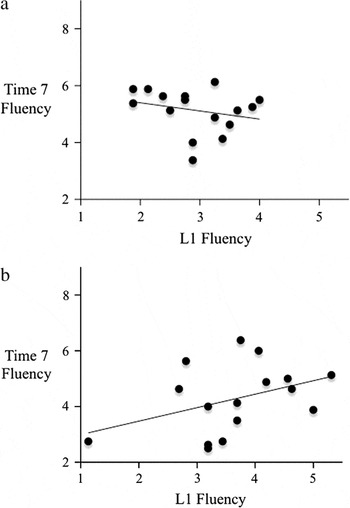
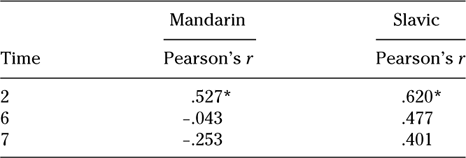
Pearson correlations between the fluency ratings of the same speakers’ L1 and L2 indicated that there was a significant positive correlation for both Mandarin- and Slavic-speaking participants at time 2 (i.e., when they were still relatively beginning learners) but that, at times 6 and 7, there were no significant relationships, as shown in Table 1. The lack of significance at times 6 and 7 cannot simply be due to reduced variability in fluency scores at those times or to insufficient variability in the L1 scores. In fact, the fluency scores at time 6 showed a wider span for the Mandarin speakers than at time 2. Moreover, the fact that L1 fluency scores correlated significantly with time 2 fluency ratings demonstrates that there was sufficient variability in the L1 ratings. Scatterplots that show the scores for individual speakers comparing L1 fluency ratings with L2 ratings at times 2 and 7 are provided in Figures 3a, 3b, 4a, and 4b.
Relationship between L1 fluency and L2 fluency at time 2: (a) Mandarin group; (b) Slavic group.

Relationship between L1 fluency and L2 fluency at time 7: (a) Mandarin group; (b) Slavic group.

Correlations between L1 and L2 fluency ratings
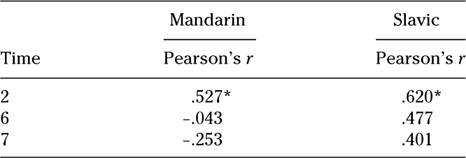
* p < .05.
To determine whether L1 fluency ratings were predictive of the speakers’ degree of improvement over time, we carried out an additional analysis in which we compared the fluency scores in the L1 with the change in fluency scores between time 2 and time 6 and between time 2 and time 7. Pearson correlations (df =14) were not significant, either for the Mandarin speakers, r = –.454, p = .08 and r = –.496, p = .05, respectively, or for the Slavic speakers, r = –.264, p = .32 and r = –.336, p = .20, respectively. Thus, there was no statistically significant indication that L1 fluency scores were related to the speakers’ improvement in L2 fluency over time, despite an initial relationship at time 2.
Relationship Between Temporal Measures of Fluency in the L1 and the L2 Over Time
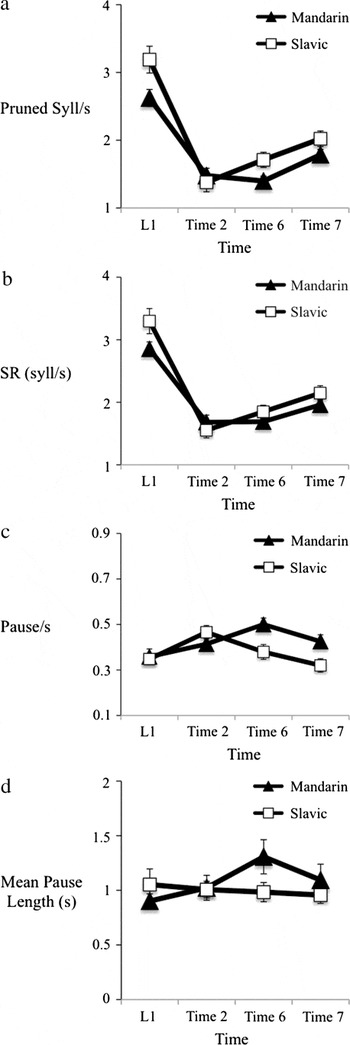
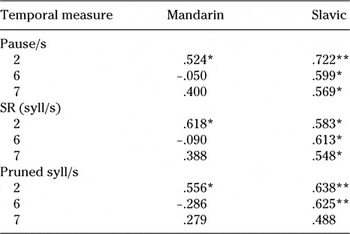
When the L1 measures of pause/s, SR, and pruned syll/s were compared with the same measures for the L2, there was a significant correlation at time 2 for both groups, similar to the relationship observed for the fluency ratings. Figures 5a–5d present the mean values for each of the temporal measures (i.e., pruned syll/s, SR, pause/s, and pause length, respectively), and Table 2 presents the results of the correlational analyses. At times 6 and 7, significant L1 and L2 correlations were found for the Slavic group only (with the exception of pruned syll/s at time 7; see the Appendix for fluency ratings and temporal measurements).
Mean (a) pruned syll/s, (b) SR, (c) pause/s, and (d) pause length, for the Mandarin and Slavic groups in the L1 and in the L2 at times 2, 6, and 7. Error bars represent standard error.

Pearson correlations of L1 and L2 temporal measures

Note
All temporal measures were standardized by dividing by the total number of seconds.
* p < .05 (two-tailed).
** p < .01 (two-tailed).
Although the temporal properties of the speakers’ utterances have been evaluated in Derwing et al. (Reference Derwing, Rossiter, Munro and Thomson2004), we carried out one additional analysis to address a point arising from Riazantseva’s (Reference Riazantseva2001) research. To determine whether her finding of differential pausing over time held for the data under consideration here, we computed one-way repeated measures ANOVAs for each speaking group and compared the mean durations of unfilled pauses in the L1 and at times 2, 6, and 7 (see Figure 5d).
For the Mandarin speakers, the main effect was nonsignificant, F(3, 45) = 2.361, p = .084, and for the Slavic speakers, the main effect was also nonsignificant, F(3, 45) = 0.259, p = .855. Thus, there was no indication of any difference between mean pause times in the L1 and pause times at any of the data collection points in the L2 for either language. Nor did the speakers differ across the three L2 data collection times.
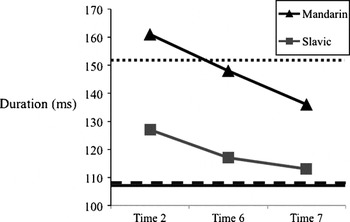
As indicated in Figure 6, the mean vowel durations for the first 12 vowels in each narrative were 152, 107, and 108 ms for Mandarin, Slavic, and English, respectively. A one-way between-groups ANOVA with three levels of L1 that compared durations across the three languages yielded a significant main effect, F(2, 45) = 9.889, p < .001. Post hoc t tests (Bonferroni-adjusted to require p < .017) indicated that the Mandarin mean vowel duration was significantly longer than the mean durations of both the Slavic, t(30) = 3.7715, p < .001, and English, t(30) = 3.3675, p < .005, vowels. However, the difference between Slavic and English durations was not significant, t(30) = 0.0472, p = .9627.
Mean L2 English vowel durations over time are contrasted with mean L1 vowel durations. The solid line indicates mean L1 Slavic vowel durations, the dashed line indicates mean L1 English vowel durations, and the dotted line indicates mean L1 Mandarin vowel durations.

An additional analysis was carried out on the English vowel productions of both groups of L2 speakers. A mixed-design ANOVA with L1 group (Mandarin, Slavic) as a between-groups factor and time (2, 6, and 7) as a within-groups factor yielded a significant effect of L1, F(1, 30) = 20.791, partial η 2 = .409, p < .001, and of time, F(2, 60) = 5.091, partial η 2 = .145, p < .01. The two-way interaction was not significant, F(2, 60) = 0.470, partial η 2 = .015, p = .627. These results indicate that the Mandarin speakers’ English vowels were longer than those of the Slavic speakers and that the English vowels in both groups became significantly shorter over time.
Correlations of Temporal Measures of Fluency With L1 and L2 Productions
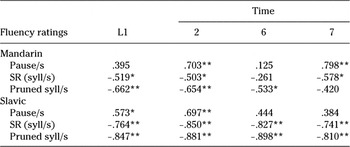
Pearson correlations between the L1 fluency ratings and temporal measures (i.e., L1 pause/s, SR, and pruned syll/s) as well as correlations between L2 fluency ratings and these same temporal measures at each of the three collection times are provided in Table 3. Fluency scores were significantly correlated with at least one of the three temporal measures for both groups in the L1 and at all times in the L2; however, the correlations were almost always stronger for the Slavic speakers.
Pearson correlations between fluency ratings and temporal measures

Note
All temporal measures were standardized by dividing by the total number of seconds.
* p < .05 (two-tailed).
** p < .01 (two-tailed).
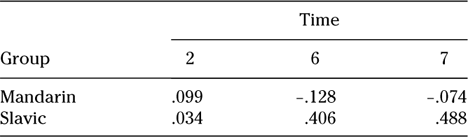
To determine whether the L2 vowel durations and the fluency ratings were related, Pearson correlations between the two sets of measures for all three times were computed (see Table 4). No significant correlations were found.
Correlations between mean L2 vowel durations and mean fluency ratings
DISCUSSION
In this study, we examined fluency ratings and temporal measures of the L2 with comparable measures in the L1 to determine whether speakers who were extremely fluent in their L1 would be more fluent than their peers in the L2. Is fluency a trait that transfers across languages, or is it a state that must be developed independently? The clearest relationship between L1 and L2 fluency ratings was observed in the initial stages of L2 exposure, and, overall, this relationship was stronger in the Slavic than in the Mandarin learners of English. However, at later stages, the correlation between the judgments was lower and not statistically significant in either group. Nor was there a statistical relationship between L1 fluency and improvement in fluency over time. These findings indicate that the state versus trait question cannot be fully resolved with this study. On the one hand, our results are not very consistent with a trait view, at least in the first 2 years of language learning. If fluency were strictly a trait, applicable in both the L1 and the L2, we would expect a continued relationship between L1 and L2 fluency over time, provided that the learners gained increasing proficiency in their L2 at the same rate. For the participants observed here, there was a weakening of the relationship between L1 and L2 fluency ratings over time, but there was also a difference in degree of voluntary exposure to English between the two groups (Derwing et al., Reference Derwing, Munro and Thomson2008). It is not possible to determine whether the weakening relationship was due to increased variability in English proficiency across the learners or to the nontraitlike nature of fluency. On the other hand, if fluency were strictly a state, rather than a trait, the fluency of highly proficient L2 speakers should vary in ways that are not predictable from L1 fluency performance. In other words, advanced speakers should be more fluent in their L2 than in their L1 just as often as the reverse, holding contextual factors such as topic, interlocutor, and setting constant. Because we have not examined L2 speakers at the stage of ultimate attainment, it is not possible for us to test this prediction.
The discrepancy in the learners’ fluency ratings at different collection times raises an important methodological issue. Had we relied solely on a comparison of L1 and L2 fluency ratings at time 2, we might have drawn the conclusion that there is a straightforward relationship between L1 and L2 fluency. However, the lack of correlation at time 7, nearly 2 years after time 2, indicates that such a conclusion would have been unwarranted. This finding points to the necessity of ongoing longitudinal research to achieve a full understanding of L2 fluency development. For instance, many of the Mandarin learners in this study may have not yet crossed a necessary threshold that would allow them to make significant progress in fluency development because of their more limited exposure to and experience with English compared with the Slavic speakers over the course of this study (Derwing et al., Reference Derwing, Munro and Thomson2008).
When we examined temporal measures (i.e., pause/s, SR, and pruned syll/s), again a relationship was found between the L1 and the L2 in both groups at time 2 for all three measures, but only the Slavic group showed significant correlations at times 6 and 7, and these were weaker than at time 2. With respect to SR, this outcome is similar to that of Towell and Dewaele (Reference Towell, Dewaele and Dewaele2005), who found significant correlations between L1 and L2 SRs for learners of French, although the strength of the correlation was slightly lower at time 2 of their study than at time 1. The reason for this patterning is unclear, but it may be that, especially in the early stages of learning, the Slavic speakers benefited from the structural parallels between their L1 and English. In the case of the Mandarin speakers, perhaps the most effective language learners were those whose L1 fluency scores were best. These individuals may have already capitalized as much as possible on their superior oral skills by time 2 in the study. The lack of a relationship between L1 and L2 fluency at the later times appears to be due to a lack of improvement in these individuals, whereas the other participants started to catch up.
We evaluated mean unfilled pause durations to test Riazantseva’s (Reference Riazantseva2001) contention that pause durations for Russian speakers would decline in English as their proficiency increased. Although Riazantseva found that high-proficiency Russian speakers of English paused less in their L2 than in their L1, we were unable to replicate this finding. The time 7 unfilled pause durations for Slavic speakers (many of whom were advanced speakers by that point) were not significantly different from their L1 unfilled pauses and pause durations and did not decline between the end of the first year (time 6) and the end of the second year (time 7). It is not clear why this discrepancy in findings occurred.
Our examination of one additional temporal measure—vowel duration—brought to light another difference between the two participant groups: The Slavic speakers eventually approached nativelike English vowel durations more closely than the Mandarin speakers. Although both groups showed improvement, the closer approximation by the Slavic speakers may be attributed to transfer from the L1, given that Russian has vowel reduction much like English but Mandarin does not. Transfer from the L1 may also be implicated in the case of the Mandarin speakers, whose L1 vowels may be longer on average than some English vowels because they carry tone (Zhang, Reference Zhang2002). Longer vowel durations in the Mandarin productions may have led the English listeners to assign harsher ratings because of their expectations about the role of vowel duration in stress assignment (Hahn, Reference Hahn2004; Zielinski, Reference Zielinski2008).
The comparison of temporal measures and L2 fluency ratings at times 2, 6, and 7 confirmed that temporal measures of the type typically used in fluency research correlate with listener judgments. However, the listeners appeared to assign ratings that better reflected temporal measures for the Slavic than for the Mandarin speakers. We can only speculate that there were other features in the Mandarin speech that influenced the listeners’ ratings. Most importantly, however, the temporal variable that best predicted L1 fluency (i.e., pruned syll/s) also emerged as the strongest predictor of most of the L2 fluency ratings. This occurred even though the L1 and L2 raters were different groups of participants. Methodologically, this finding attests to the meaningfulness of listener judgments of both L1 and L2 speech. It also suggests that raters of L2 speech can indeed focus on fluency even when other aspects of the speech stream (e.g., accentedness and grammatical inaccuracies) are present.
CONCLUSIONS
These findings offer valuable insights into the complex relationship between L1 and L2 fluency—namely, that a straightforward relationship between fluency in the L1 and the L2 cannot be expected. As Segalowitz and Freed (Reference Segalowitz and Freed2004) observed, easily interpretable results are virtually nonexistent. A variety of factors, including the structural properties of the L1 itself, the proficiency levels of the speakers, the degree of exposure to the L2 (including instruction), and cognitive factors such as working memory (Segalowitz et al., Reference Segalowitz, Segalowitz and Wood1998), all contribute to fluency development. Resolving the state versus trait issue will require further investigations of these areas and may entail individual cognitive assessments of adult L2 learners.
These results also point to pedagogical implications for the English language classroom. The Mandarin learners, and, to a lesser extent, the Slavic learners, might well have benefited from direct fluency instruction such as the activities advocated by Nation (Reference Nation1989) and Gatbonton and Segalowitz (Reference Gatbonton and Segalowitz2005) because, despite living in an almost monolingual English community, the participants did not have access to many opportunities to speak English outside of class. Their ESL program focused heavily on the development of written language and academic English, with little time left for oral skills practice, which perhaps resulted in an increase in declarative knowledge with little or no concomitant enhancement of procedural knowledge. In interviews, several participants reported that they would have liked more listening and speaking practice in their ESL classes. Perhaps there was an assumption on the part of the program organizers that the students would be able to supplement their classroom experiences in the larger community, although for many learners that was not the case. To help learners take advantage of fluency development opportunities, ESL programs could plan contact activities that would benefit both the learners and the members of the larger community with whom they would interact. Dudley (Reference Dudley2007) provided suggestions for volunteering experiences that could lead to greater oral fluency and proficiency in adult L2 learners.
A limitation of the present study is that it is restricted to the first 2 years of linguistic development in adult immigrant learners, who had not yet reached a state of ultimate attainment. More extensive longitudinal investigations are necessary to establish the long-term relationship between L1 and L2 fluency. Ortega and Iberri-Shea (Reference Ortega and Iberri-Shea2005) have observed the need for much longer studies to cover the time frame during which significant aspects of L2 development occur. Furthermore, given the quite different patterns of performance between the two groups who participated here, investigations that involve a greater range of L1s should be carried out. It may be that there are closer L1 and L2 fluency relationships in some language pairings than in others. Further insights may also be gained by a much closer examination of individual learner performance. Finally, it will only be with more research that we can discover why Ellis and Larsen-Freeman’s (Reference Ellis and Larsen-Freeman2006) observation that “the very things that make a known language easy make a new language hard” (p. 568) seems to apply to some, although not all, participants in this study.
APPENDIX MEAN FLUENCY RATINGS AND TEMPORAL MEASUREMENTS