Introduction
Clays can be engineered into earthen construction materials through geopolymerization. Common alternatives to conventional calcium-based precursors include aluminosilicates such as fly ash, ground-granulated blast furnace slag (Abdalqader et al., Reference Abdalqader, Jin and Al-Tabbaa2015; Yi et al., Reference Yi, Gu and Liu2015; Yuan et al., Reference Yuan, Yuan, Straub and Chen2020), metakaolin (Rovnaník, Reference Rovnaník2010), and ash from incineration of crop residue (Thomas et al., Reference Thomas, Yang, Mo, Abdalla, Hawileh and Ariyachandra2021). Alkali activation of aluminosilicates in clay yields geopolymers (Gao et al., Reference Gao, Yu and Brouwers2015a; Gao et al., Reference Gao, Yu and Brouwers2015b), the use of which typically leads to 45–65% less carbon footprint than cement (McLellan et al., Reference McLellan, Williams, Lay, van Riessen and Corder2011). The move away from fossil fuels has globally reduced the slag-based aluminosilicate stockpile. Press mud (PM) is a Ca/Fe-rich, organic, non-toxic by-product from the purification of sucrose juice, formed through the reaction of added calcium oxide and gaseous carbon dioxide with sliced cane or beet. The process is described by Eqns (1) and (2):


Press mud (PM) is referred to variously in the literature as lime cake, filter cake, filter press mud, mud cake, vacuum filter cake, lime sludge, carbonated sludge, beet lime, defecation lime, and LimeX. Press mud has been produced since the early 1840s in the UK and since the late 1930s in the United States. Given the global production of 182.9 million tons of sugar per year (U.S. Department of Agriculture, 2022), ~87.8 million tons of PM is generated annually. In the UK, the British Sugar company processes ~8 million tons of beet annually across its four major facilities, producing ~1.1 million tons of sugar. This yields an estimated 5900–7400 tons of dry PM per year. The rival ASR Group uses imported cane to process ~1.2 million tons annually, generating between 12,000–16,000 tons (cautious estimate) and 36,000–60,000 tons (optimistic estimate) of dry PM. The majority of PM is stockpiled or landfilled, and limited amounts are used as a soil conditioner, soil fertilizer, or human food by resource-poor families, a feed ingredient for animals notably for ruminants, and other industrial applications including cement and paint manufacturing, foaming agent, and as a composting aid for bagasse (van der Poel et al., Reference van der Poel, Schiweck and Schwartz1998). In recent years, PM has been used in brick manufacturing (Kerr, Reference Kerr2020) and in the stabilization of swelling clays (James and Pandian, Reference James and Pandian2016; James, Reference James2020) and clayey silts (Assadi-Langroudi et al., Reference Assadi-Langroudi, Ghadr, Theron, Oderinde and Katsipatakis2019). Precipitation and coulombic adsorption of goethite in PM onto negatively charged clay faces (Ohtsubo, Reference Ohtsubo1989), along with pozzolanic reactions (Gumanta et al., Reference Gumanta, Ghadr, Chen, Liu, Hung and Assadi-Langroudi2023), have been shown to reduce swelling-shrinkage potential and increase water-retention capacity under unsaturated conditions.
In more complex alkali-activated systems, goethite may become repellent to clay platelets if the pH of the surrounding soil solutions falls below its point of zero charge (Zech et al., Reference Zech, Dultz, Guggenberger, Prechtel and Ray2020). The organic matter within PM would be co-located with the clay phase, and its effects on clay behavior would be diverse, complex, and dependent on organic chemistry and packing (Abedi et al. Reference Abedi, Slim, Hofmann, Bryndzia and Ulm2016; Huang et al., Reference Huang, Zhang, Luo, Wei and Fu2021). In the context of goethite precipitation, the influence of adsorbed organic matter on Fe-oxide surface charge remains uncertain. Organic coatings can modify hydrophilicity, meaning that if goethite precipitates within a clay-organic matrix, its crystal growth and orientation can become broadly varied (Zhang et al., Reference Zhang, Liu, Kong and Chen2022). In the context of geopolymerization, it is plausible that organic molecules shield reactive sites on aluminosilicate surfaces, slowing their dissolution and shifting early-stage reaction kinetics. It is equally plausible that complex alkalis/Al species at the clay–organic interface modify the rheology and guide the gel speciation and pathway (Provis and van Deventer, Reference Provis and van Deventer2009). In the context of cation–organic interactions, the role of hydrated cations as bridging agents between negatively charged clay surfaces and organic molecules via their hydration shells was described by Underwood et al. (Reference Underwood, Erastova and Greenwell2016). Those authors echoed the broader understanding that water molecules in the first hydration shell of Ca2+ are orientationally structured and can mediate hydrogen bonding to organic ligands or functional groups. For sugars such as sucrose, which contain multiple hydroxyl groups, such water bridging is theoretically possible. In complex systems, however, it is unknown whether carbonate, hydroxyl, or silicate species may outcompete sucrose for interaction with Ca2+. Likewise, the kinetic impact of such complexes on subsequent pozzolanic or geopolymerization reactions is unknown.
The present study seeks to address these open questions and explore scopes for using PM to promote pre-emptive polymerization and crystallization in clay, both prior to and alongside pozzolanic reactions.
Introduction
Press mud (PM) is a Ca/Fe-bearing organic by-product from sugar refining. This study examined whether PM can be used as a co-activatable precursor to pre-empt and guide polymerization and controlled crystallization in Mercia mudstone under alkaline activation, and quantifies how PM content and activator dosage modulate early reaction pathways and strength under sealed (not-carbonated, NC) versus gassed (carbonated, C) curing. The present study thus aimed to: (1) quantify time-resolved mineralogical and functional-group evolution (3, 7, 21 days) for PM contents of 10–45 wt.% and activator-to-press-mud mass ratio (A/P) of 0.22–0.28 under NC and C curing using diffuse reflectance infrared Fourier transform spectroscopy (DRIFTS), X-ray diffraction (XRD), and scanning electron microscopy (SEM); (2) resolve the reaction sequence and its dependence on PM content and A/P; (3) compile a Lewis–HSAB (hard and soft acids and bases) pathway model that aligns evidence from IR-XRD and encodes reaction sequence and causality; (4) relate microstructural markers to mechanical response (axial stress at normalized strains 0.2, 1.0, and 1.2) and identify transitional behavior; (5) determine how increasing activator dosage shifts the balance among silicate provision, alkalinity, Fe(III) speciation, and carbonation efficiency; and (6) assess how Fe-oxyhydroxide/coating formation moderates carbonation gains in C curing compared with NC.
Four hypotheses are put forward: (1) increasing dissolved silicate and pH (greater A/P ratio) in the presence of PM organics delays goethite crystallization and stabilizes ferrihydrite skins, thereby extending the alkaline dissolution window and front-loading C-S-H (calcium silicate hydrate) and N-A-S-H (sodium aluminosilicate hydrate) nucleation; (2) organo-Ca(II) water-bridged complexes (sucrose-Ca-clay) sequester pore water at early ages, suppressing geopolymerization at low to intermediate PM contents and moderating strength; (3) zeolitic sodium aluminosilicate hydrate acts as a competitive hydrophilic phase, further constraining bulk water and influencing rheology and strength evolution; and (4) carbonation generally increases strength in C specimens; however, at high PM contents, the siliceous and Fe-oxide coatings slow carbonation kinetics, tempering gains unless the A/P is tuned.
Materials and methods
Materials
Mercia mudstone from Nottingham (UK) was used as the aluminosilicate clay precursor. Sugarcane press mud (PM) was provided by Tate & Lyle (London, UK). Sodium silicate solution (H2Na2O4Si) with a molar ratio (SiO2/Na2O) of 3.37:1 was used as the alkaline activator. The solution was purchased from Chemiphase (Lancashire, UK) and comprised 29.4 wt.% SiO2, 9.0 wt.% Na2O, and 61.6 wt.% H2O, yielding a density of 1.41 g mL–1 and a viscosity of 70–120 mPa s. Deionized water was used throughout sample preparation and curing. A 5.5 g L–1 solution of Sigma-Aldrich (Gillingham, UK) sodium hexametaphosphate with 611.8 g mol–1 molecular weight was used for particle dispersion during particle-size analysis.
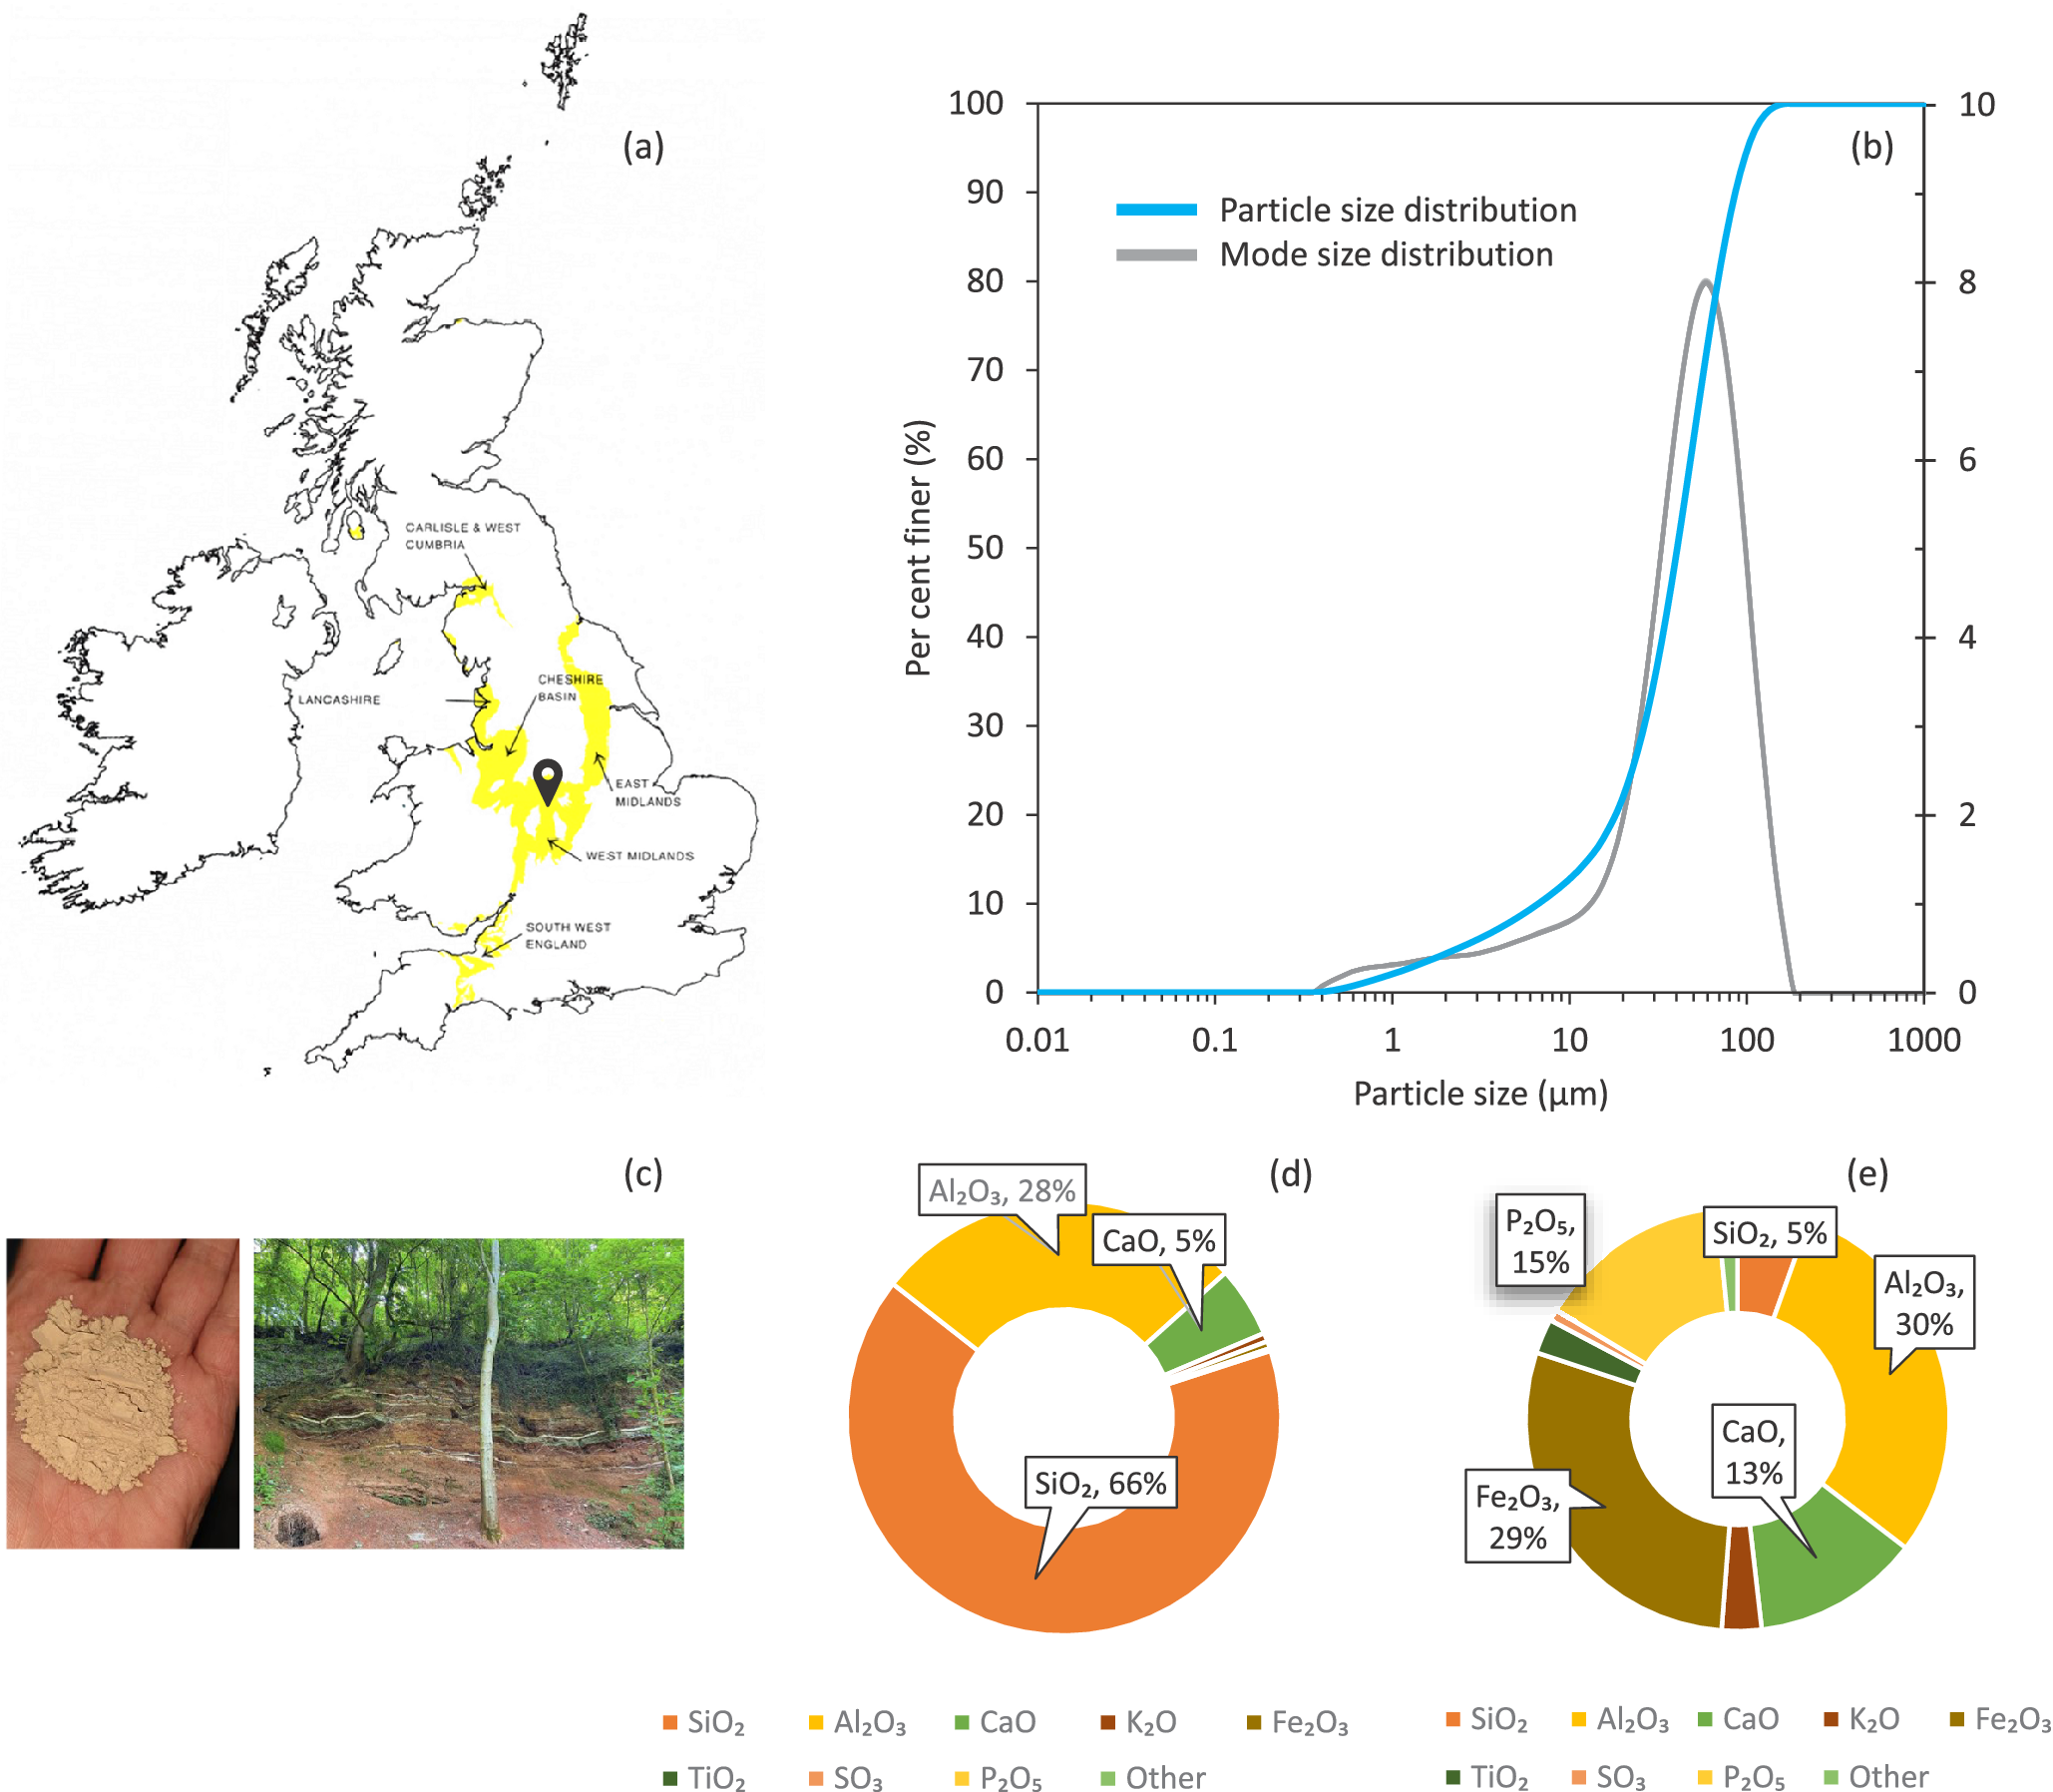
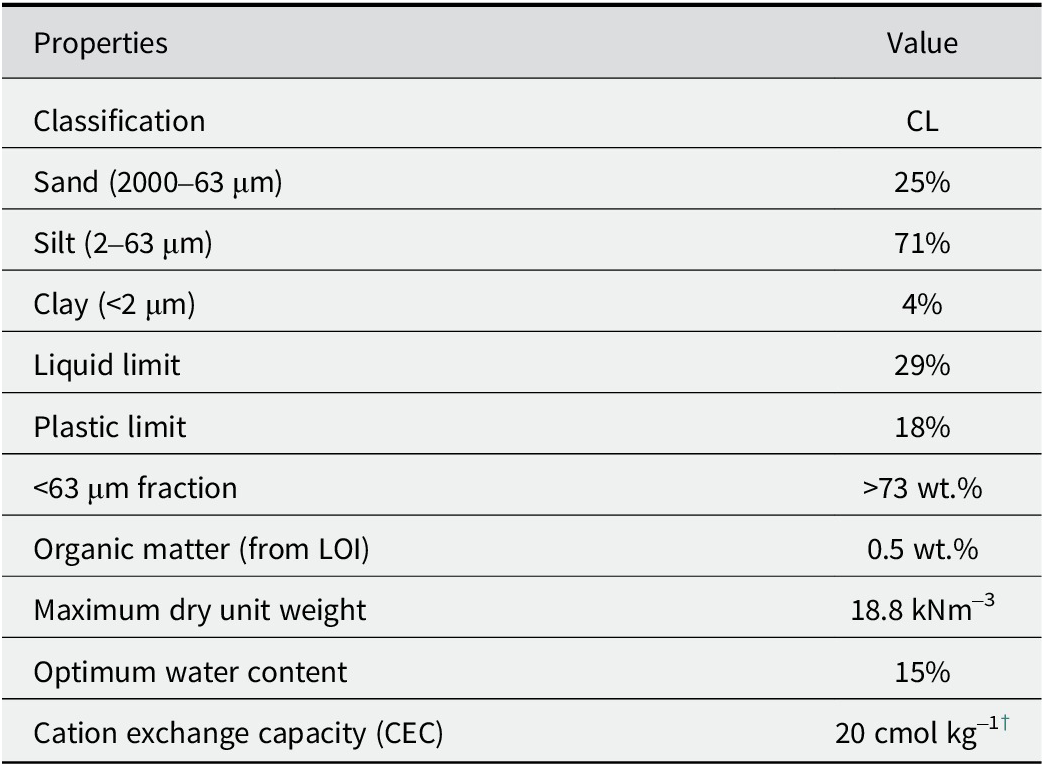
Samples of a Mercia mudstone were collected from a highly weathered, very closely fissured, friable exposure along the Trent riverbank near Clifton Manor (in Nottingham, UK) with co-ordinates E454032 N334910 (Fig. 1a,c). The collected samples were dried for 14 days in an alternating climate chamber (MKF 56, BINDER GmbH, Tuttlingen, Germany) prior to grinding. A low 40°C drying temperature was adopted to avoid oxidation, dehydration, or decomposition of organic matter and clay minerals (British Standard Institution, 2016). The dried soil was then sieved through a 2 mm sieve to remove large aggregates and root fragments, following standard practice for soil preparation (BS 1377-1:British Standards Institution, 2016). The sieved soil was crushed using a Retsch mortar mill RM100 prior to being passed through a 250 μm sieve and stored in sealed buckets. Organic content was determined as organic matter with a loss-on-ignition (LOI) procedure, using a Nabertherm (Germany) L 9/12 SW laboratory chamber furnace (Table 1). Particle-size distribution was determined using a laser-diffraction particle-size analyzer (Mastersizer 3000+, Malvern Panalytical Ltd, Malvern, UK) (Fig. 1b). Analysis was conducted on 5–7 g of solid sample pre-dispersed in 20 mL of a sodium hexametaphosphate (NaHMP) solution. Particle-size fractions were obtained as volume percentages and binned into sand (63–2000 μm), silt (2–63 μm), and clay (<2 μm) following the BS 5930 standard (British Standards Institution, 2015) size thresholds (Table 1). Atterberg limits were measured following BS 1377-2 standard (British Standards Institution, 2022) (Table 1) and used to classify the Mercia mudstone as a low-plasticity clay (CL) under the Unified Soil Classification System (USCS). The metal oxide percentages for the Mercia mudstone and the PM (Fig. 1c) used to produce the clay-PM mixtures were measured through chemical analysis by X-ray fluorescence (XRF) using a Zetium spectrometer (Malvern Panalytical, Eindhoven, Netherlands). Powdered samples were dried, homogenized and prepared as fused beads using lithium tetraborate flux (1:10 sample-to-flux ratio). The fusion method was adopted to minimize matrix effects and ensure complete dissolution of silicate minerals. Beads were analyzed under standard operating conditions recommended for major-oxide analysis (rhodium tube, 4 kW, fixed analytical crystals and collimators). The XRF results are reported for the Mercia mudstone (Fig. 1d) and for the PM (Fig. 1e).
(a) Geographical distribution of Mercia mudstone; (b) particle-size distribution of Mercia mudstone; (c) dried press mud residue, and outcrop at sampling site; (d) oxide composition of Mercia mudstone; and (e) oxide composition of PM.

Figure 1. Long description
Panel one at top left is a map of the United Kingdom with yellow regions marking Mercia mudstone outcrops, labeled as Carlisle and West Cumbria, Lancashire, Cheshire Basin, East Midlands, West Midlands, and South West England. A black location marker pinpoints the sampling site in the Cheshire Basin. Panel two at top right is a dual-axis line graph with x-axis labeled Particle size in micrometers (log scale from 0.01 to 1000) and y-axes labeled Percent finer (%) on the left (0 to 100) and an unlabeled right axis (0 to 10). The blue line represents particle size distribution, rising steeply between 1 and 100 micrometers, while the gray line for mode size distribution peaks near 10 micrometers and drops sharply. Panel three at bottom left contains two photos: left shows a hand holding dried press mud residue, right shows an outcrop at the sampling site with exposed reddish soil and green vegetation. Panel four at bottom center is a donut chart for Mercia mudstone oxide composition: S i O sub 2 at 66 percent, A l sub 2 O sub 3 at 28 percent, C a O at 5 percent, and minor fractions of K sub 2 O, F e sub 2 O sub 3, T i O sub 2, S O sub 3, P sub 2 O sub 5, and Other. Panel five at bottom right is a donut chart for press mud (P M) oxide composition: S i O sub 2 at 5 percent, A l sub 2 O sub 3 at 30 percent, C a O at 13 percent, F e sub 2 O sub 3 at 29 percent, P sub 2 O sub 5 at 15 percent, and minor fractions of K sub 2 O, T i O sub 2, S O sub 3, and Other. Color keys for each oxide are shown below the charts.
Physicochemical properties of the Mercia mudstone

Table 1. Long description
From the top row downward, the left column lists properties and the right column gives values. Classification is C L. Sand content, two thousand to sixty-three micrometers, is twenty-five percent. Silt, two to sixty-three micrometers, is seventy-one percent. Clay, less than two micrometers, is four percent. Liquid limit is twenty-nine percent. Plastic limit is eighteen percent. Less than sixty-three micrometer fraction is greater than seventy-three weight percent. Organic matter from L O I is zero point five weight percent. Maximum dry unit weight is eighteen point eight kilonewton per meter cubed. Optimum water content is fifteen percent. Cation exchange capacity, C E C, is twenty centimole per kilogram, with a footnote indicating it is from summation of exchangeable cations concentration obtained from X R F data.
† From summation of exchangeable cations concentration obtained from XRF data
Methods
Pre-weighed, air-dried samples of crushed and sieved Mercia mudstone, and PM (each with particle sizes <250 μm) were mixed and blended thoroughly with deionized water and alkali activator. The wet mix was compressed statically in eight sublayers in a 33 mm diameter, 72 mm long mold using a Harvard miniature compactor (Humboldt Mfg, Elgin, IL, USA). The void ratio was fixed at 0.5. Air-void content was fixed at 15% by maintaining a degree of saturation of 55%. The target void ratio was achieved by mixing pre-determined masses of solids and liquids corresponding to a fixed total specimen volume, equal to the internal volume of the Harvard miniature compactor mold. The total mass of solids was calculated from the known specific gravity of the solid constituents, and the added liquid mass was adjusted to satisfy both the target void ratio and the imposed degree of saturation. The selected void ratio represents a deliberately porous packing, consistent with the broader vision of stabilizing clay in a lightweight, permeable, and multi-functional earth-based composite, rather than a dense, cement-like material, to retain porosity for functions beyond load-bearing performance, including moisture regulation and reactive transport. The specimens were divided into two batches. The first batch (NC: non-carbonated) was sealed and cured at 18°C for 3, 7, and 21 days.
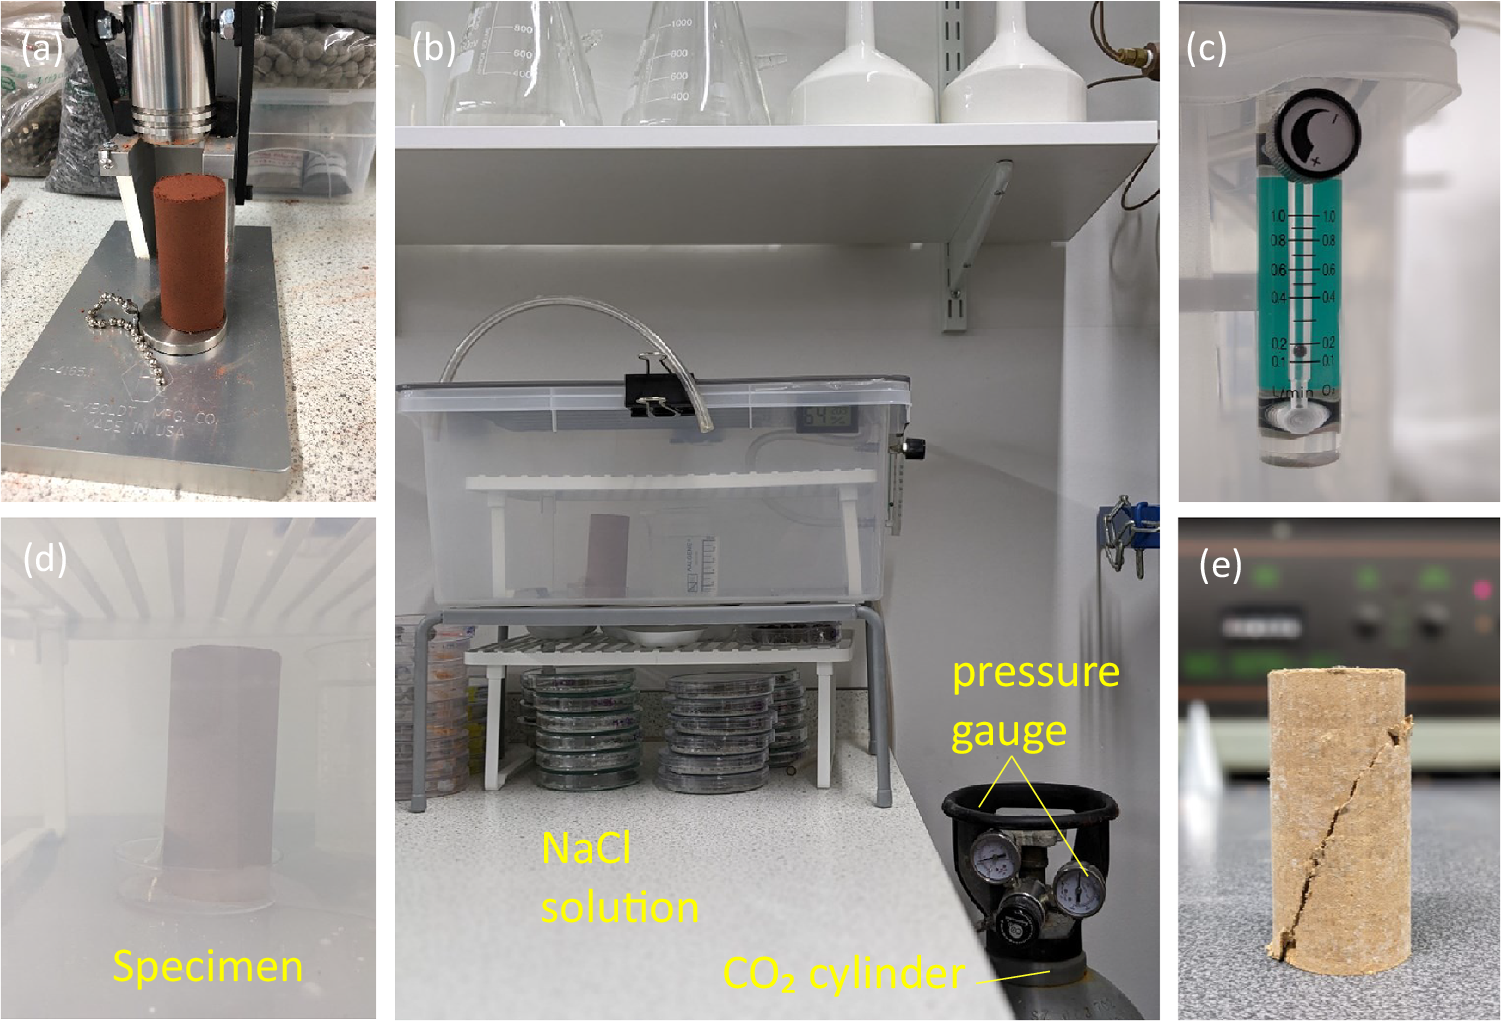
For the carbonated (C) curing conditions, specimens (Fig. 2a) were placed inside an in-house fabricated sealed polypropylene chamber (Fig. 2b) fitted with an intel valve connected to a laboratory CO2 cylinder and an analogue pressure gauge (±0.05 bar accuracy). The chamber was flushed with CO2 until the internal pressure reached 1.0 bar, verified using the built-in gauge (Fig. 2c). The gas exposure was applied intermittently by maintaining the chamber at 1 bar for 30 min every 12 h, after which the chamber was vented to atmospheric pressure. The ambient room conditions were retained at 64% relative humidity and 21 0.5°C.
(a) Specimen before shearing; (b) curing chamber; (c) internal pressure gauge; (d) specimen during curing; and (e) specimen after shearing.

Figure 2. Long description
Panel a at the top-left shows a cylindrical specimen mounted vertically on a metal base beneath a mechanical apparatus, with a chain visible on the left. Panel b at the top-center displays a laboratory curing chamber: a transparent plastic container with a curved tube on top, labeled Na C l solution inside, and a C O sub 2 cylinder with a pressure gauge below, surrounded by glassware and petri dishes. Panel c at the top-right presents a close-up of an internal pressure gauge with a blue scale marked from 0.0 to 1.0. Panel d at the bottom-left shows the specimen inside the curing chamber, partially obscured by condensation, labeled Specimen. Panel e at the bottom-right depicts the cylindrical specimen after shearing, with a visible diagonal fracture running through its body.
Following characterization, the specimens were subjected to unconfined compression under displacement control at a constant crosshead rate of 0.5 mm min–1, using a universal testing machine (Instron 68TM-50, Instron, Norwood, MA, USA). Axial stress (
$ q $
 ) was recorded at three normalized axial strains (
$ \unicode{x025B} /{\unicode{x025B}}_{\mathrm{p}} $
 ) of 0.2, 1.0, and 1.2, where
$ {\unicode{x025B}}_{\mathrm{p}} $
 is axial strain at peak stress. The normalized strains represent the elastic, peak, and post-peak states. Each test was conducted three times on identical specimens. A subset of sheared specimens was then air-dried for 21 days, split into halves and quarters, and cut into cubic specimens measuring 5 mm × 5 mm × 5 mm. The cubes were mounted on metal stubs using adhesive tabs for electron microscopy. An Agar auto carbon coater module (Agar Scientific Ltd, Stansted, Essex, UK) was used for coating. The specimens were coated with carbon at >0.1 mbar vacuum pressure in three passes, each lasting ~10 s. A JSM-6460LV SEM (JEOL Ltd, Japan) was used to image the microstructure. Mineralogical analysis was conducted using a MiniFlex diffractometer (Rigaku Corporation, Tokyo, Japan) equipped with CuKa radiation (λ=1.5406 Å, V=40 kV, A=15 mA). The diffraction angle was varied from 3 to 65°2θ (~29.4 Å to ~1.43 Å) at increments of 0.015° and a scan rate of 2° min–1, with the sample holders spinning at 10 rpm. The Soller slits angle, divergence slit angle, and the intensity-hue-saturation (IHS) settings were 2.5°, 0.625°, and 10 mm, respectively. DRIFTS was performed using a Bruker Vertex 70 apparatus, covering the range 400–4000 cm–1 and averaging 16 scans. The data of Wang et al. (Reference Wang, Tang, Chen, Zhan, Li and Tang2009) and of Katti and Katti (Reference Katti and Katti2006) were used as reference for analysis.
To derive quantitative water-budgeting data, chilled-mirror dew point measurements were performed on three representative clay-PM mixtures, prior to compression testing, to quantify early-age water partitioning: (a) PM=10 wt.%, A/P=0.22, NC-cured, 7 days; (b) PM=25 wt.%, A/P=0.22, NC-cured, 7 days; (c) PM=45 wt.%, A/P=0.22, NC-cured, 7 days. About 5–10 g fragments of cured specimens were retrieved, equilibrated at 20°C for 24 h in a Binder (Germany) MKF 56 climate chamber, and tested using a WP4C Dewpoint Potentiometer (Meter Group, Pullman, Washington, USA). The instrument measures dew point temperature and relative humidity, from which total suction was inferred thermodynamically using the Kelvin equation. Each specimen was tested at its as-cured water content, yielding a single equilibrium total suction value per mixture. Gravimetric water content was determined independently by oven drying specimens at 105°C for 24 h. A furnace-based thermal decomposition (two-point LOI) method was used as a semi-quantitative means to estimate the carbonate content of selected specimens (PM=10.45%). Because press mud contains inherent carbonate phases, matched NC-cured specimens were tested alongside C-cured specimens, and baseline-corrected CaCO₃ contents (C minus NC) were used to quantify carbonate formed during CO₂ curing. Samples were heated sequentially to remove free water, adsorbed and interlayer water, organic matter, and bound water in the C-S-H and N-A-S-H phases, followed by decarbonation of CaCO3. A ceramic crucible was heated to 105°C in the furnace and allowed to cool to room temperature. About 15 g of each specimen was crushed to <75 μm, dried at room temperature, and placed in the ceramic crucible. Samples were heated from room temperature to 105°C and held for 1 h to remove free water. The temperature was subsequently raised to 600°C at 2°C min⁻¹ and held for 2 h to remove organics, adsorbed and interlayer water, and structural OH from kaolinite, C-S-H and N-A-S-H. The mass at this stage was recorded as pre-carbonation mass, m 600. Heating was continued to 900°C at 10°C min⁻¹, at which point decarbonation was allowed to take place over a 2 h holding time. The post-decarbonation mass was recorded as m 900. Eqn (3) presents the mass loss associated with CO2 release:

Given that CO2 constitutes ~44% of the molecular weight of CaCO3 (44 g mol⁻¹/100 g mol⁻¹), each gram of released CO2 corresponds to 2.27 g of CaCO3. The calcium carbonate content can be expressed as in Eqn (4):

Eqn (5) presents the baseline-corrected or net calcium carbonate formed during intermittent CO₂ curing (C minus NC controls):

Results
Characterization of Mercia mudstone
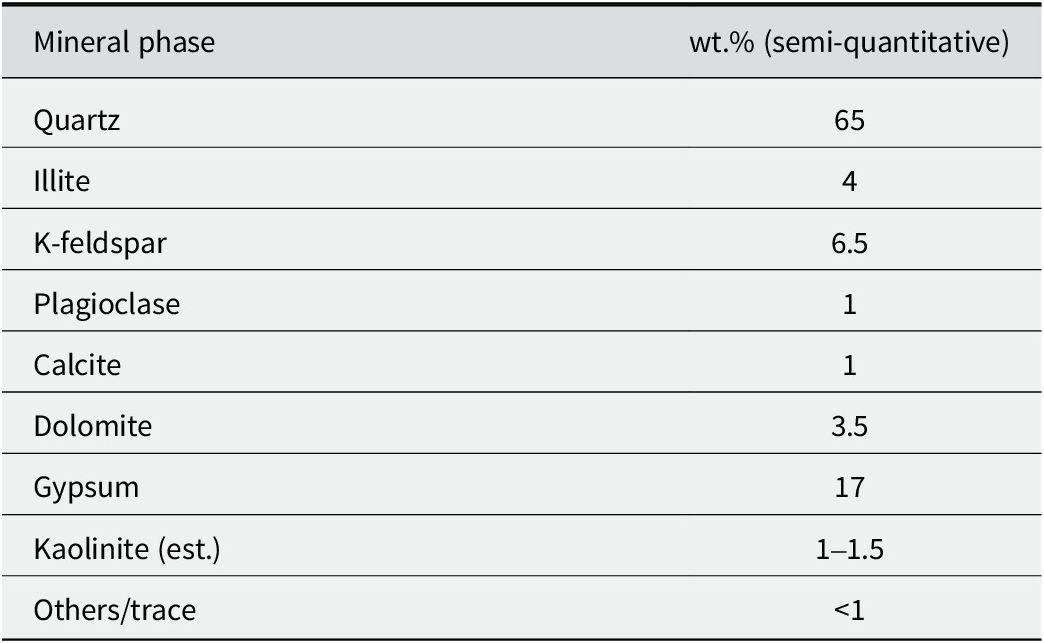
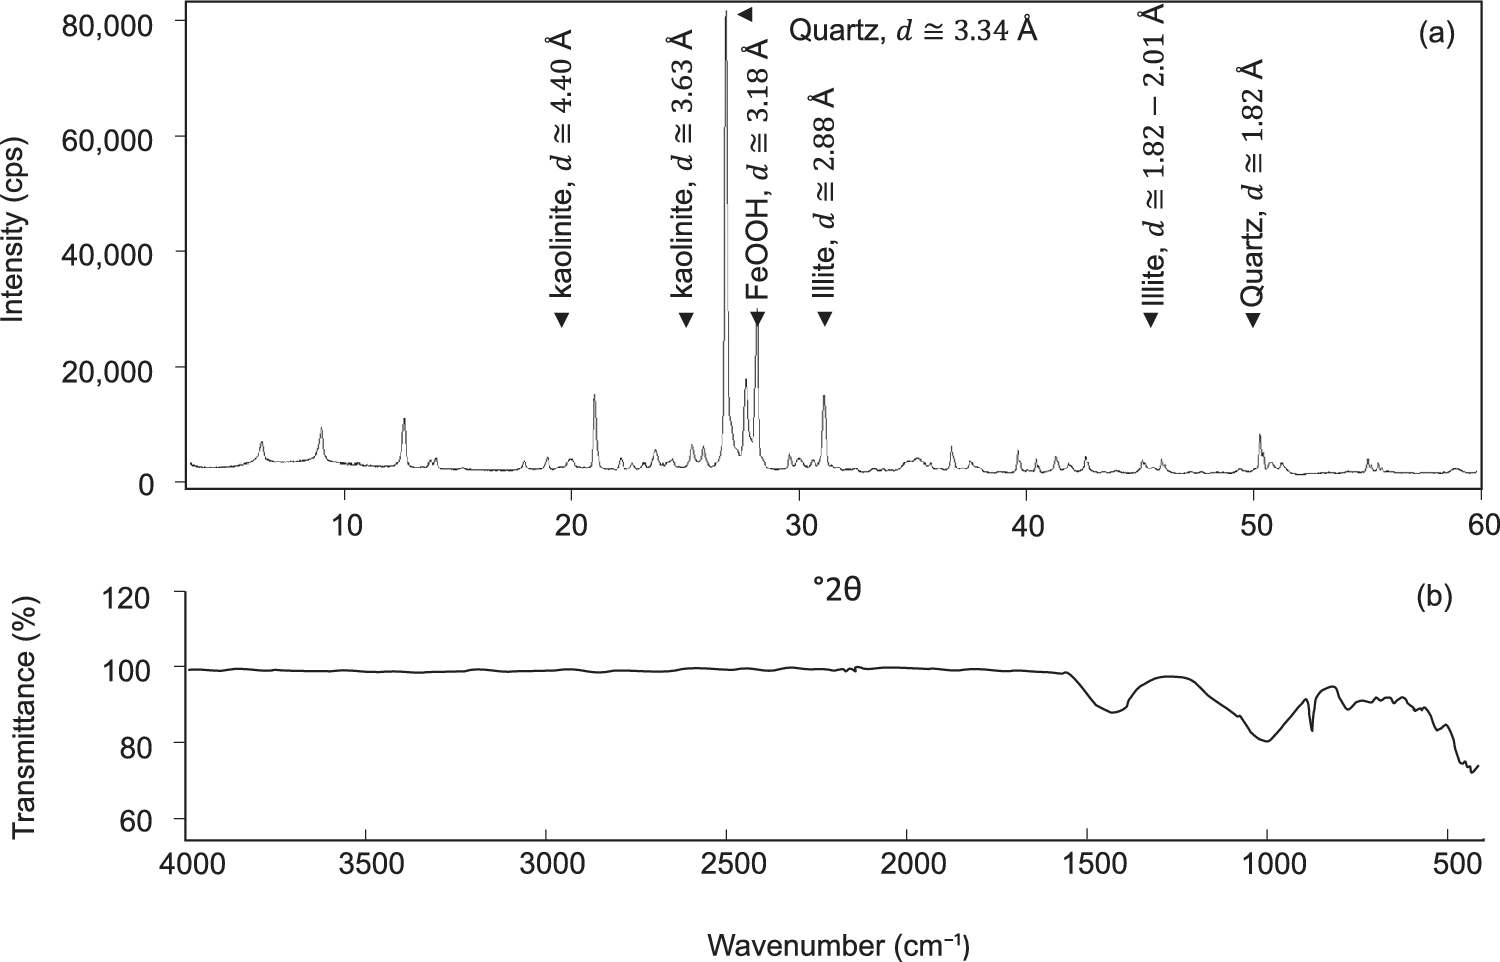
The geographical distribution and physicochemical properties of the Mercia mudstone are illustrated in Fig. 1. The mineralogical composition was determined by Rietveld full-pattern refinement using PDF-4+ reference structures. Because no internal standard was added, the mineral percentages represent semi-quantitative estimates (Table 2). Kaolinite (001) peaks commonly overlap with chlorite (002). Differential heating (e.g. 550°C collapse of kaolinite 001) was not performed because the XRD analyses were conducted on whole-rock powders rather than clay-separated fractions. In the FTIR spectra (Fig. 3b), the characteristic OH-stretching bands of kaolinite (3695–3620 cm⁻¹) are weak, which is expected because kaolinite occurs only as a minor phase (<2 wt.%) and its OH signatures are readily masked by the dominant quartz background, gypsum hydration water, and broad OH/H₂O absorptions associated with iron oxides. Instead, kaolinite identification was supported by its diagnostic OH and Al-O bands in the IR spectra (Fig. 3b), which distinguish it unambiguously from chlorite. In the IR spectra (Fig. 3b), the increase in absorbance from 874 cm–1 to 912–904 cm–1 corresponds to Al–O stretching in kaolinite’s octahedral sheet. A steady increase over the 1090–1030 cm–1 range reflects Si–O stretching in the tetrahedral sheet. Signatures suggested that the XRD peaks at 12.5° (d=7.08 Å), 20.2° (d=4.39 Å), and 24.4°2θ (d=3.64 Å) are probably associated with kaolinite (001), which make up 1–1.5% of the whole-rock minerals. Peaks associated with illite and goethite are marked (Fig. 3). A pH of 9.1 in deionized water indicates alkalinity, probably due to the presence of illite as the secondary clay mineral (Konan et al., Reference Konan, Peyratout, Bonnet, Smith, Jacquet, Magnoux and Ayrault2007).
Semi-quantitative mineralogical composition (wt.%) of the Mercia mudstone

Table 2. Long description
The table has two columns. The left column lists mineral phases, the right column gives their semi-quantitative weight percent. From top to bottom, the mineral phases and their values are Quartz 65, Illite 4, K-feldspar 6.5, Plagioclase 1, Calcite 1, Dolomite 3.5, Gypsum 17, Kaolinite estimated 1 to 1.5, Others or trace less than 1.
(a) XRD pattern; and (b) IR spectrum of the Mercia mudstone.

Figure 3. Long description
The top panel is an X R D line graph with x axis labeled 2 theta from 0 to 60 and y axis labeled intensity in counts per second from 0 to 80,000. Major peaks are annotated: kaolinite at d approximately 4.40 angstroms and 3.63 angstroms, Fe O O H at d approximately 2.88 angstroms, illite at d approximately 2.88 angstroms and 1.82 to 2.01 angstroms, and quartz at d approximately 3.34 angstroms and 1.82 angstroms. Peaks are sharp and most intense near 2 theta equals 26. The bottom panel is an I R spectrum with x axis labeled wavenumber in centimeters to the minus one from 4000 to 400 and y axis labeled transmittance percent from 60 to 120. The transmittance curve is mostly flat near 100 percent from 4000 to 2000, then shows broad absorption bands and several troughs between 2000 and 400, indicating functional groups in the mudstone.
Characterization of press mud
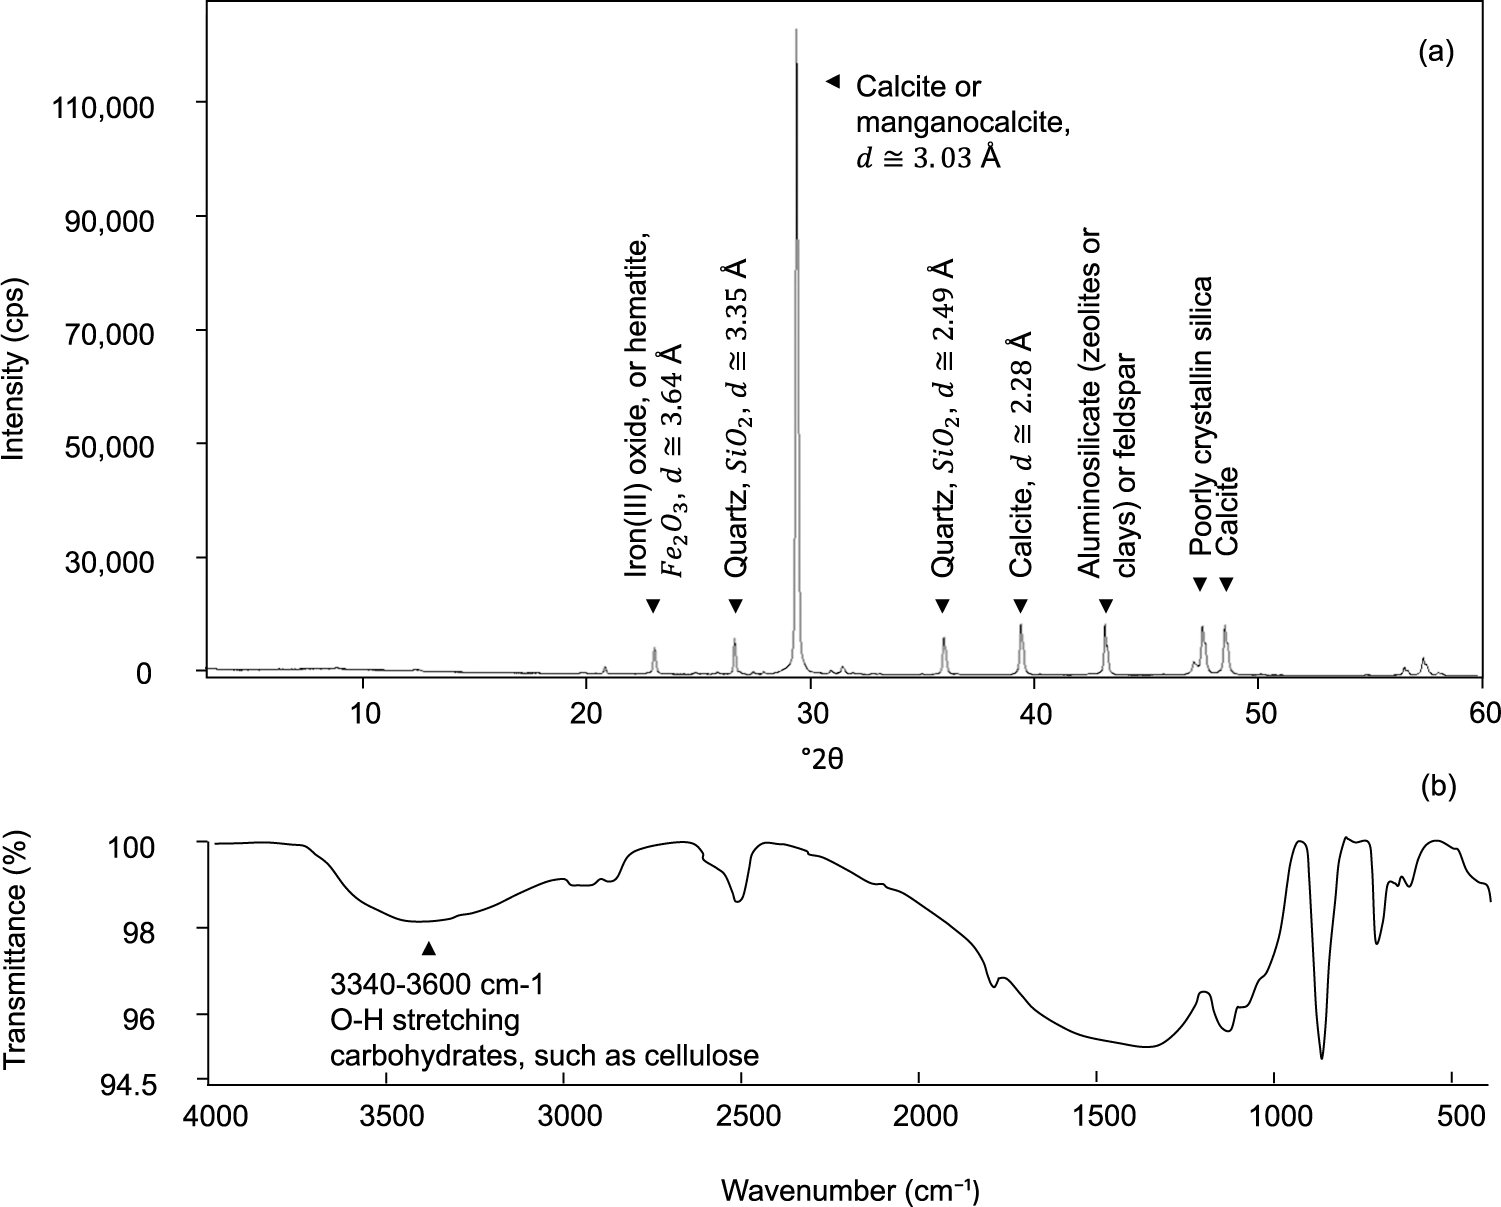
The PM was slightly alkaline (pH 8.3), moderately organic (OM 18.3%), fine grained, with a median particle size of 7 μm, and rich in aluminum and ferric oxide (Fig. 1e). Measurement of the mineralogical compositions (Fig. 4a) suggested that the major constituents of the PM included calcite, calcium oxide, iron(III) oxides, and aluminosilicates. The IR spectrum (Fig. 4b) displays a broad dip at 3640 cm–1, characteristic of O–H stretching vibrations of hydroxyl groups from carbohydrates such as cellulose and hemicellulose.
(a) XRD pattern; and (b) IR spectrum of the press mud.

Figure 4. Long description
The top panel is an X R D line graph with x-axis labeled two theta from 0 to 60 degrees and y-axis labeled intensity in counts per second from 0 to 120,000. Peaks are marked at specific two theta values with annotations: Iron three oxide or hematite at d approximately 3.64 angstroms, Quartz S i O sub 2 at d approximately 3.35 angstroms, Calcite or manganocalcite at d approximately 3.03 angstroms, Quartz S i O sub 2 at d approximately 2.49 angstroms, Calcite at d approximately 2.28 angstroms, Aluminosilicate (zeolites or clays or feldspar), Poorly crystalline silica, and Calcite. The bottom panel is an I R spectrum with x-axis labeled wavenumber in centimeters to the minus one from 4000 to 500 and y-axis labeled transmittance percent from 94.5 to 100. A broad band is annotated at 3340 to 3600 centimeters to the minus one as O-H stretching for carbohydrates such as cellulose. The spectrum shows several absorption bands, with the most prominent features in the high wavenumber region and multiple peaks below 1500 centimeters to the minus one.
Characterization of clay-PM mixtures
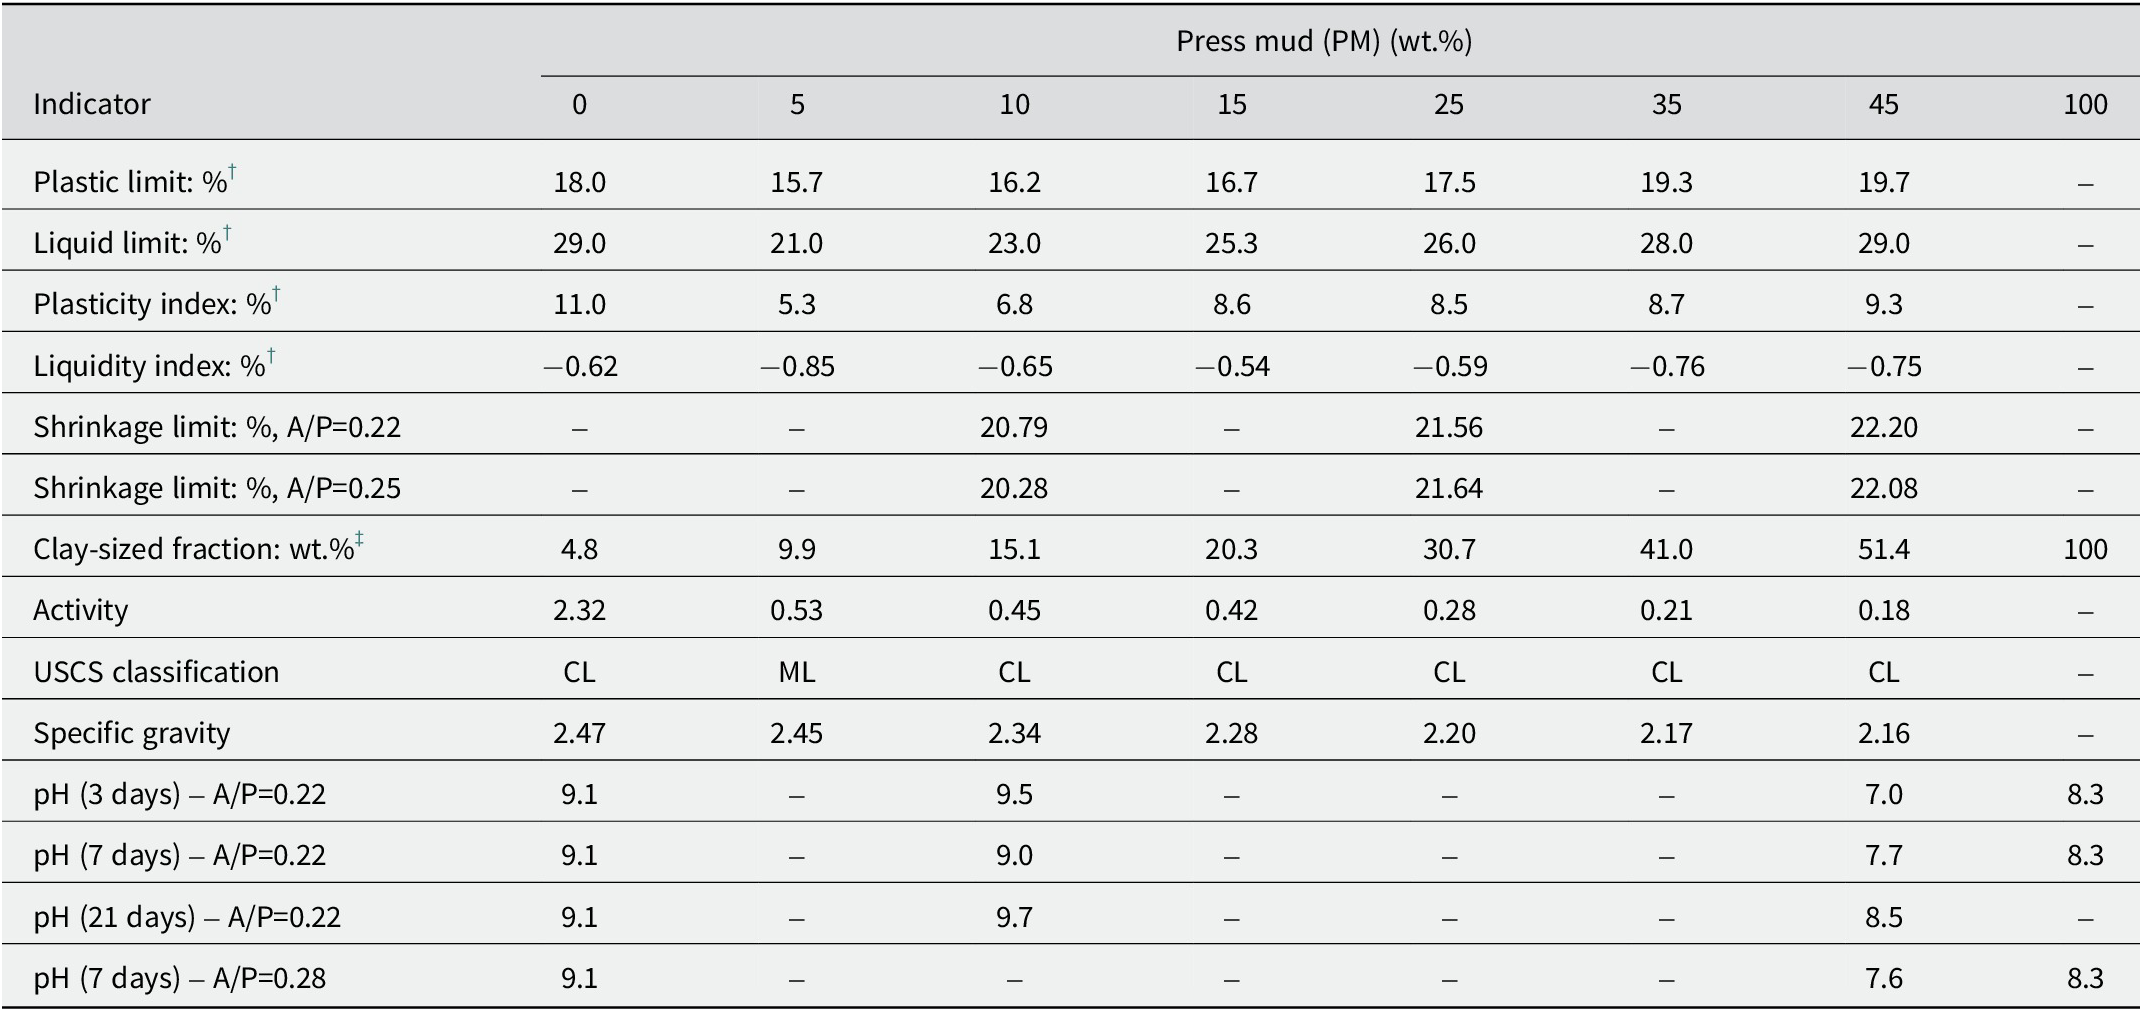
The clay and press mud were varied from 100 to 55% and from 0 to 45%, respectively, in 5–10% increments. The A/P mass ratio ranged from 0.22 to 0.28. For all clay-PM mixtures, particle-size distribution was determined by laser diffraction. The clay-sized fraction reported in Table 3 corresponds to <2 μm (wt.%) particles. Following the addition of press mud (PM) the clay-PM mixtures were no longer natural soils, and their behavior was governed primarily by changes in Atterberg limits rather than particle-size texture. Therefore, the engineering USCS classification was used in Table 3 to track the plasticity-based changes induced by treatment. The plastic and liquid limits initially decreased with the addition of PM, reaching a minimum at 5% PM before increasing again for greater contents (Table 3). The classification briefly shifted from CL (clay with low-plasticity) to ML (silt with low-plasticity) at 5% PM, indicating transient silt-like behavior, before reverting to CL. Liquidity index values remained negative throughout, implying stiff consistency. The shrinkage limit increased with PM content, suggesting reduced volumetric shrinkage potential. Activity decreased markedly with increasing PM content, reflecting a significant reduction in swell potential. Specific gravity decreased with PM content. At modest PM contents, the pH remained stable between 9.0 and 9.7, but a reduction occurred for greater contents.
Physicochemical properties of clay-PM mixtures

Table 3. Long description
The table consists of 14 rows for indicators and 9 columns for press mud percentages, ordered left to right as 0, 5, 10, 15, 25, 35, 45, and 100. For each indicator, values are listed horizontally. Plastic limit decreases from 18.0 at 0 percent to 15.7 at 5 percent, then rises to 19.7 at 45 percent, with no value at 100 percent. Liquid limit drops from 29.0 at 0 percent to 21.0 at 5 percent, then increases to 29.0 at 45 percent, absent at 100 percent. Plasticity index falls from 11.0 at 0 percent to 5.3 at 5 percent, then rises to 9.3 at 45 percent, with no value at 100 percent. Liquidity index ranges from negative 0.62 to negative 0.85, with missing values at 100 percent. Shrinkage limit is only reported at 10, 25, and 45 percent, increasing from 20.28 to 22.20 as A over P increases from 0.22 to 0.25. Clay-sized fraction increases steadily from 4.8 at 0 percent to 51.4 at 45 percent, reaching 100 at 100 percent. Activity decreases from 2.32 at 0 percent to 0.18 at 45 percent. U S C S classification alternates between C L and M L, with most values as C L. Specific gravity decreases from 2.47 at 0 percent to 2.16 at 45 percent. pH values are reported for several time points and A over P ratios, with values generally decreasing as press mud increases, ranging from 9.1 at 0 percent to 7.0 at 45 percent for 3 days, A over P equals 0.22. Several cells are marked with a dash, indicating missing data. Footnotes clarify that some indicators are not activated and that clay-sized fraction refers to particles less than 2 micrometers by laser diffraction.
† Not-activated;
‡ clay-sized fraction refers to particles <2 μm in diameter, determined by laser diffraction (wt.%).
IR spectroscopy
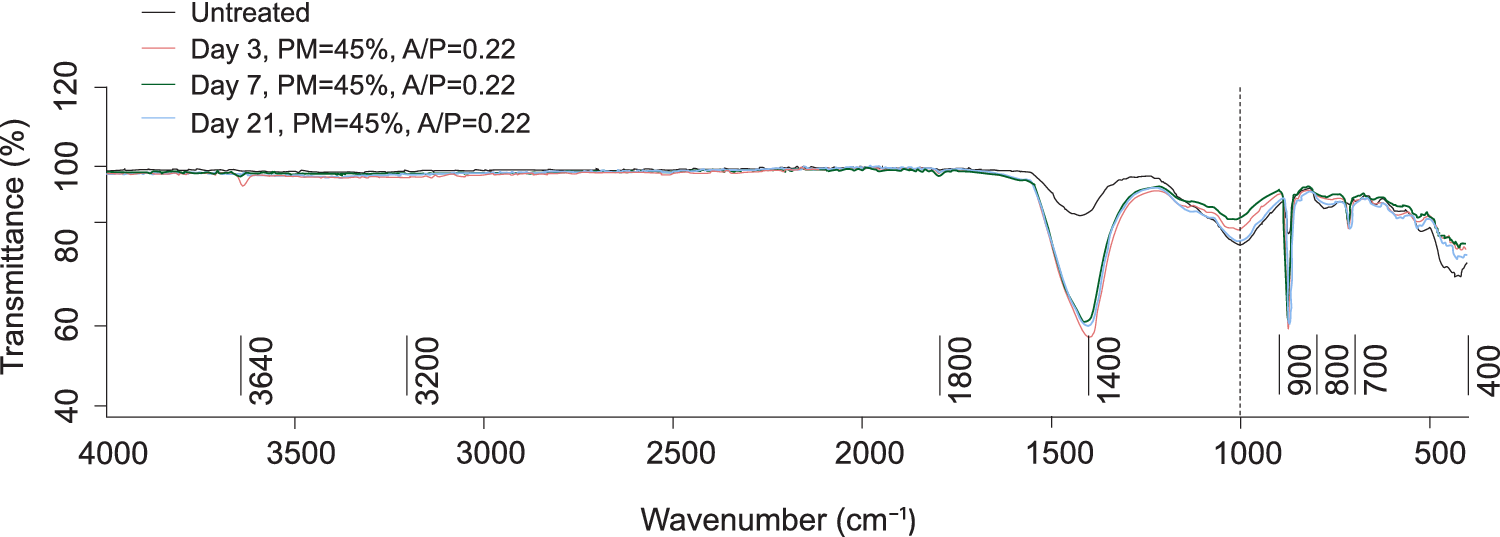
Infrared spectroscopy offers a rapid and non-destructive means of identifying and characterizing soil constituents, with established methods for interpreting spectral features associated with mineral and organic functional groups (Margenot et al., Reference Margenot, Calderón, Goyne, Dmukome and Parikh2016). In the IR spectra for clay treated with 45% PM (Fig. 5), the wavenumber 3640 cm–1 is associated with O–H stretching with a reduction at day 3, which disappeared by day 7. This reduction represents precipitation of portlandite, (Ca(OH)2) from CaO hydration and aligns with the increase in pH of soil solution from 9.1 to 9.5 (Table 3). The subtle decrease in transmittance between 1500 and 2000 cm–1 indicates the protonation of oxides. Here, the decrease reflects the precipitation of goethite (α-FeOOH). Crystallization began by day 3 and became more pronounced from day 7 onwards. The spectra are broader at the same wavenumber for clay treated with 10% PM (Fig. 6). The precipitation of goethite resulted in a number of consequences: at the morphological level, the formation of flaky goethite plates on clay surfaces induced roughness and potentially some degree of interlocking. At high PM contents, goethite also precipitated on Ca(OH)₂ particles, obstructing CO₂ access and delaying carbonation.
IR spectrum for Mercia mudstone treated with PM and activator after 3, 7, and 21 days. A/P = activator to press mud ratio.

Figure 5. Long description
The line graph plots transmittance percentage on the y axis from 40 to 120 against wavenumber in inverse centimeters on the x axis from 4000 to 400. Four lines are shown: black for untreated, red for day 3 with P M 45 percent and A forward slash P 0.22, green for day 7 with the same treatment, and blue for day 21 with the same treatment. All lines follow a similar pattern, remaining near 100 percent transmittance from 4000 to about 1500, then showing sharp troughs at approximately 1400 and 1000, with minor variations between treated and untreated samples. The treated samples show slightly deeper troughs near 1400 and 1000 compared to the untreated. Wavenumber labels are marked at 3640, 3200, 1800, 1400, 900, 800, 700, and 400.
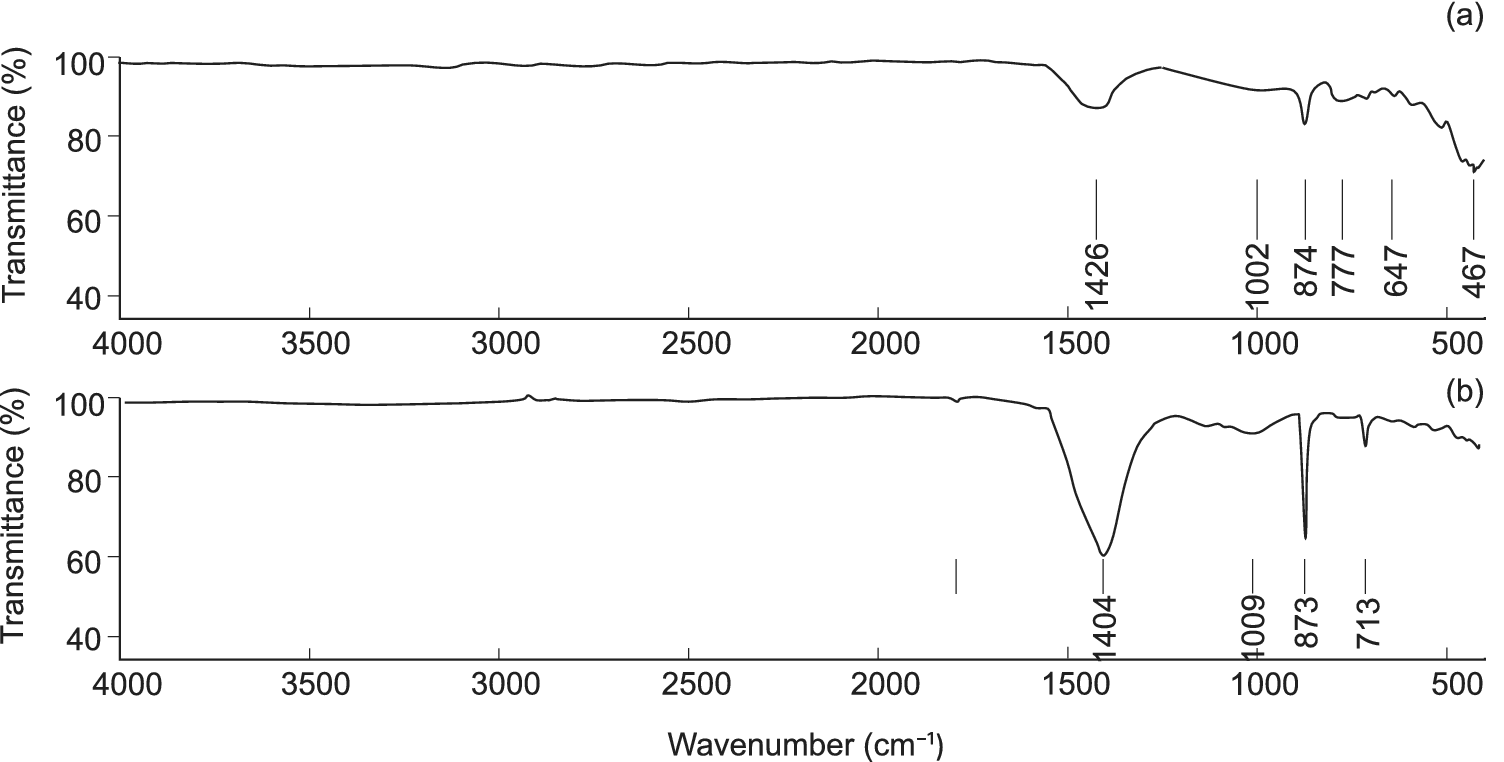
IR spectra for Mercia mudstone treated with PM and activator after 7 days: (a) PM=10%; (b) PM=45%.

Figure 6. Long description
The top panel, labeled a, shows transmittance percent versus wavenumber from 4000 to 400 centimeter to the minus one. The spectrum is mostly flat above 80 percent transmittance until about 1500, where a broad dip occurs at 1426. Multiple sharper dips appear at 1002, 874, 777, 647, and 467. The bottom panel, labeled b, follows the same axes. The spectrum is flat above 80 percent until a broad dip at 1404, then sharper dips at 1009, 873, and 713. The labeled peaks are marked with vertical lines and numbers. The main difference between panels is the shift and intensity of the peaks, especially near 1400 and 1000.
The broad stretching band in the 3200–3500 cm–1 range on day 7 indicates further hydration of Ca(OH)2 to the hexaaquacalcium(II) ion,
$ {\left[\mathrm{Ca}{\left({\mathrm{H}}_2\mathrm{O}\right)}_6\right]}^{2+} $
 . The dip at 712.7 cm–1 reflects carbonyl C=O bending of the
$ \mathrm{C}{\mathrm{O}}_3^{2-} $
 group. The dip appeared with nearly equal intensity across all curing durations. This bending vibration occurred from reactions between sucrose C12H22O11 in the PM and Ca2+ derived from the hexaaquacalcium(II) phases.
The formation of
$ {\left[\mathrm{Ca}{\left({\mathrm{H}}_2\mathrm{O}\right)}_6\right]}^{2+} $
 coincided with the decrease in the pH of the soil solution by day 7. Nevertheless, the solution remained sufficiently alkaline to promote deprotonation of the clay (Eqn (6)) and release of silicate and aluminate phases:

Deprotonation was a prelude to the formation of polymeric and pozzolanic phases.
The medium-intensity dip at 467 cm–1 (Fig. 5) represents zeolite/geopolymer phases. The feature became more visible after day 7 and was mainly associated with Si-O-Al bending in the sodium aluminosilicate network. This network subsequently bonded with charge-balancing Na+ ions (Eqn (7)), forming a sodium aluminosilicate geopolymer:

At higher PM (and thus more organic) contents, pore water became less available. The implications were evident in a sharper 467 cm–1 dip at day 7 (Fig. 6a) for clay with a much smaller PM content.
A peak at 11°2θ (d≈8.03 Å) (PM=25%, A/P=0.22, 21 days, NC) in the XRD pattern was registered as being characteristic of a zeolite. In the present context, the phase corresponds to a secondary N-A-S-H (sodium aluminum silicate hydrate) phase produced through reactions between sodium and deprotonated clay. The large surface area of this phase gave it a strong hydrophilic character. A second peak of interest at 29°2θ (d≈3.07 Å) (PM=25%, A/P=0.22, 21 days, NC) on the XRD pattern, albeit non-definitive, is generally associated with calcium silicate hydrates (C-S-H) and a product of hexaaquacalcium(II) ions adsorbing onto deprotonated clay sites:

The broad hump observed at 29°2θ (d≈3.07 Å) reflects the poorly crystalline nature of the phase. Observations should be interpreted in conjunction with the IR spectra. In Figs 5 and 6, the broad dip at 1000–1015 cm–1 is indicative of Si–O stretching in calcium silicate/aluminate hydrates. The dip appeared broadened due to the overlap with the clay’s Si-O baseline and was more pronounced in clay with a greater (i.e. 45%) PM content.
The dip at 870–874 cm–1 (Fig. 5) is associated with aragonite and is an indication of carbonation. Transmittance in this region should not be compared across curing time because samples were air-dried equally and therefore exposed to atmospheric CO2 prior to FTIR testing. The dip is more pronounced for clay containing 45% PM than for 10% PM (Fig. 6), consistent with increased Ca2+ availability.
Lewis-HSAB pathway model
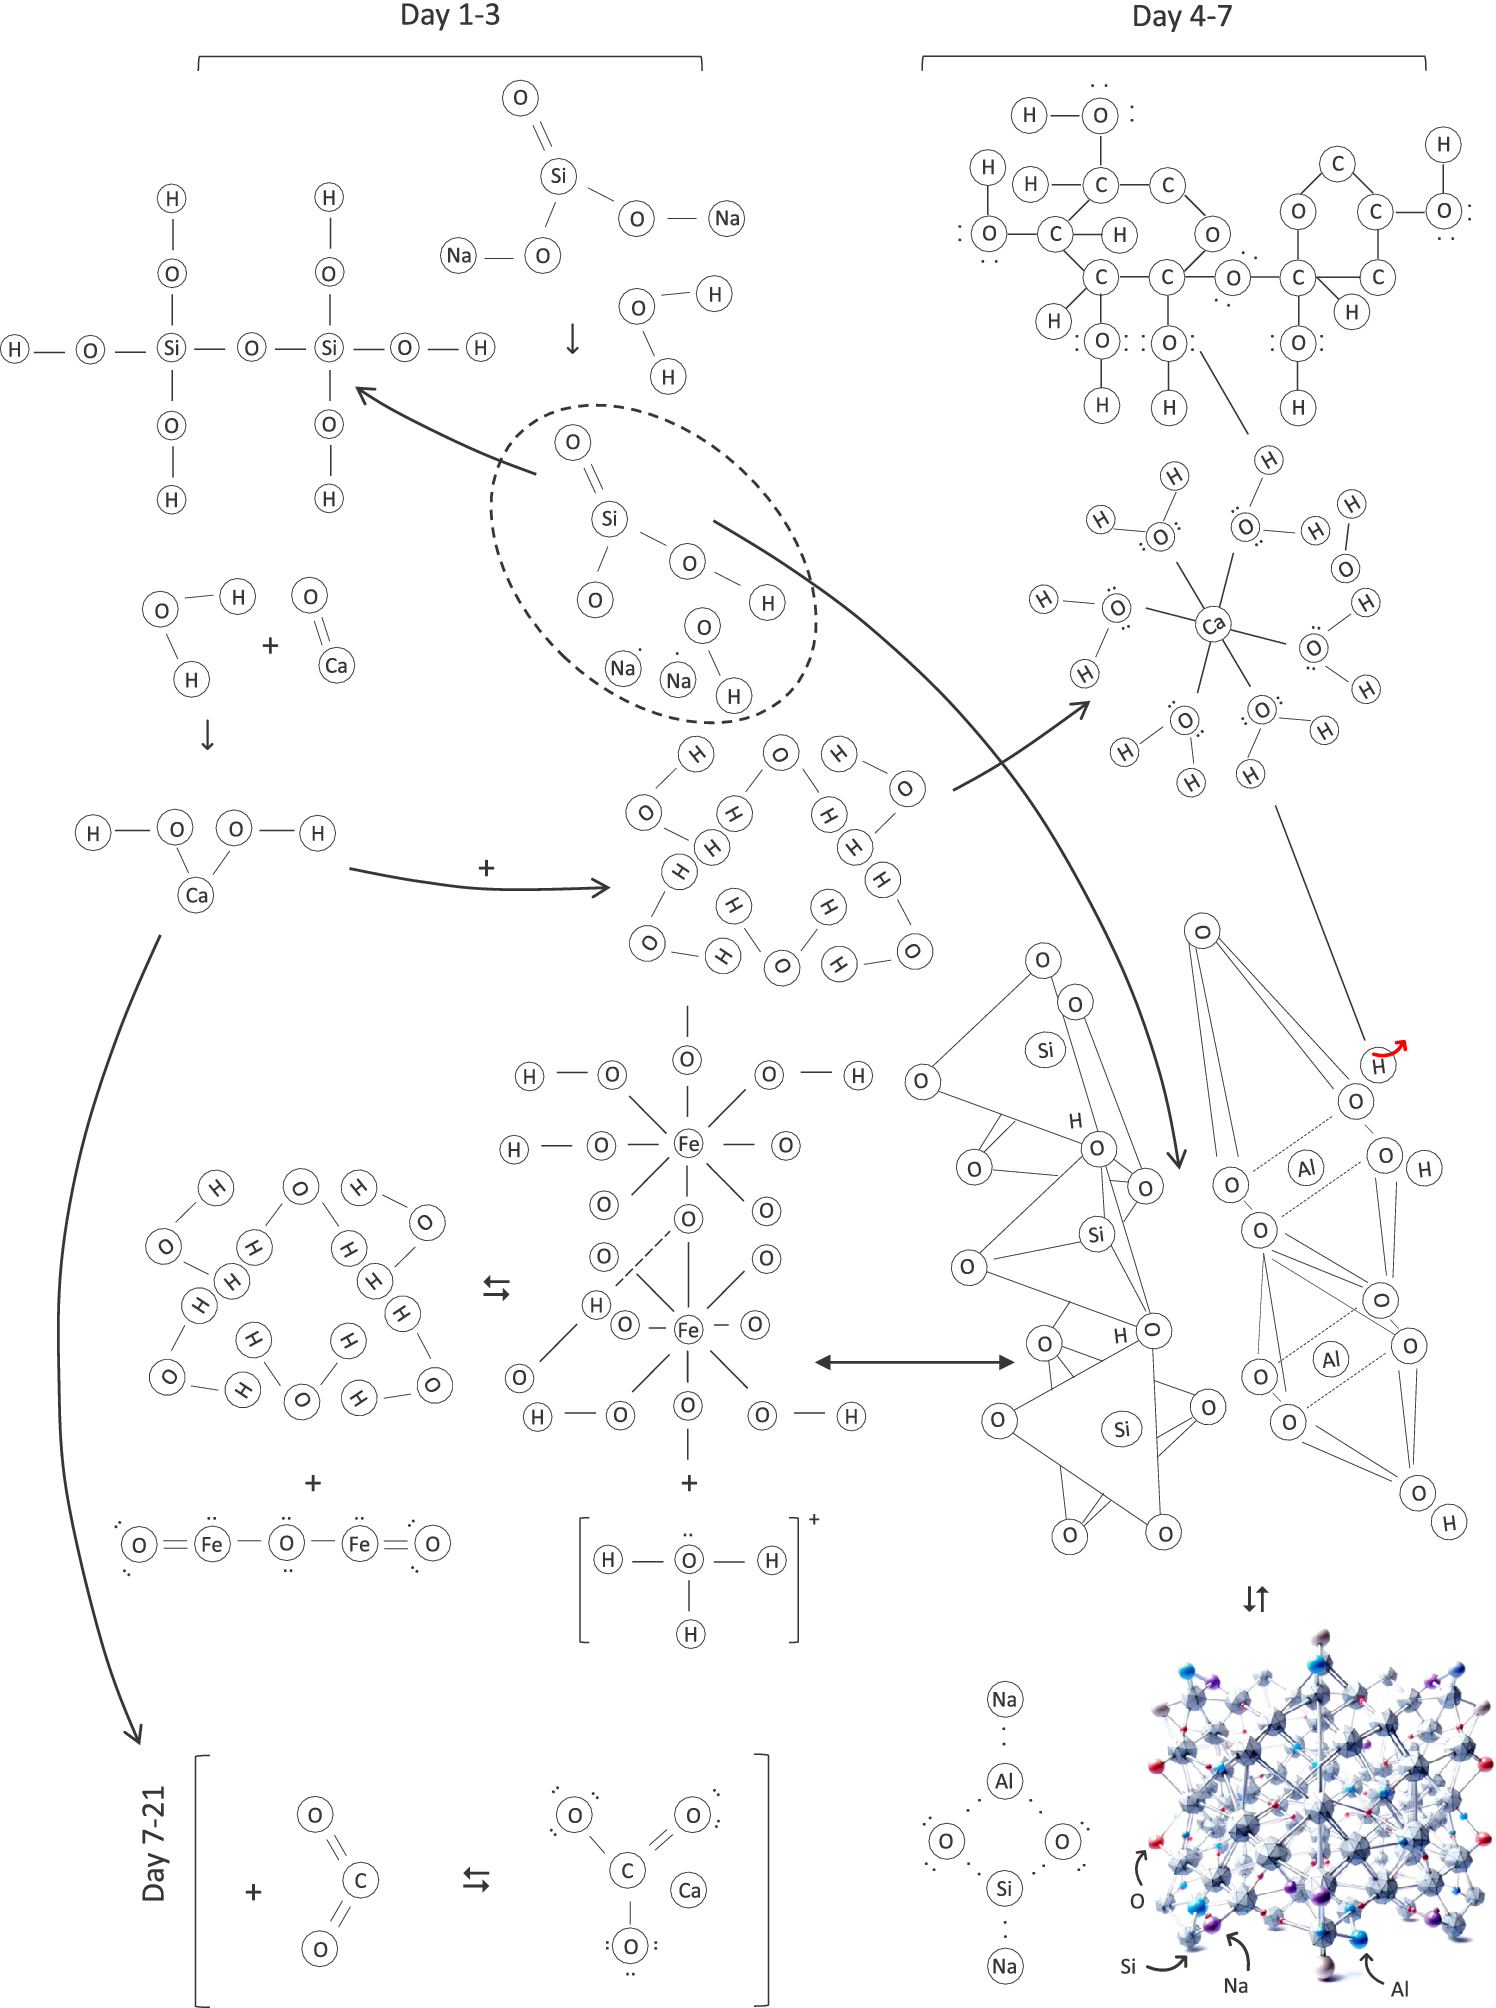
A phenomenological reaction-pathway model constructed by aligning time-sliced FTIR and XRD datasets is shown in Fig. 7. Interactions were interpreted through a Lewis–hard-soft-acid-base (Lewis/HSAB) lens, where multivalent cations act as Lewis acids and deprotonated silicate/aluminate or carbonate species act as Lewis bases. Each observation from the IR-XRD datasets was encoded as an evidence token and mapped to mechanistic primitives such as dissolution, precipitation, polymerization, or gelation. Interactions were interpreted with a Lewis/HSAB lens. In Pearson’s HSAB scheme, acids are electron-pair acceptors and bases are donors; hard species are small, highly charged, and weakly polarizable, whereas soft species are more polarizable. In the alkaline aluminosilicate system examined here, the dominant reactive species were predominantly hard, including Ca²⁺ (and locally Al³⁺ and Fe³⁺) acting as hard Lewis acids, and oxygen-donor ligands in deprotonated silicate/aluminate frameworks, hydroxide, and carbonate. Unlike thermodynamic/speciation or microstructure-evolution models, the model does not predict phase quantities; instead, it compiles tested hypotheses about sequence and causality.
Reaction-pathway model.

Figure 7. Long description
The flowchart is divided into three sections: Day 1-3 at the top left, Day 4-7 at the top right, and Day 7-21 at the bottom left. In Day 1-3, linear and branched silicate and sodium silicate molecules are shown, with arrows indicating reactions involving calcium and water. A dashed oval highlights a cluster containing Si, Na, and O. Arrows lead to ring and cage-like structures, including iron complexes. Day 4-7 features larger, more interconnected silicate and aluminosilicate frameworks, with Al and Si atoms linked by O and H. Arrows show further condensation and network formation. Day 7-21 at the bottom left displays the final products: carbonate, calcium, and iron complexes, and a 3D atomic lattice labeled with Si, Na, Al, and O at the bottom right. All chemical bonds and atom labels are depicted explicitly, with reaction pathways mapped by arrows.
Stress-strain response
A program of unconfined compression strength testing was conducted to measure the mechanical responses of clay-PM mixtures (Fig. 8). The data are given in Table S1 of the Supplementary material.
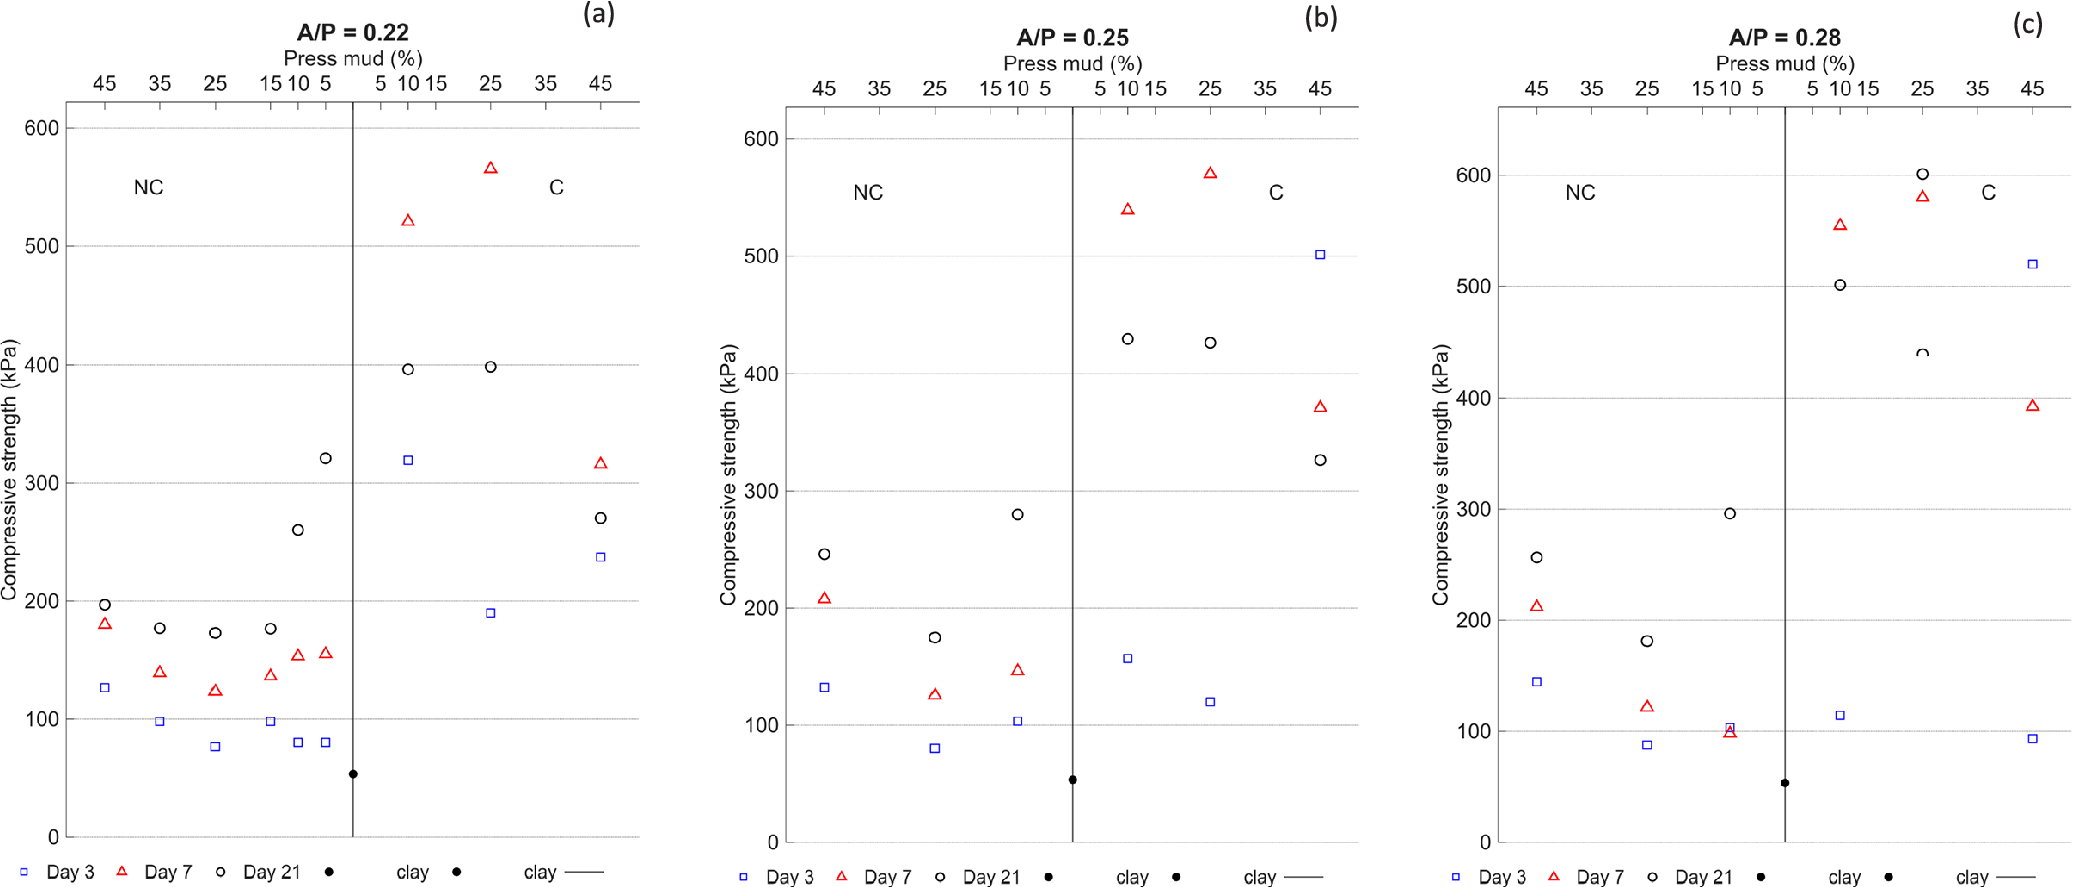
Stress-strain response: (a) A/P=0.22; (b) A/P=0.25; (c) A/P=0.28.

Figure 8. Long description
From left to right, panels are labeled a, b, and c. Each panel has compressive strength in k P a on the y-axis from 0 to 600 and press mud percentage on the x-axis from 5 to 45. Panel a shows A forward slash P equals 0.22, panel b shows A forward slash P equals 0.25, and panel c shows A forward slash P equals 0.28. Within each panel, data points are marked for Day 3 as red triangles, Day 7 as black circles, and Day 21 as blue squares. Two material types are indicated: N C (left side) and C (right side), separated by a vertical line at 15 percent press mud. Additional black dots at the bottom indicate clay. Across all panels, compressive strength generally increases with curing time and is higher for C than N C. The highest strengths are observed for Day 21 and C, especially at higher press mud percentages.
Surface silication and precipitation of goethite were established as the two governing mechanisms during the first 3 days of curing (see days 1–3 in Fig. 7). At low PM contents, the modest early increase in strength for both NC-cured and C-cured specimens was caused by slow polymerization of dissolved silica in its predominantly monomeric (
$ {\mathrm{H}}_4\mathrm{Si}{\mathrm{O}}_4/{\mathrm{H}}_3\mathrm{Si}{\mathrm{O}}_4^{-} $
 ) form. Within 3 days, silicate species adsorbed onto clay edge sites and underwent limited condensation to form Si-O-Al and Si-O-Si linkages. The term ‘surface silication’ is used to refer to these thin siliceous layers. The implications of silication can be seen in the gradual increase in liquid limit from 21% at PM=5% to 25% at PM=15% (Table 3), and the alignment with progressive improvement in strength (i.e. stress at
$ \unicode{x025B} ={\unicode{x025B}}_{\mathrm{p}} $
 ) and axial strain at the peak (
$ {\unicode{x025B}}_{\mathrm{p}} $
 ). Given the small PM content, Fe oxyhydroxide agglomerates (pellets) were distributed sparsely and exerted minimal influence on the overall packing state. Both the plasticity index and compressive strength decreased as PM increased from 15 to 25%, before increasing again. It is tempting to see similarities between this transitional phase and the concept of threshold fines content in silty sands (Yamamuro and Covert, Reference Yamamuro and Covert2001; Yin et al., Reference Yin, Zhao and Hicher2014); despite similarities, the threshold here formed for different reasons. At PM=25%, the pellets began to take partial control of the stress-strain response by disturbing the continuity of Si-O-Al and Si-O-Si linkages. Pellets gained complete control with larger PM contents. This became evident in the increased plasticity and compressive strength, together with the little change in strain at peak in clays, as PM increased from 35 to 45%. As one would expect, carbonation to aragonites became an additional mechanism in C-cured samples; however, the overall trajectory of mechanical behavior for varied PM content remained similar between NC-cured and C-cured specimens.
The baseline mass of activator in colloidal form was fixed at 22% of the PM mass. An increase to 25% and 28% led to a modest increase in strain at peak,
$ {\unicode{x025B}}_{\mathrm{p}} $
 , strength at peak strain, and residual strength (taken at
$ \unicode{x025B} =1.2{\unicode{x025B}}_{\mathrm{p}} $
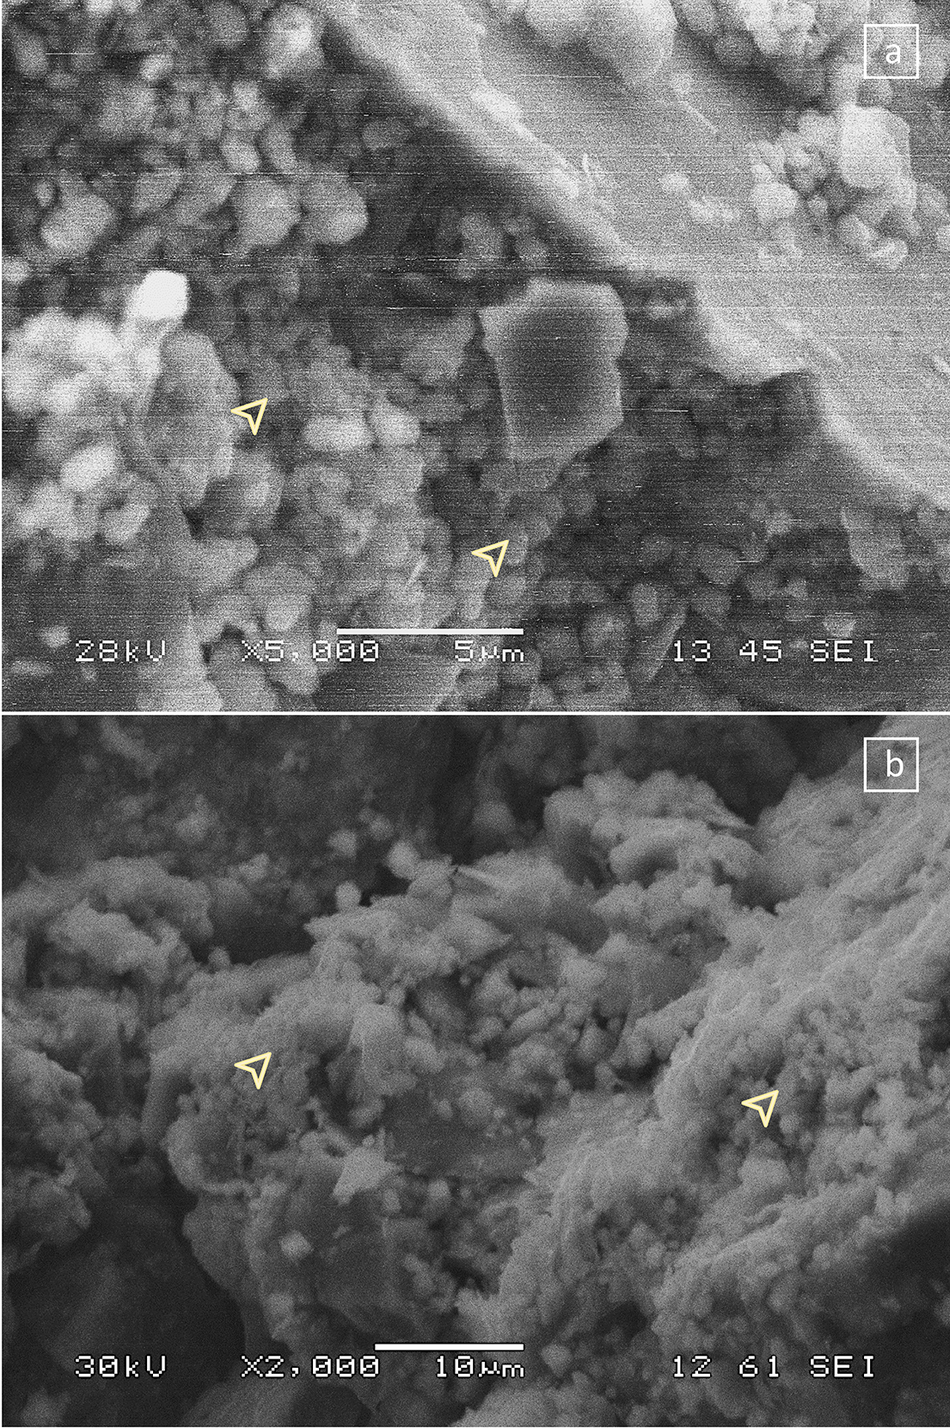
 ). Increased activator content translates to provision of further silica for silicatization; this explains the improvements seen at smaller PM contents. Increased silicate and alkalinity (pH≈11 by day 1 at 0.28 A/P and 35% PM) promoted rapid Fe(III) hydrolysis but slowed goethite crystallization. Precipitation skewed toward Si/OM-modified ferrihydrite with thin goethite coatings on clay (Fig. 9a). The larger effects of carbonation on mechanical response were clear in C-cured specimens. Equally, the role of siliceous and goethite coating in slowing the carbonation became evident for C-cured specimens at the higher A/P ratios of 0.25 and 0.28.
Electron microscopy images of: (a) Si/OM-modified ferrihydrite with intermittent thin goethite coatings; (b) precipitated porous sodium aluminum silicate hydrate.

Figure 9. Long description
The top panel, labeled a, shows a high-magnification S E M photo of Si O M-modified ferrihydrite. The field is densely packed with irregular, granular particles. Two yellow arrowheads highlight thin, plate-like goethite coatings intermittently covering the ferrihydrite aggregates. The scale bar indicates 5 micrometers. The bottom panel, labeled b, presents a lower-magnification S E M photo of precipitated porous sodium aluminum silicate hydrate. The texture is more porous and less compact, with clusters of rounded particles and visible voids. Two yellow arrowheads point to representative porous regions. The scale bar indicates 10 micrometers. Instrument settings, including accelerating voltage and magnification, are displayed below each panel.
For NC-cured specimens, further hydration of the Ca phase, weak pozzolanic reactions, newly formed polymers, and secondary hydrophilic phases controlled the behavior between days 3 and 7. At low PM contents, polymerization and pozzolanic reactions were modest and therefore influenced by concurrently forming hydrophilic phases. The mechanical implications of constraints posed by hydrophilic phases can be seen in the inverse correlation between
$ {q}_{\unicode{x025B} ={\unicode{x025B}}_{\mathrm{p}}} $
 and PM content (up to PM=25%), also in inverse correlation between
$ {q}_{\unicode{x025B} ={\unicode{x025B}}_{\mathrm{p}}} $
 and activator content for PM content up to 25%. To obtain direct thermodynamic evidence for water-budgeting, total suction was inferred from single-point chilled-mirror dew point measurements on selected NC-cured specimens. Within the tenets of thermodynamics, mixtures containing active hydrophilic sinks should show greater suction at comparable water contents. The total suction peaked at intermediate PM content. At 7 days and a similar 14–16% gravimetric water content, the 25% PM mixture exhibited substantially greater total suction (12.3 MPa at 20°C) than both the 10% PM (7.8 MPa) and 45% PM (8.5 MPa) mixtures. The suction trajectory suggested that a larger proportion of pore water was sequestered into hydrophilic phases in mixtures containing 25% PM. Direct and indirect observations imply that at low PM contents, the hydrophilic phases competed for Si-O-Si chains that are otherwise available to support geopolymerization. The trajectory reversed in clays with >25% PM. With these larger PM contents, the abundant supply of calcium and alkali favored the dominant role of polymerization and pozzolanic reactions. This can be seen in direct correlation between
$ {q}_{\unicode{x025B} ={\unicode{x025B}}_{\mathrm{p}}} $
 and PM content (from 25 to 45%), and in inverse correlation between
$ {q}_{\unicode{x025B} ={\unicode{x025B}}_{\mathrm{p}}} $
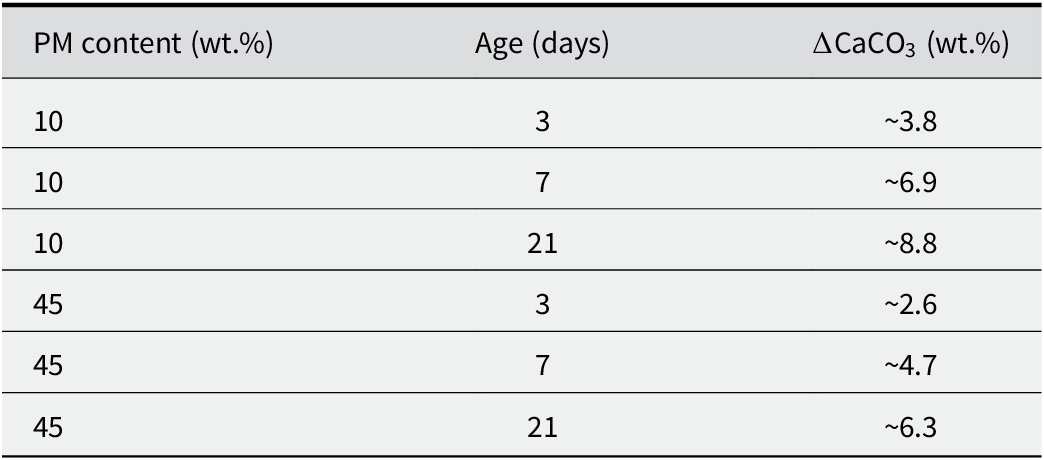
 and activator content for clay with 45% PM content. Two mechanisms generated hydrophilic phases. First, sucrose molecules adsorbed hexaaquacalcium(II), and increasing PM content promoted this reaction. Second, adsorption of Na+ by negatively charged Al-substituted Si-O-Si networks led to the formation of zeolite phases with further affinity for water. The mechanisms through which these phases inhibit polymerization are discussed later in the paper. For C-cured specimens, the behavior was predominantly controlled by the efficiency of carbonation reactions. Overall improvement in strength was evident when comparing C-cured and NC-cured specimens at any PM content. The direct correlation between activator content and strength was consistent with the predominance of carbonation reactions. The reduction in strength levels of C-cured specimens at 45% PM content was due to the coating effect of goethite and consequent delay in carbonation. To capture directly the carbonation kinetics, 12 two-point loss on ignition (LOI) experiments were conducted on specimens containing 10 wt.% and 45 wt.% PM at curing ages of 3, 7, and 21 days. The estimated net CaCO₃ contents are summarized in Table 4. For both PM levels, baseline-corrected CaCO₃ formation increased with curing time in C-cured specimens. At all curing ages, ΔCaCO₃ values were consistently lower for 45 wt.% PM mixtures than for 10 wt.% PM mixtures, despite the greater calcium availability in press mud. The behavior of clay complexes between days 7 and 21 matched almost entirely that of 3–7 days, meaning many of the mechanisms at play continued with time.
Baseline-corrected CaCO₃ content formed during intermittent CO₂ curing, estimated by two-point LOI (600–900°C)

Table 4. Long description
The table has three columns. The first column is P M content in weight percent, the second is Age in days, and the third is delta C a C O sub 3 in weight percent. For P M content 10, at 3 days the value is approximately 3.8, at 7 days approximately 6.9, and at 21 days approximately 8.8. For P M content 45, at 3 days the value is approximately 2.6, at 7 days approximately 4.7, and at 21 days approximately 6.3. Delta C a C O sub 3 increases with age for both P M contents, and is consistently higher for P M content 10 than for 45 at each time point.
Discussion
The sections above established that the behavior of Mercia mudstone treated with press mud and alkali activator is controlled by a complex interplay of dissolution, polymerization, and precipitation reactions. Two sets of findings are of interest. First, sucrose molecules formed hydrophilic organo-Ca complexes (Fig. 7) and suppressed early-stage carbonation (Table 4), retarded goethite crystallization, and promoted the accumulation of ferrihydrite. This delayed crystallization extended the alkaline window for dissolution of clay minerals and release of Ca and Si, enabling the nucleation of C-S-H and N-A-S-H phases. Second, the influence of PM content and activator dosage on the competition between polymerization and hydrophilic phase formation was evident. At low PM contents, surface silication produced thin Si-O-Al/Si-O-Si layers that strengthened the clay without significantly altering its packing. Intermediate PM contents (~25%) represented a transition zone in which Fe‑oxyhydroxide pellets disrupted Si-O-Al networks, leading to a temporary reduction in strength. At high PM contents (≥35%), abundant Ca supply and alkalinity drove rapid polymerization and pozzolanic reactions.
Each of these mechanisms is elaborated further here.
Si-Fe(III) pathway
By day 3, increasing the activator content boosted pore pH and dissolved silicate, thereby accelerating Fe(III) hydrolysis and subsequent precipitation. The specimens containing 25% PM under-performed relative to those with 10% and 45%. This intermediate PM content probably represented a ‘middle ground’ in which organics/ligands disrupted Fe-oxide ordering, while the available Ca phases and alkalinity were still insufficient to fully exploit the prolonged alkaline window.
The literature remains uncertain about how organic coatings modify Fe-oxide surface charge and hydrophilicity in clay-organic matrices. The prevailing view is that organics and dissolved silicate both retard the ordering of Fe oxyhydroxides and diversify crystal habits and orientations (Cornell et al., Reference Cornell, Giovanoli and Schindler1987; Schulz et al. Reference Schulz, ThomasArrigo, Kaegi and Kretzschmar2022), although the balance depends on pH, ionic strength, and ligand chemistry, and therefore varies from sample to sample. For the clay-PM mixtures tested here, increasing the alkali-activator at high PM contents (35–45%) induced highly alkaline pore conditions (pH~11 by day 3). Under these conditions, dissolved Si and organics inhibited goethite crystallization, yielding primarily Si/OM-modified ferrihydrite with intermittent thin goethite coatings on clay surfaces and Ca(OH)2. The resulting coatings roughened clay-particle surfaces and promoted mechanical interlocking (Fig. 9a). By delaying carbonation of the Ca-phase, the coatings also extended the window for alkali-activated binding (Na-, Ca-, Fe-silicate gels) to develop. That microstructural picture was consistent with the strength gains at peak (
$ {q}_{\unicode{x025B} ={\unicode{x025B}}_{\mathrm{p}}} $
 ) and at 1.2× peak strain (
$ {q}_{\unicode{x025B} =1.2{\unicode{x025B}}_{\mathrm{p}}} $
 ), and a greater peak strain (
$ {\unicode{x025B}}_{\mathrm{p}} $
 ) as activator content increased alongside PM. The OM-goethite charge effects and Si-Fe(III) pathways are system specific and the exact partitioning between Si-ferrihydrite, goethite skins, and carbonation products remains uncertain.
Hydrophilic phases
By day 7, sucrose molecules adsorbed onto hydrated
$ {\left[\mathrm{Ca}{\left({\mathrm{H}}_2\mathrm{O}\right)}_6\right]}^{2+} $
 cations already associated with deprotonated clay, through a water-bridged complex. The haxaaqua complex has strongly bound water molecules. Sucrose itself is rich in -OH groups capable of hydrogen bonding with surrounding water. The complex was considered hydrophilic and impacted the bulk water available for other reactions, within the soil system.
The zeolite phase that emerged in the soil complex by day 7 naturally contains framework-bound water and exchangeable cations (here, Na+) that interact strongly with polar water molecules. The microporous network provides a large internal surface area. Water molecules are not just physiosorbed but co-ordinated or hydrogen-bonded to framework oxygen atoms and cations in the pores. In Fig. 9b, the porous structure implies capillary condensation potential; this can be considered as a secondary water-retention mechanism. In this way, zeolites also impacted the available bulk water within the soil system.
Whereas organics-clay adsorption and cation bridging have been inferred previously, the combined FTIR features (broad bands at 3200–3500 cm⁻¹; ~712.7 cm⁻¹), together with corresponding strength trends, indicated that organo-Ca(II) water-bridged complexes and zeolitic sodium aluminosilicate hydrate acted as competitive hydrophilic sinks that rebalanced early-age water budgeting.
At day 7, the variation in measured total suction across PM contents indicated that a larger proportion of pore water was sequestered into hydrophilic phases in mixtures containing intermediate amounts (25 wt.%) of press mud. In effect, ferrihydrite skins, organo-Ca(II) complexes, and zeolitic phases temporarily out-competed early polymerization for pore water, producing the observed strength minimum near 25 wt.% PM. The comparative suction response across mixtures also explains why increasing A/P enhanced strength in NC-cured specimens at high PM contents, and yet slowed carbonation kinetics through the formation of surface coatings.
Conclusions
Time-resolved IR spectroscopy and X-ray diffraction, combined with mechanical testing, demonstrated that PM can be used to steer early reaction pathways in alkali-activated Mercia mudstone. Previous reports of silicate-retarded Fe(III) transformations have largely focused on simple suspensions. In contrast, the clay-organic-alkali matrix formed in the presence of PM showed that elevating dissolved silicate and pH (via A/P) in an organic-rich environment deliberately stabilizes ferrihydrite skins and delays goethite crystallization, measurably extending the alkaline dissolution window needed for early C-S-H/N-A-S-H nucleation. This tunable leverage (PM and A/P) links directly to the observed gains in peak and post-peak strength. Organo-Ca(II) water-bridged complexes and zeolitic sodium aluminosilicate hydrate acted as hydrophilic sinks that transiently competed with geopolymerization for pore water, explaining the strength minimum near ~25% PM. Carbonation generally increased strength, but siliceous/Fe coatings at high PM slowed carbonation kinetics. Raising A/P offset this inhibition. Practically, co-tuning PM content (≥35%) and A/P (≥0.25 in CO₂-exposed curing) is recommended to front-load binding and secure early-age strength. Note that excessive coating can delay carbonation. Future work should quantify water budgeting among hydrophilic phases and polymers and resolve the partitioning between ferrihydrite skins and goethite in mixed organic-alkali environments typical of clay-PM mixtures.
Supplementary material
The supplementary material for this article can be found at http://doi.org/10.1017/cmn.2026.10027.
Author contribution
Conceptualization: A. Assadi-Langroudi; methodology: A. Assadi-Langroudi; software: A. Assadi-Langroudi; investigation: A. Assadi-Langroudi, B. Ayati, M. Rahman; resources: B. Ayati; data curation: A. Assadi-Langroudi; writing – original draft preparation: A. Assadi-Langroudi; writing – review and editing: A. Ekinci; visualization: A. Assadi-Langroudi; project administration: A. Ekinci, A. Assadi-Langroudi. All authors have read and agreed to the published version of the manuscript.
Acknowledgments
The press mud was supplied by Tate & Lyle. Laser diffraction was conducted by the UKCRIC Advanced Infrastructure Materials Lab at Imperial College London.
Financial support
This research received no external funding.
Competing interests
The authors declare none.
Data availability statement
All data generated or analyzed during this study are included in this published article or appeared in Table S1 (Supplementary material).