Implications
Growth rate and feed intake are the two major components of feed efficiency. Recording feed intake is costly. Quantile regression (QR) was used to identify animals with different growth potentials. Although selection for improved feed efficiency reduces growth rate and feed intake, a subset of animals, identified using QR, had positive and negative genetic potentials for growth rate and feed intake, respectively. These animals can increase growth rate while decreasing feed intake, which is the overall idea of feed efficiency. However, feed intake data was not considered for classification of animals, only BW data. This classification can reduce costs associated with feed intake recording to measure feed efficiency.
Introduction
Feed is the largest variable cost in the modern swine production industry, representing about 65% of the total production costs (Patience et al., Reference Patience, Serão and Gutiérrez2015). One way of managing high feed costs is to improve the efficiency with which the pig utilizes dietary nutrients for maintenance and lean gain. This idea is associated with the concept of feed efficiency (Patience, Reference Patience2012).
Among the several measures of feed efficiency, residual feed intake (RFI), introduced by Koch et al. (Reference Koch, Gregory, Chambers and Swiger1963), is used to identify animals that have different observed feed intake than predicted. In this sense, animals with negative RFI are considered more efficient than those with positive RFI. Residual feed intake has moderate to high heritability in pigs, with estimates ranging from 0.14 to 0.47 (Gilbert et al., Reference Gilbert, Bidanel, Gruand, Caritez, Billon, Guillouet, Lagant, Noblet and Sellier2007; Cai et al., Reference Cai, Casey and Dekkers2008; Hoque and Suziki, Reference Hoque and Suziki2008). Calculation of RFI uses the traditional measures of average daily feed intake (ADFI) and average daily gain (ADG), while adjusting them for the animal’s maintenance requirements (i.e. metabolic BW) and other traits associated with the use of feed energy for production (e.g. backfat (BF) depth), allowing for a more effectively measure to compare individual animals (Patience et al., Reference Patience, Serão and Gutiérrez2015). However, according to Jiao et al. (Reference Jiao, Manteca, Gray and Cassady2014), improving feed efficiency by direct selection for reduced RFI is labour-intensive, time-consuming and requires expensive equipment to measure individual feed intake. Therefore, alternative measurements that demand lower costs and labour are interesting for selection programmes.
Another important variable on cost of production is growth (Haraldsen et al., Reference Haraldsen, Ødegard, Olsen, Vangen, Ranberg and Meuwissen2009). The study of growth curves using models with parameters that have biological interpretation improves the understanding of how BW changes over time. Silva et al. (Reference Silva, Resende, Rocha, Duarte, Lopes, Brustolini, Thus, Viana and Guimarães2013) showed that the growth curve parameters in a logistic model are moderately heritable. These authors suggested that understanding the changes in BW over time using growth curves enhances the assessment of the animal’s growth potential, and growth curve parameters can be used for breeding decisions. Moreover, compared with RFI measures, BW records have lower costs and labour (Saintilan et al., Reference Saintilan, Brossard, Vautier, Sellier, Bidanel, van Milgen and Gilbert2015).
In general, non-linear statistical methods used for estimation of growth curve parameters are conditional on the mean BW of the population (Haraldsen et al., Reference Haraldsen, Ødegard, Olsen, Vangen, Ranberg and Meuwissen2009; Luo et al., Reference Luo, Lei, Shen, Yang, Pu, Zhu, Li, Tang, Li, Zhang and Zhu2015; Saintilan et al., Reference Saintilan, Brossard, Vautier, Sellier, Bidanel, van Milgen and Gilbert2015). On the other hand, QR (Koenker and Bassett, Reference Koenker and Bassett1978) is a statistical methodology that allows the use of different quantiles of the distribution of the dependent variable (i.e. BW) when estimating parameters of the model. Thus, non-linear QR may be used to characterize the growth trajectory over the entire distribution of the observed BW, that is, it is possible to identify subgroups within the data with low, median and high BW over time (Koenker and Beum, Reference Koenker and Beum1996).
The aim of this study was to (1) estimate growth curves in pigs selected for decreased RFI and to classify them on growth groups using QR; (2) evaluate the effect of this classification on growth curve parameters, ADG, ADFI and RFI; (3) estimate genetic parameters for the classification based on growth curves and investigated its relationship with growth curve parameters, ADG, ADFI and RFI; and (4) to assess the changes in the shape of growth curve parameters for each group as a function of selection for reduced RFI. Preliminary results using this data have shown that QR may be used to identify animals with different genetic potential for feed efficiency in pigs (Nascimento et al., Reference Nascimento, Nascimento, Cai, Dekkers and Serão2017).
Material and methods
The Iowa State University Institutional Animal Care and Use Commit approved all experimental protocols.
Data
A total of 750 purebred Yorkshire pigs (426 boars and 324 gilts) from seven generations (−1 (founder population) to 5) of the low RFI selection line (more feed efficient line) from Iowa State University were used in this study (details are described in Cai et al., Reference Cai, Casey and Dekkers2008). The average initial age, final age, initial weight and final weight of the animals across generations were 87±11.67 days, 196±17.4 days, 35.7±9.26 kg and 115.14±5.26 kg, respectively. Individual phenotypes measured included BW (measured every 1 or 2 weeks; ~15 measurements per animal on average), daily feed intake and off-test BF (measured at final age (see above)) depth measured on the 10th rib. Protocols and equipment used for measurements and data cleaning are described in Cai et al. (Reference Cai, Casey and Dekkers2008). For each pig, ADG and ADFI were estimated as the slope of the regression of BW and cumulative FI, respectively, on number of days on test. For selection purpose, in summary, RFI was calculated as the difference between the observed feed intake and that predicted, as described in Mauch et al. (Reference Mauch, Young, Serão, Hsu, Patience, Kerr, Weber, Gabler and Dekkers2018). However, for this study, as described below, RFI was analysed using ADFI as the phenotype while accounting for lean growth and maintenance requirements in the model (Mauch et al., Reference Mauch, Young, Serão, Hsu, Patience, Kerr, Weber, Gabler and Dekkers2018).
Individual growth Gompertz curves
For each animal, a non-linear Gompertz model was fitted to the BW-age data, given the following model:
 $$y_{{ij}} {\equals}f\left( {{{\bitheta }} _{i} ,t_{{ij}} } \right){\equals}a_{i} {\times}{\rm exp}\left\{ {{\minus}{\rm exp}\left[ {{{(t_{{ij}} {\minus}b_{i} )} \over {c_{i} }}} \right]} \right\}{\plus}e_{{ij}} $$
where y ij is the BW of pig i measured on t ij days of age (i=1,…, n and j=1,…, r i); n is total number of pigs; r i is the number of repeated measurements for pig i; θi=(a i,b i,c i)T is a vector of parameters of the Gompertz function for each pig i {a i is the asymptotic value (mature BW; kg); b i is the inflection point (age of the animal in which the growth rate is at its maximum; days); c i is the decay parameter (time for growth to cease; days) at the inflection point of the curve, calculated as  $c_{i} {\equals}{{f\left( {{\bf{\bitheta }} _{i} ,t_{{ij}} } \right)} / {\partial \left[ {f\left( {{\bf{\bitheta }} _{i} ,t_{{ij}} } \right)} \right]\,/\,\partial t}} $}; and e ij is the independent and normally distributed residual term,
 $e_{{ij}} \,\sim\,N\left( {0,\sigma _{e}^{2} } \right)$. Data were fit using the nls function in R (R Core Team, 2016).
Population Gompertz growth curves based on quantile regression
With the objective of describing the growth pattern of animals with distinct growth performances, three growth curves (low, average, and high) were estimated for the whole population using non-linear QR. For that, the BW data of each individual was adjusted for initial age, sex and generation, and Gompertz growth curves were estimated for three quantiles (τ= 0.1, 0.5 and 0.9). Quantile regression consists in obtaining the parameters estimates (θτ) that solve the following optimization problem:
 $${\bf{\bitheta }} _{\tau } {\equals}{\rm argmin}_{\bitheta } \left\{ {\mathop{\sum}\limits_{i{\equals}1}^{750} {\mathop{\sum}\limits_{j{\equals}1}^{t_{i} } {\rho _{\tau } \left[ {y_{{it}} {\minus}f\left( {t_{{ij}} ,{\bf \bitheta }_{\tau } } \right)} \right]} } } \right\}$$
where y ijand t ij are as previously described;  $ f\left( {t_{{ij}} ,{\bf \bitheta }_{\tau } } \right)$, is the Gompertz function for each quantile (τ= 0.1, 0.5 and 0.9), θτ=(a τ,b τ,c τ)T is a vector of parameters of the Gompertz function for each quantile (τ); and the parameter
 $\rho _{\tau } (.)$ is denoted as a check function (Koenker and Bassett, Reference Koenker and Bassett1978), and is defined by:
 $$\rho _{\tau } \left[ {y_{{it}} {\minus}f\left( {t_{{ij}} ,{\bf \bitheta }_{\tau } } \right)} \right]{\equals}\left\{ {\matrix{ {\tau \left[ {y_{{it}} {\minus}f\left( {t_{{ij}} ,{\bf \bitheta }_{\tau } } \right)} \right], {\rm if }\;y_{{it}} {\minus}f\left( {t_{{ij}} ,{\bf \bitheta }_{\tau } } \right)\,\gt\,0} \cr {{\minus}(1{\minus}\tau )\left[ {y_{{it}} {\minus}f\left( {t_{{ij}} ,{\bf \bitheta }_{\tau } } \right)} \right], {\rm otherwise}{\rm .}} \cr } } \right.$$
where τ∈(0,1) indicates the quantile of interest. Thus, the values of θτ=(a τ,b τ,c τ)T represent the parameter estimates in the τth quantile of interest. Analyses with non-linear QRs were performed using the nlrq function of the package quantreg (Koenker, Reference Koenker2015) in R.
Classification of animals into growth curve groups
After estimating different growth curves for the population using QR methodology, each animal was classified in one of the three groups based on the overall minimum Euclidian distance between each observed and estimated BW from the three non-linear quantile models. These groups were denoted as quantile regression group (QRG) QRG0.1, QRG0.5 and QRG0.9, for growth curves using quantiles 0.1, 0.5 and 0.9, respectively. Summary statistics for all the data set and groups can be found in Table 1.
Summary statistics of evaluated traits in pigs

a=asymptotic weight (mature BW); b=inflection point; c=decay parameter; ADFI=average daily feed intake; ADG=average daily gain; QRG=quantile regression group.
1 Sample sizes of 750 (all data), 168 (QRG0.1), 384 (QRG0.5) and 198 (QRG0.9).
After determining the QRGs, we assessed the dependence on the dataset used in the analysis via agreement classification rate (ACR). To achieve this, we removed part of the data (training data set) to estimate QR growth curves and used these curves to classify animals (validation data set) not included in the training data set. This analysis was performed using two scenarios: (1) Generations −1 to 4 were used for training and 5 for validation; and (2) generations −1 to 3 were used for training, whereas 4 and 5 were used for validation. For scenario 1, 645 and 105 animals were used for training and validation, respectively, whereas for scenario 2, 572 and 178 were used for training and validation, respectively. The goal in using a larger number of animals for training compared to the validation data set was to properly estimate quantile growth curves, whereas the decision in having animals from older generations for training v. from recent generations for validation was based on the fact that we wanted to evaluate whether we could predict the QRG of the progeny in a selected population. Finally, by having two scenarios, we could asses the combined impact of using fewer animals in the training data set and not using all previous generations to estimate the QRGs.
Effect of quantile regression group and genetic parameters
We evaluated the effect of QRG classification on the phenotypes (ADG, ADFI and growth curve parameters (a, b and c)) analysed in this study using the following model:
 $$y_{{ijkl}} {\equals}\mu {\plus}QRG_{i} {\plus}S_{j} {\plus}G_{k} {\plus}b_{1} IA_{{ijkl}} {\plus}u_{{ijkl}} {\plus}e_{{ijkl}} $$
where y ijkl is the observed phenotype of the individual l of the ith level of the fixed effect of QRG i, jth level of the fixed-effect of Sex (S j), and kth level of the fixed-effect of Generation (G k); b 1 is the partial regression coefficient of the covariate Initial Age (IA ijkl); u ijkl the breeding value for the animals; and e ijkl the random error. The vectors of breeding values and residual effects were assumed to be normally distributed as:  ${\mib{u}} \sim N(0,{\mib{A}} \sigma _{u}^{2} )$ and
 ${\mib{e}} \,\sim\,N(0,{\mib{I}} \sigma _{e}^{2} )$, respectively, where A is the additive relationship matrix constructed using 9327 pigs,
 $\sigma _{u}^{2} $ is the additive genetic variance, I is the identity matrix, and
 $\sigma _{e}^{2} $ is the residual variance. This model was used to analyse ADG, ADFI and growth curve parameters (a, b and c). For the analysis of RFI, ADFI was used as the phenotype in model (2) including the additional covariates of ADG, BF and mid-metabolic BW (BW0.75).
Genetic parameters (heritability, and genetic and phenotypic correlations) were estimated using different models. First, the fixed-effect of QRG was excluded from model (2) for the analyses of RFI, ADG, ADFI, a, b, c and QRG. For the analysis of QRG as a trait, a multinomial threshold model (QRG = 0.1, 0.5 or 0.9) with a probit link function was used to estimate the heritability. However, due to software limitation, a mixed linear animal model was used when estimating correlations between QRG and the other traits. Second, in order to assess the impact of QRG on the estimation of the genetic parameters for ADG, ADFI, RFI and growth parameters, an alternative analysis using model (2) was performed. In this case, QRG was fitted in model (as in model 2) as a categorical fixed-effect and genetic parameters were estimated. In this analysis, QRG was not analysed as a phenotype. Analyses were performed in ASReml 3.0 (Gilmour et al., Reference Gilmour, Gogel, Cullis and Thompson2009).
Genetic trends
Genetic trends for all traits, as a function of selection for reduced RFI, was calculated by QRG. Estimated breeding values (EBVs) of individuals with phenotype were averaged by generation and QRG. Estimated breeding values were averaged to be centred at 0 at generation −1. EBVs were obtained from the analyses using model (2).
Results
Quantile growth curves and classification into growth groups
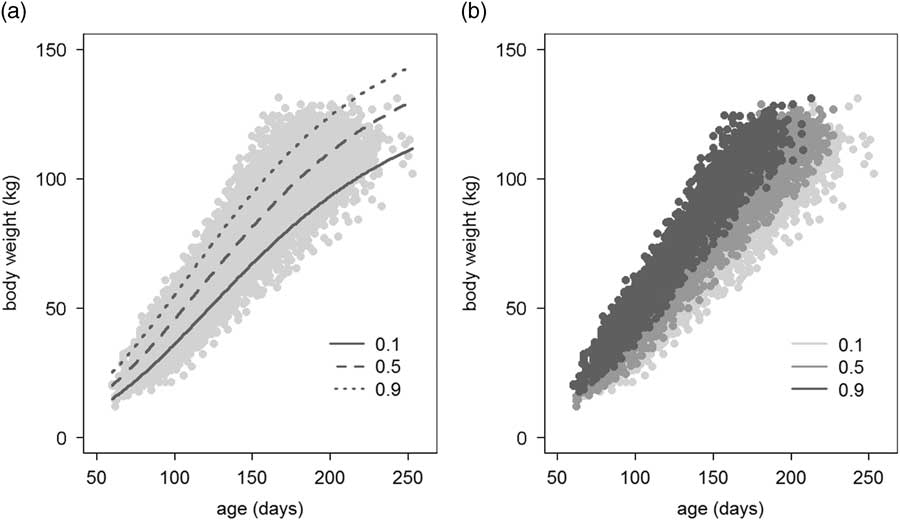
The three quantile Gompertz curves (QRG0.1, QRG0.5 and QRG0.9) estimated based on all the data are shown in Figure 1a. As expected, the curve estimated based on the lowest quantile (0.1) showed lower estimated BW across time, whereas the highest quantile (0.9) generated an estimated growth curve with greater BW across time. Overall, differences between BW values were small in the beginning of the trial, and increased with time.
(a) Estimated quantile regression Gompertz curves for each Quantile Regression Group (QRG), for quantiles 0.1, 0.5 and 0.9, and (b) BW data of pigs classified into one of the three QRG. Each dot in the figures represents the BW of an animal.

Classification of each animal (multiple BW) in the data set into one of the three growth curves is shown in Figure 1b. Overall, the BW data for each group is well clustered together. However, there was substantial overlap between groups. A total 168, 384 and 198 animals were classified into QRG0.1, QRG0.5 and QRG0.9, respectively.
Agreement of classification into quantile regression groups
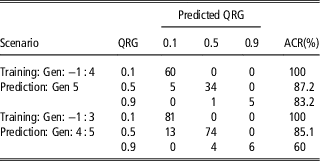
We evaluated the agreement of classifying animals in one of the three QRGs by estimating quantile growth curves using animals in generations −1 to 4, or those in −1 to 3, classifying animals not used for estimation of the growth curves (i.e. generations 5, and 4 and 5, respectively), and comparing this classification with the original one including all data set (Table 2). The ACR of animals on QRG0.1 was perfect (100%) for both scenarios. For QRG0.5, ACR was high, with 87.2% and 85.1% when generations −1 to 4, and −1 to 3 were used for training. For these scenarios, 5 and 13 animals from QRG0.5 were differently classified into QRG0.1, respectively. In contrast, a lower ACR was observed for animals from QRG0.9, especially when generations −1 to 3 were used for training, with only 60% of ACR (6 out of 10 animals). When generations −1 to 4 were used for training, ACR was similar (83.2%) to those for QRG0.5, with only one out of six animals misclassified.
Number of pigs in each quantile regression group (QRG) and agreement classification rate (ACR) for each scenario

Gen=generation of the low residual feed intake selection line.
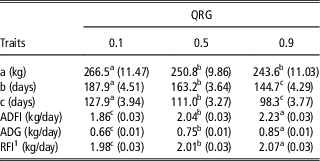
The least-squares means of each group was statistically different from each other (P<0.05) for all traits (Table 3), with the exception of the asymptotic weight (parameter a), where QRG0.1 showed greater asymptotic weight (a) compared to both QRG0.5 and QRG0.9. For the other growth parameters, animals classified into QRG0.1 had greater inflection point (b) and decay parameter (c) than those in QRG0.5, which had greater b and c than those in QRG0.9. This was expected, as the QRGs represented animals with three distinct growth performances (low, average and high). For all other traits (ADFI, ADG and RFI), the relationship between QRG was constant; animals in QRG0.1 had lower ADFI, ADG and RFI than those in QRG0.5, which had lower ADFI, ADG and RFI than those in QRG0.9. Overall, animals classified into QRG0.1 presented the lowest daily intake and daily growth, whereas those classified into QRG0.9 had the greatest.
Effect of quantile regression group (QRG) on pig performance

a=asymptotic weight (mature BW); b=inflection point; c=decay parameter; ADFI=average daily feed intake; ADG=average daily gain; RFI=residual feed intake.
a,b,cValues within a row with different superscripts differ significantly at P<0.05.
Standard error within parentheses.
1 RFI was analysed with ADFI as the response variable, representing the amount of feed consumed given the same ADG and maintenance requirement.
Genetic parameters
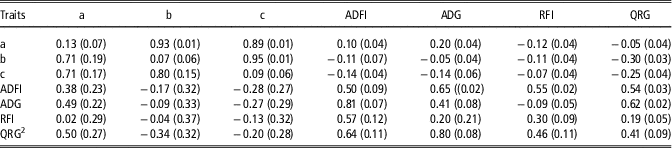
Estimates of genetic parameters (heritability, and genetic and phenotypic correlations) are presented in Table 4. Estimates of heritability for growth curve parameters were low, with 0.13±0.07, 0.07±0.06 and 0.09±0.06, for parameters a, b and c, respectively. In contrast, all other traits had moderate to high heritability estimates, with 0.50±0.09, 0.41±0.08 and 0.30±0.09, for ADFI, ADG and RFI, respectively. In addition to these traits, we also evaluated the classification into QRGs as a categorical trait (three levels), which showed a moderate–high heritability.
Genetic parametersFootnote 1 (standard error) for growth curve parameters, feed efficiency and component traits in pigs, and classification in quantile regression group (QRG)

a=asymptotic weight (mature BW); b=inflection point; c=decay parameter; ADFI=average daily feed intake; ADG=average daily gain; RFI=residual feed intake.
1 Heritability, and genetic and phenotypic correlations presented on the diagonal, lower off-diagonal and upper off-diagonal, respectively.
2 Multinomial threshold model with a probit link function was used to estimate the heritability, whereas a mixed linear model was used when estimating correlations between QRG and the other traits.
Estimates of genetic and phenotypic correlations are presented in the off-diagonals (Table 4). Between growth curve parameters, correlations were very high, with the lowest phenotypic correlation being estimated between parameters a and c, and the lowest genetic correlation estimated for a with b and c. Between RFI, ADG and ADFI, phenotypic correlations ranged from low (ADG with RFI) to high (ADG with ADFI), whereas genetic correlations were stronger in general, ranging from low (ADG with RFI) to high (ADG with ADFI). Phenotypic correlation between growth curve parameters with RFI, ADFI and ADG were, in general, not strong, ranging from −0.14±0.04 (c with ADFI) to 0.20±0.04 (a with ADG). Similarly, genetic correlations were generally low, with the exception of the estimate between a with ADG (0.49±0.22). However, genetic correlations had generally large standard errors.
Estimates of phenotypic correlations between QRG (as a quantitative trait) with growth parameters were negative low, whereas with all other traits, these were positive and ranged from low (with RFI) to moderate–high (with ADG). As for genetic correlations between QRG with growth curve parameters, these ranged from negative low (with c) to positive moderate (with a). Genetic correlations between QRG and other traits were positive, and ranged from moderate (with RFI) to high (with ADG).
In addition to these results, an alternative analysis (Supplementary Table S1) was performed in which genetic parameters were estimated in a model including the fixed effect of QRG. Overall, heritability estimates were similar, with the exception for ADG, in which we obtained an estimate of 0.29±0.08. Likewise, correlations were overall similar between the two analyses, with greater differences observed for ADG. Phenotypic and genetic correlations with greater changes were observed between ADG with b. In the original analysis, these were −0.05±0.04 and −0.09±0.33, respectively, whereas in the alternative analysis these were 0.18±0.04 and 0.41±0.30, respectively. In addition, the genetic correlations between growth parameters were stronger when QRG was fit in the model as a fixed effect.
Relationship between selection for low residual feed intake and quantile regression groups
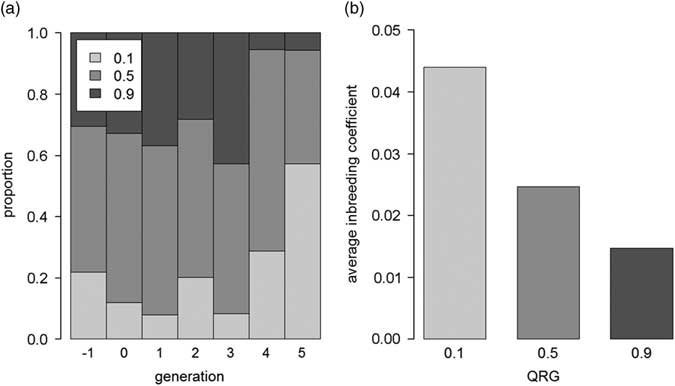
The change in the proportion of animals belonging to each QRG by generation is depicted in Figure 2a. In the base generation (generation −1), there were 33 (22%), 72 (48%) and 46 (30%) animals classified into QRG0.1, QRG0.5 and QRG0.9, respectively. After five generations of selection for reduced RFI, these proportions changed to 57%, 37% and 6%, respectively. In addition, most (48%) of the 168 animals classified into QRG0.1 belonged to the last two generations. In contrast, only 5% of the animals classified into QRG0.9 were in the last two generations. The proportion of animals classified into QRG0.5, the largest group, remained somewhat constant across generations, ranging from 13% (48 animals) in generation −1% to 10% (37 animals) in generation 5. Finally, the mean inbreeding coefficient estimated for each QRG, across all generations, is shown in Figure 2b. As QRG0.1 contains the more selected animals, the mean inbreeding coefficient for QRG0.1 was greater (0.04) than those for QRG0.5 and QRG0.9, with 0.02 and 0.01, respectively.
(a) Proportion of pigs classified into each Quantile Regression Group (QRG) by generation of the low residual feed intake selection line, and (b) mean inbreeding coefficient for each QRG.

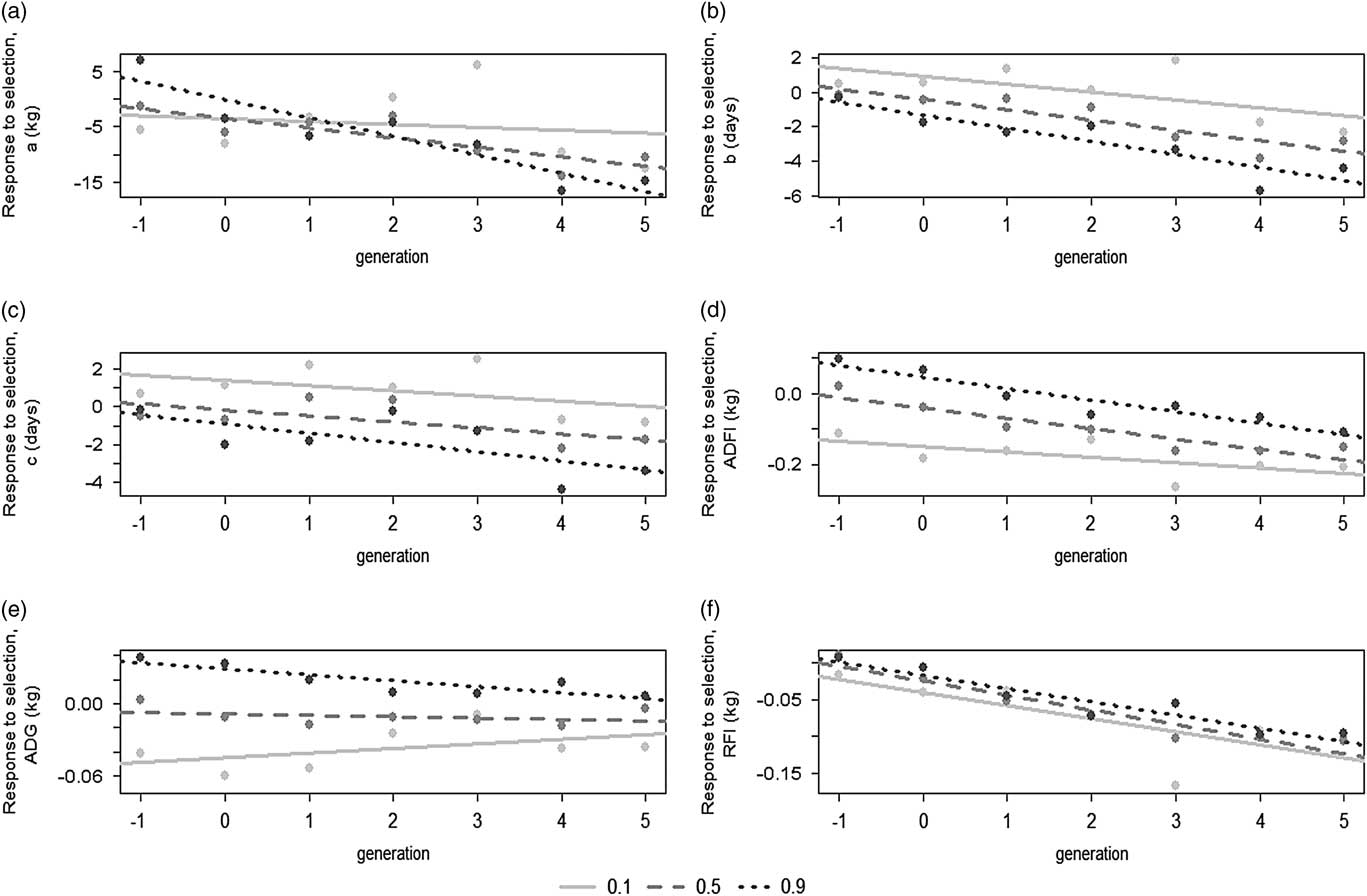
The genetic trends by QRG for each trait, as a function of selection for reduced RFI, are shown in Figure 3. As expected due to selection for lower RFI, EBVs decreased over generations for all traits. However, for ADG, it was observed an increase of average EBV for QRG0.1, whereas those in QRG0.5 had constant average EBVs across generations, and those in QRG0.9 had increased EBVs over time. Genetic trends for growth parameter a were the most variable. Differences in the average EBVs of QRG for growth parameters b and c were small at earlier generations but increased over time. In contrast, the opposite was observed for ADFI, where greater differences between EBVs of QRG were observed at earlier generations. and RFI showed small differences between QRGs. For RFI, EBV differences between QRG were much smaller than for the other traits, and EBVs decreased at a similar rate between QRG across generations. Finally, b and c were the only traits in which the highest average EBVs were observed for QRG0.1, whereas for all other traits QRG0.9 had the highest values.
Genetic trends as a function of selection for low residual feed intake (RFI) for each Quantile Regression Group (QRG) in pigs. Y-axes show average estimated breeding values along generations of selection for reduced RFI (X-axis), for (a) growth curve parameter a (asymptotic weight), (b) growth curve parameter b (inflection point), (c) growth curve parameter c (decay parameter), (d) average daily feed intake (ADFI), (e) average daily gain (ADG) and (f) RFI.

Discussion
We evaluated the use of QR methodology to estimate different growth curves based on three quantiles (0.1, 0.5 and 0.9) of the BW data from a swine population under selection for reduced RFI, in order to identify animals that may different growth potentials and classify them to one of the three quantile growth curves. Furthermore, we investigated the relationship between growth curve parameters and performance traits, as well as how genetic trends differed between animals with different quantile growth curves. Cai et al. (Reference Cai, Wu and Dekkers2011), using the same data set, observed that after five generations of selection for reduced RFI, the low RFI line had lower ADFI, ADG and RFI compared to a control, that is, unselected, line. In our study, we were interested in identifying groups of animals with different growth curves, that is, that belong to different quantiles of the data, and how this classification may be associated with growth parameters, RFI and feed efficiency component traits.
Classification of animals into quantile growth curves
When classifying animals in each QRG, we observed a substantial overlap between the BW data from different QRG, especially between QRG0.9 with QRG0.5, and between QRG0.1 with QRG0.5. However, within each QRG, the variability was low, suggesting that animals were properly classified in each group. In fact, when we evaluated the dependence on the data set used for the classification of animals into one of the three QRG based on part of the data (initial generations), results were overall accurate. All animals classified as QRG0.1 using the whole dataset were still classified into QRG0.1 when only part of the data were used. When misclassification occurred, animals were only misclassified to one QRG. For example, part of the QRG0.5 animals were incorrectly classified into QRG0.1, and those from QRG0.9 on QRG0.5, indicating that the estimated curves were very distinct, even with this small bias. As data from later generations were included, the quantile estimates must have moved towards QRG0.1, as this group became larger over generation, which should explain this tendency of classifying some animals into one group below. Although we observed a lower ACR for animals from QRG0.9, this could be due to the very low number of animals originally classified in this group.
Characteristics of the quantile growth curves
In addition to the clear observed differences between the three growth curves, overall, curve parameters were statistically different between all QRG. The exception was for parameter a, in which QRG0.1 had greater asymptotic weight compared to the other two groups. The estimated curve for QRG0.1 was characterized by having the greatest estimates for asymptotic weight (parameter a), inflection point (parameter b) and decay parameter (parameter c). Therefore, compared to the other QRG, animals in QRG0.1 have greater mature weight, longer period of exponential growth, and lower deceleration of growth, respectively.
We observed contrasting inflection points (parameter b), where animals from QRG0.5 and QRG0.9 would change their growth potential before slaughter age (~160 and 145 days, respectively). In contrast, the estimated inflection point of QRG0.1 (~188 days) was greater, although similar, to a slaughter age of 6 months, suggesting that these animals would keep their highest growth potential throughout the whole growing phase at fattening farms. Therefore, animals in QRG0.1 have a more steady growth, that is, more linear, compared to the other groups. On the other hand, due to its lower growth, it would take longer for QRG0.1 animals to reach market weight compared to the other groups.
Similarly to what we observed for the growth parameters, the three QRG had distinct performance (ADFI, ADG and RFI). The relationship between QRG was overall the same for ADFI, ADG and RFI, across the different QRG. The lower ADG, ADFI and RFI in QRG0.1 animals, compared to the other groups, could be explained by the difference in growth parameters between QRG. With a much later time to reach to their inflection point, QRG0.1 animals spend more time increasing their growth rate (West et al., Reference West, Brown and Enquist2001) compared to animals in the other groups, which reached the inflection point at younger ages, even though QRG0.1 had lower ADG than the other groups. In addition, a later inflection point may help explaining the lower ADFI in QRG0.1 compared to the other QRG. Intake is greater in older animals than in young animals (Webb, Reference Webb1998), but with a greater inflection point and mature weight, QRG0.1 animals must be taking longer to reach to the point where intake is highest. Therefore, with a greater gain and lower intake, QRG0.1 animals would be more feed efficient than those from the other QRG, and this greater feed efficiency was captured by the RFI results, in which QRG0.1 had lower RFI than those from the other groups. Note that in this study RFI was analysed with ADFI as the phenotype in a model that included the covariates used to predict ADFI (i.e. ADG, BF and BW0.75). Therefore, the least-squares means for this trait should be interpreted as the ADFI of each QRG given that all animals used in this study had the same growth rate (ADG), BF deposition and energy maintenance (BW0.75). Hence, the RFI values reported in this work are all positive and do not deviate from 0.
Altogether, these results indicate that the use of QR to identify animals with different growth potentials is appropriate, yielding clear distinction between the growth curves estimated using the three quantiles evaluated, and that classification of animals from newer generations into one of these three groups based on growth curves estimated from older generations is accurate.
In addition to the three quantiles (0.1, 0.5 and 0.9) used in this study, other quantiles were evaluated. The percentage of animals classified in each group was 30%, 35% and 35% when 0.2, 0.5 and 0.8 were used as quantiles, respectively, and 35%, 23% and 42%, when quantiles 0.3, 0.5 and 0.7 were evaluated, respectively (data not shown). However, for these other scenarios, there was a much greater overlap between quantile groups (data not shown), indicating that the between group variation was lower and within group variation was greater than for the quantiles used in our study. In addition, the number of animals in each QRG used in this study was large enough for the type of analyses performed in this study. Therefore, we believe that these distinct quantiles (0.1, 0.5 and 0.9) were appropriate for the objectives of this study.
Genetic parameters
One of our main objectives in this study was to estimate genetic parameters for QRG and investigate its relationship with the other traits. Quantile regression groups was analysed with a multinomial threshold model, and its heritability estimate (0.41) was the same as for ADG, which was analysed with a linear mixed model. In fact, these two traits had a high and positive genetic correlation (0.80). However, given the standard error of this estimate (0.08), these two traits are not perfectly the same genetic traits, indicating that QRG captures a different, albeit small, genetic variation than ADG. Average daily gain is calculated as a linear regression of BW of day, representing an average growth rate across time, while assuming a constant growth rate. In contrast, QRG is a categorical summarization of the growth trajectory of individuals; it takes into consideration differences in growth parameters estimates (i.e. a, b and c), and thus, captures nuances that ADG might ignore. Moreover, when we estimated genetic parameters including the fixed-effect of QRG in the model, the most contrasting result obtained for ADG was the genetic correlation with inflection point (parameter b), which changed from −0.09 (not statistically significant) to 0.41, when analysed without and with the fixed-effect of QRG in the model, respectively. This suggests that ADG has a positive relationship with parameter b only after we account for the differences in growth trajectories, further supporting that QRG and ADG capture different variation. Therefore, even though these two traits are highly correlated, they may differ on how they are expressing growth rate.
Another difference observed between these two traits (QRG and ADG) was for their genetic correlations with RFI. Although the estimate between ADG and RFI was not statistically significant (0.09±0.21), QRG had a positive and significant genetic correlation with this trait, with 0.46±0.11 (Table 4). The moderate positive genetic correlation between RFI and QRG supports our results in which QRG0.1 had lower RFI, and thus, are more feed efficient than the other QRG. In addition, due to the high costs and labour required for collection of feed intake data, these estimates suggest that QRG has the potential to be used as a selection tool to improve feed efficiency, even if the indirect response in RFI due to direct selection for QRG would be only ~60% of the response to direct selection for RFI.
Overall, genetic parameters for QRG were in accordance to all other results presented in this study, in which classification to lower quantiles (e.g. QRG0.1) would result in animals with lower ADFI, ADG and RFI, and greater inflection point (parameter b) and decay parameter (parameter c), compared to those classified into greater quantiles. However, the relationship between traits QRG and growth parameter a (asymptotic weight) was the opposite of what we would expect; that is, the genetic correlation was positive instead of negative. We should note, however, that the asymptotic weight of these animals was predicted to happen outside the period in which data were collected. Thus, this opposite result could be due to the limitations of working with an unobserved phenotype, and might not actually be representative of what is happening at the genetic level. Furthermore, as will be discussed later in this manuscript, selection for low RFI had a clear defined effect on the genetic trends of each QRG for all traits analysed in this study, with the exception of asymptotic weight.
The genetic parameter estimates obtained in this study for growth curve parameters were lower than those reported by Cai et al. (Reference Cai, Wu and Dekkers2011). These authors, using the same data, reported much larger heritability estimates for growth parameters, ranging from 0.33 to 0.64. The difference in results could be explained by the different statistical procedures used between each study. For instance, Cai et al. (Reference Cai, Wu and Dekkers2011) analysed data from boars and gilts separately, and used only part of inverse of the relationship matrix in the analyses in a Bayesian framework. Our heritability estimates for parameter a was comparable to that reported by Coyne et al. (Reference Coyne, Sevon-Aimonen, Berry, Mäntysaari, Juga and McHugh2014), which found an estimate of 0.14 in Finnish Yorkshire and Landrace animals. However, these authors also found a high estimate for parameter b, with 0.46. Our heritability estimates increased when the fixed-effect of QRG was fitted in the model. However, this increase was not large enough to have estimates similar to those reported Cai et al. (Reference Cai, Wu and Dekkers2011). Heritability estimates for ADG (0.41), ADFI (0.50) and RFI (0.30) were consistent with those reported in the literature. Specifically, for ADG and ADFI, estimates were close to those reported by Cai et al. (Reference Cai, Casey and Dekkers2008), with 0.42 and 0.44 for ADG and ADFI, respectively, and by Jiao et al. (Reference Jiao, Manteca, Gray and Cassady2014), with 0.51 and 0.66 for ADG and ADFI, respectively. In addition, our heritability estimate for RFI was within the upper range of heritability estimates in pigs (0.15 to 0.40; Von Felde et al., Reference Von Felde, Roehe, Looft and Kalm1996; Johnson et al., Reference Johnson, Chewning and Nugent1999; Cai et al., Reference Cai, Casey and Dekkers2008). The estimates of genetic and phenotypic correlations between the Gompertz parameters were positive and high, which are similar those reported by Cai et al. (Reference Cai, Kaiser and Dekkers2012), where values ranged from 0.78 to 0.97. The high positive genetic correlation between ADG and ADFI were consistent with values reported in the literature, ranging from 0.32 to 0.89 (Cai et al., Reference Cai, Casey and Dekkers2008; Jiao et al., Reference Jiao, Manteca, Gray and Cassady2014). Jiao et al. (Reference Jiao, Manteca, Gray and Cassady2014) reported similar estimates of genetic correlation between ADG and RFI (−0.09) in Duroc pigs. However, in Cai et al. (Reference Cai, Casey and Dekkers2008) a lower positive value (0.17) was reported.
In our study, with genetic correlations estimates similar to those reported in the literature by others, we observed that selection for reduced RFI (i.e. more efficient animals) resulted in small to no changes (large standard errors) in growth curve parameters and in reduced ADFI and ADG. Phenotypically, selection for reduced RFI showed reduced ADFI, but little to no changes (large standard errors) on the other traits. However, we observed phenotypic differences in all these traits once we added the effect of QRG in the model, indicating that, within the population, we have groups animals that have different relationships with these traits, and this was not captured with correlations. However, this model presented problems when estimating the correlations between ADFI and RFI. Finally, we also analysed these data assuming each QRG as a trait, but due to the small number of animals in each QRG, our models had problems with convergence when estimate genetic parameters within and between QRGs. Therefore, results for these analyses will not be shown in this study.
Relationship between selection for low residual feed intake and quantile regression groups
Over generations of selection for low RFI, the proportion of animals classified into each QRG changed. This change was due to the increase in proportion of QRG0.1 animals, while the proportion of QRG0.9 animals decreased. This change in the genetic makeup of the population was expected given the genetic parameters presented in this study, in which QRG had a moderate genetic correlation with RFI (0.46). Thus, by decreasing RFI in the population, we would expect a greater proportion of QRG0.1 animals over time. This indirect selection for pigs with lower growth trajectories can also explain the greater inbreeding coefficient of QRG0.1 animals (0.04) after five generations of selection for low RFI, compared to the other QRGs (0.02 and 0.01 for QRG0.5 and QRG0.9, respectively).
Perhaps, this is even clearer when we look at the genetic trends of all traits by QRGs. For growth parameters b and c, although genetic trends are decreasing for all QRGs, differences between each QRG are increasing over time. This suggests that response to low RFI has a lower impact on the growth parameters of animals with lower growth trajectories (QRG0.1) compared to the other groups. As previously noted, the relationship between selection for low RFI and asymptotic weight (parameter a) was not so clear. There was a change in rankings over time, with QRG0.9 having the highest average EBV at earlier generations and QRG0.1 at later generations. Although this relationship was not overall the same as the ones observed for the other growth parameters, the specific relationship between selection for low RFI and growth parameter a in QRG0.1 animals was similar, where changes over time had a less steeper decrease. However, there was a much greater variation on the average EBVs for this parameter compared to the others, and thus, conclusions on its genetic trend might be misleading.
Using the same data set, the genetic trends reported for performance traits in our study were similar to those observed in Cai et al. (Reference Cai, Casey and Dekkers2008). These authors reported that single-trait selection for decreasing RFI also led to a reduction in ADFI and ADG over generations. In our study, however, we observed that different groups of animals had distinct genetic trends for these traits. Similarly to what we observed for growth parameters, QRG0.1 animals had a less steep decrease in ADFI than the other groups. However, different than what we observed for growth parameters, this difference decreased over time, suggesting that the average EBV of these groups would be similar after more rounds of selection for reduced RFI, and eventually, change rankings with QRG0.1 having greater average EBVs than the other QRGs. This decreased difference in average EBVs between QRGs across time was also observed for ADG. Interestingly, this trait was the only one that had a contrasting pattern for each QRG, where genetic trends for QRGs 0.1, 0.5 and 0.9 increased, remained constant and decreased over time, respectively. Therefore, even though selection for decreased RFI decreases ADG as a whole, this might not be the case for animals with low growth trajectories (QRG0.1). Animals classified into QRG0.1 might be able to increase gain and decrease intake when selected for increased feed efficiency (decreased RFI). We tried to investigate the genetic correlations between ADFI, ADG and RFI using only animals in QRG0.1, but due to the small data set, models did not converge. Finally, negative genetic trends for RFI were very similar for all QRG, but the rankings were as expected, with QRG0.1 having lower average EBVs than RQG0.5 and QRG0.9.
It is worth noting that, although results were consistent and interesting, the data set used in this study was small, especially when we think on the number of animals in each QRG within generation (e.g. 6% in QRG0.9 generation 5). Moreover, as pointed out above, the estimation of genetic parameters between traits within QRG would bring additional information about the relationship between selection for low RFI and other traits evaluated in this study. Therefore, it would be interesting to have an additional study with a large data set, including other economically important traits, in which QR methodology could be applied to identify groups within the population for genetic parameter estimation, and perhaps and genomic analyses.
Conclusions
Quantile regression methodology was efficient in identifying Yorkshire pigs selected for decreased RFI that present distinct growth trajectories based on three different quantiles (0.1, 0.5 and 0.9). When only part of the data were used to estimate quantile growth curves, we observed an overall high correct classification rate of animals into their original QRG, supporting the use of QR for the identification of animals with different growth trajectories. In addition, there was a significant effect of QRG classification on all traits analysed in this study. Animals with a lower growth trajectory (QRG0.1) had greater asymptotic weight (a), inflection point (b), decay parameter (c) and feed efficiency (RFI), and lower intake (ADFI) and growth rate (ADG) than animals classified into the other QRG (0.5 and 0.9).
The genetic parameters estimated in this study indicate that QRG classification is moderate–high heritable (0.41) and that this trait is very similar to ADG, with a genetic correlation of 0.8. However, this estimate also indicates that these two traits may be capturing different characteristics of the growth potential in pigs, with ADG representing an average growth rate and QRG representing a summarization of different growth curve parameters. Furthermore, the moderate genetic correlation between QRG and RFI (0.46) suggests that selection for lower QRG can improve feed efficiency (i.e. decrease RFI) without the need for collecting feed intake data, which is costly and labour intensive. However, use of QRC as an indicator trait for RFI would be about 60% of the efficiency of direct selection for RFI.
Finally, selection for reduced RFI increased the proportion of QRG0.1 animals in this population, while decreasing the proportion of animals with high growth trajectories (QRG0.9). In addition, genetic trends for all traits evaluated indicate that QRG0.1 animals were the only ones able to increase growth (ADG) while decreasing intake (ADFI) over time, suggesting that, although selection for reduced RFI results in decreased ADFI and ADG as a whole, there is a subset of individuals that are able to have opposite genetic trends between these two component traits of feed efficiency. Overall, these results indicate that selection for reduced RFI changes the shape of growth curves in Yorkshire in pigs, and that QR methodology was able to identify animals having different genetic potential for feed efficiency, bringing a new opportunity to improve selection for reduced RFI.
Acknowledgements
Funds for development and maintenance of the selection lines were from the Iowa Agriculture and Home Economics Experiment Station, Ames, Iowa, USA (Project No. 3600 and 5380) and supported by Hatch Act and State of Iowa Funds. CAPES and FAPEMIG supported M Nascimento and ACC Nascimento.
Declaration of interest
The authors declare that they have no competing interests.
Ethics statement
Experimental procedures for this study were approved by the Iowa State University Animal Care and Use Committee (IACUC #11-1-4996S).
Software and data repository resources
None of the data were deposited in an official repository.
Supplementary material
To view supplementary material for this article, please visit https://doi.org/10.1017/S1751731118002616