Implications
At present, the challenges of animal nutrition are diverse. They include not only performance but also efficiency and environment. The concept of multicriteria animal responses to diet constitutes a good way for the farmers and advisers to manipulate the itineraries of production in order to obtain a production system that is both productive and respectful. The present study provides new information on animal responses under warm conditions, with comparison of different animal species and genotypes. Some equations could be used in software decision support for predicting multiple responses of farmed ruminants.
Introduction
Classic livestock feeding practices are based on the assessment of requirements and feeding recommendations that allow animals to express their potential for production. All the feed unit systems are built on this principle (Agabriel et al., Reference Agabriel, Pomiès, Nozière and Faverdin2007). This approach, which is strictly based on potential for performance, does not take into account sufficiently the animal’s responses to diet variation in terms of feed efficiency and also the impact of diet on product composition, waste and on animal health and welfare. Some authors (Sauvant, Reference Sauvant1992) have suggested enriching the classical feeding concept of satisfying the requirements with the concept of multicriteria responses of animals to diets. This concept could be particularly interesting in tropical and warm countries, where the major strategy is to valorise biomass through animals that are not always fed at the level of their requirements.
Compared with temperate regions, ruminants in tropical and warm regions generally subsist under poor nutritional conditions (Wilson and Minson, Reference Wilson and Minson1980). There has been only limited previous synthesis of data concerning animal responses to this type of diet. In a previous study (Salah et al., Reference Salah, Sauvant and Archimede2014), energy and protein requirements were revisited and updated by a meta-analysis of a large database. As this database contains a large diversity of types of diets and animals, it was decided to explore intra-experimental variations of data to build empirical models of animal responses across a wide diversity of animals and nutritional practices, mainly in tropical and warm conditions.
Material and methods
Data collection
A careful literature survey was conducted to extract data from various international scientific reviews, easily accessible regional reviews, reports and theses. Publications were selected if they simultaneously contained at least the following data: the co-occurrence data on (1) chemical composition of the diet (especially OM, CP and NDF); (2) intake and total tract digestion of diets (especially DM or OM, CP); and(3) animal growth. In some publications, animal growth was assessed through nitrogen balance. In total, 589 publications representing 2225 different dietary treatments were pooled to be used in the present study: 325 publications on sheep (n=1287 treatments); 145 on goats (n=544 treatments); and 119 publications on cattle (n=394 treatments).
Animals and diets used in the feeding experiments
For each species, three groups of genotypes were distinguished (genotypes from tropical and warm countries, genotypes from temperate countries and crossbreeds of the two). This splitting was performed according to the FAO classification (http://www.fao.org/docrep/t1300t/t1300t00.htm#Contents; http://www.fao.org/docrep/;004/X6532E/X6532E00.htm#TOC; http://eng.agraria.org/; http://www.ansi.okstate.edu/breeds/). The classification of areas into tropical and warm and temperate countries was performed according to the following classification (http://aragonbilingue.educa.aragon.es/frances/wp-content/uploads/2010/01/climatsterre.pdf). Warm climate is composed of equatorial climate (Amazonia, some African regions), tropical humid (some African regions, West Indies, some South American regions), desert climate (some African regions, Asia, Arabia) and monsoon climate (Southeast Asia, India, etc.).
Diets were diverse. The majority was mixed diets (80%); the rest were exclusively forage-based diets. Forages were also diverse: green or hay grass (54%); straw (30%); tree foliage (7%); and hulls (4%). More than 80 plant species were used as feed. Concentrates were generally composed of conventional ingredients such as barley, corn, wheat bran, rice bran, proteaginous seeds and oilseeds (soya, groundnut, peas, sunflower, etc.). Unconventional resources (carob pulp, chicken litter, cassava chips, etc.) were also used as supplements.
Estimations, calculations and encoding
Some estimates were applied when data were lacking in the publications and when good predictors were available. Thus, when the OM content and OMd were lacking, whereas DM digestibility was measured, they were estimated from the measured DM multiplied by 0.9 and 1.05, respectively. These last two values were derived from analyses of databases including feeding trials conducted with temperate and tropical feed. Otherwise, the MEI was predicted from digestible organic matter intake (DOMI) by the regression equation obtained on a large dataset extracted from the database RUMENER, which pooled calorimetric measurements for sheep, goat and cattle (Sauvant and Giger-Reverdin, unpublished).
MEI=−2.03+4.03 DOMI (n=975, R 2=0.99, r.s.d.=11.30); r.s.d. is the residual standard deviation
Publications were systematically coded to distinguish animal species and the corresponding genotypes. Beyond this a priori encoding, a posteriori encodings based on statistical analyses were performed to identify the experiments with a large intra-experimental variation of dietary energy (over five points of variation in OMd), protein levels (over 3%), NDF level (over 5%) and percentage of concentrate (over 20%). This approach was complemented by a statistical method based on the study of the residuals obtained from an analysis of variance of the quantitative factors (OMd, CP levels and NDF levels), including the effect publication as the explanatory factor. These standardised residuals were submitted again to a second ANOVA, including the publication effect. The experiments that had a value greater than the standard error of the model residue were then selected. A coding was performed to identify publications for which data varied for the following criteria: CP content, NDF, organic matter digestibility (OMd) and percentage of concentrate. These codes allowed the identification of several sub-databases used depending on the objective, as stated by Sauvant et al., 2008. Such an approach of intra-publication analysis of animal response has already been used by Loncke et al. (Reference Loncke, Ortigues-Marty, Vernet, Lapierre, Sauvant and Nozière2009) and Nozière et al. (Reference Nozière, Glasser and Sauvant2011).
Statistical analyses
Animal responses were calculated through intra-publication regressions using variance–covariance analysis. In the first step, statistical analysis was carried out independently for each animal species to test the difference between genotypes, sexes, potential for growth and age. In particular, GLM analyses were conducted to study the response of ADG or nitrogen excretion to MEI (MJ/kg LW0.75), DCP (g/kg LW0.75) and nitrogen intake (NI g/kg LW0.75). The effects mentioned above were not significant and accordingly they were not considered in the following steps of the meta-analysis. The databases of sheep, goats and cattle have been pooled into a single meta-database.
These meta-analyses were performed following scrupulously the recommendations of Sauvant et al. (2008) using Minitab software (Minitab® 15.1.30.0., 2007). The following statistical model was used to fit the data:
 $$Y_{{ij}} =B_{o} {\plus}EXP_{i} {\plus}B_{1} \;X_{{ij}} {\plus}B_{i} \;X_{{ij}} {\plus}B_{2} \;X_{{ij^{2} }} {\plus}e_{{ij}} $$
where Y ij is the explained variable, B o the intercept, EXP i the qualitative effect of experiments, species on the intercept, B 1 the coefficient of linear regression of the covariable, B i the effect of species on the slope of the regression (interaction covariable×species), B 2 the coefficient of quadratic effect of the covariable and e ij the random residuals. When alone, the experiment effect was treated as a fixed one, knowing that it can include influences of factors.
Results
Descriptive statistics of variables in the database
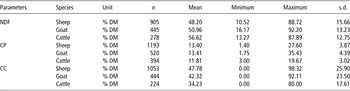
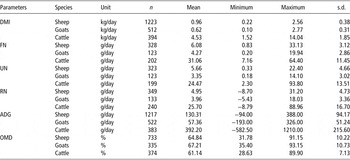
The main statistics of the variables of the database are presented in Tables 1 and 2. Irrespective of the animal species, large variations of dietary NDF and CP, which constitute limiting factors under tropical and warm conditions, were observed among treatments. For all animal responses, there was no significant difference between genotypes. A classical negative correlation was observed between CP (% DM) and NDF (% DM).
Statistical description of the dietary variables (% of DM) and percentage of concentrate in the ration in the database for ruminants in tropical and warm climates

DM=dry matter; CC=concentrate; n=number of treatments.
Statistical description of animal performance in the database

DMI=dry matter intake; FN=faecal nitrogen; UN=urinary nitrogen; RN=retained nitrogen; ADG=average daily gain; OMD=organic matter digestibility; n=number of treatments.
CP (% DM)=20.29 (±0.51)−0.14 (±0.01) NDF (% DM) (n=1616, nexp=240, R²=0.83, r.s.d.=1.85, nexp=number of experiments)
DMI
Effect of NDF content on DMI
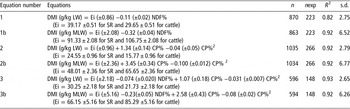
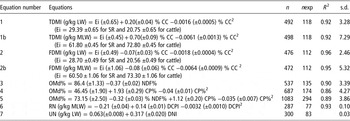
Only the publications in which the NDF content between treatments varied beyond the value of 5% DM were included. The intra-experimental relationships between dietary NDF and DMI were negative and are presented in equations (1) and (1b) (Table 3). A significant difference between small ruminants (sheep+goats) and cattle was observed in the intercept (P<0.01). The ranking of the species was inversed according to the power of live weight (LW). In contrast, for each equation, no significant difference was observed in the slope, showing parallel responses for the three animal species.
Influence of CP (% DM) and NDF (% DM) on intake of sheep, goats and cattle fed with mixed diets in warm areas

n=number of treatments; nexp=number of experiments; s.d=standard deviation; SR=small ruminants; DMI=dry matter intake; Ei=coefficient of the intercept; LW=live weight; MLW=metabolic live weight=LW0.75.
Effect of CP content on DMI
Only the publications in which the CP content between treatments varied over 3% DM were included. Dietary CP had a significant and quadratic effect (P<0.01) on DMI. Whatever the power unit of the LW, no significant difference was observed between sheep and goats. Therefore, their data were pooled. Moreover, there was no significant interaction between species and the linear component of CP. The ranking of the small ruminants and cattle was reversed according to the power of LW used, with a significant difference between the small ruminants and cattle in the intercept (equations (2) and (2b): Table 3). The use of CP%DM and NDF%DM in the same model can ameliorate the precision of the model. For these analyses, we used the publications in which CP and NDF contents between treatments varied simultaneously over 3% DM and 5% DM for CP and NDF, respectively. The r.s.d. were lower when CP and NDF were combined.
Effect of percentage of concentrate on DMI
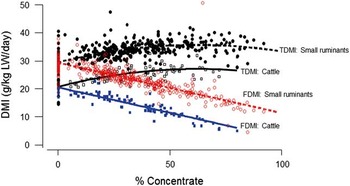
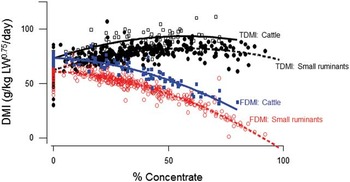
Only the experiments where forage was distributed ad libitum and where the proportion of concentrate varied (>20% between treatments) were used for this analysis. The percentage of concentrate had a quadratic and significant (P<0.01) effect on total dry matter intake (TDMI) and forage dry matter intake (FDMI), with a similar response between species (equations (1), (1b), (2), and (2b): Table 4). The maximum value of DMI was obtained with 60% of concentrate (Figures 1 and 2).
Influence of percentage of concentrate in the ration on dry matter intake (DMI) (g/kg LW1). Closed circles and dotted lines indicate total dry matter intake (TDMI) of small ruminants; open squares and solid black lines indicate TDMI of cattle; dotted red lines and open circles indicate forage dry matter intake (FDMI) of small ruminants; and solid blue lines and squares indicate FDMI of cattle. (TDMI and FDMI are total and forage dry matter intakes). Y-values are corrected for the experiment effect.

Effect of percentage of concentrate in the ration on dry matter intake (DMI) (g/kg MLW=LW0.75). Closed circles and dotted lines indicate total dry matter intake (TDMI) of small ruminants; open squares and solid black lines indicate TDMI of cattle; dotted red lines and open circles indicate forage dry matter intake (FDMI) of small ruminants; and solid blue lines and squares indicate FDMI of cattle. Y-values are corrected for the experiment effect.

Influence of percentage of concentrate (% CC), CP (% DM) and NDF (% DM) on intake, total tract digestibility and nitrogen balance for sheep, goats and cattle fed with mixed diets in warm areas

n=number of treatments; nexp=number of experiments; SR=small ruminants; DMI=dry matter intake; FDMI=forage dry matter intake; TDMI=total dry matter intake; CC%=percentage of concentrate; OMd=organic matter digestibility; DCPI=digestible CP intake; RN=retained nitrogen; Ei=coefficient of the intercept; LW=live weight; MLW=metabolic live weight=LW0.75, UN=urinary nitrogen; DNI=digestible nitrogen intake.
OMd
Effect of NDF and CP on OMd
A linear negative effect of NDF and a positive quadratic effect of CP were observed on OMd without any difference between species (equations (3) and (4), Table 4). According to this equation, the theoretical maximum OMd was achieved at the level of 24% CP. The marginal response of OMd declined linearly as a function of CP; thus, it was further marked for low CP content, for instance, when CP=5% DM, dOMd/dCP=1.53, whereas when CP=20% DM, dOMd/dCP=0.33. In order to go further in the interpretation and integration of data, all the data were pooled and treated with the three above-mentioned covariables: NDF%; CP%; and CP%2.The intra-experimental generic regression is given in equation (5) (Table 4). The relationship between chemical composition and DMI indicated that the equation between OMd and chemical composition includes a confounding effect of both chemical composition and intake level.
Growth performance
Effect of MEI on growth performance
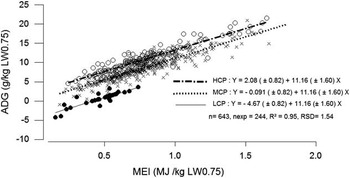
The effect of MEI on ADG has been tested using only publications in which OMd varied largely (>5% between treatments). There is a relationship between the digestibility of organic matter and energy intake for diets supplied ad libitum. To take into consideration the effect of MEI independently of protein and to check for any interaction between energy and protein, the data were split according to three levels of CP (% DM) based on the CP requirement for maintenance and whole growth and diet quality. The three classes of %CP were low (0 to 6.99%: LCP), medium (7 to 14.99%: MCP) and high (>15%: HCP). For the three classes, the ADG increased linearly with increasing MEI, without any difference between species (Figure 3). There was a tendency towards a significant difference between the three classes in the intercept (P=0.02), but not in the slope (P=0.7). At the level of 0.0243 MJ/kg LW0.75, mean of the values of ME requirement of cattle and small ruminants (Salah et al., Reference Salah, Sauvant and Archimede2014), the ADG were of 2.35, 0.18 and −4.39 g for HCP, MCP and LCP, respectively.
Effect of metabolisable energy (ME) intake on average weight gain. Dotted lines and open squares indicate high CP (HCP); solid lines and crosses indicate medium CP (MCP); and dotted lines and closed circles indicate low CP (LCP). Y-values are corrected for the experiment effect.

Effect of digestible CP (DCPI) on growth performance
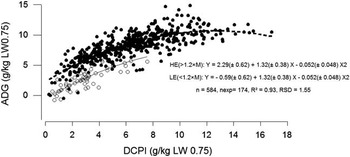
To take into consideration the effect of DCPI independently of energy and to check again whether there was any effect of energy×protein interaction on ADG, we chose four levels of energy by dividing DOMI by 23 g/kg LW0.75, which approximately corresponded to the maintenance requirements (Institut Nationale de la Recherche Agronomique (INRA), 1989). The four levels of energy were very low energy (LE−−: <0.99×maintenance), low energy (LE−: from 1 to 1.2×maintenance), medium energy (ME+−: 1.2 to 1.4×maintenance) and high energy (HE+>1.4×maintenance). For the four classes, ADG increased quadratically with increasing DCPI, without any difference between species (Figure 4). Statistical analysis indicated that there was no significant difference neither for the intercept (P>0.05) nor for the slope (P>0.05) between the very low energy group and low energy group. Therefore, the data were pooled together in the same group (LE). Moreover, there was no significant difference neither for the intercept (P>0.05) nor for the slope (P>0.05) between the medium energy and high energy groups. Therefore, their data were pooled in the same group (HE). At DPCI=0, a negative ADG (−0.59 g/kg LW0.75) was observed with LE, whereas the HE class had a small positive ADG (2.29 g/kg LW0.75). When the supply was covering the maintenance requirements, considered as equal to 2.85 g/kg LW0.75 (mean value of the three species according to Salah el al., Reference Salah, Sauvant and Archimede2014), the ADG was positive and equal to 6.47 and 3.56 g for the HE and LE groups, respectively. Otherwise, the marginal animal responses to increased DCPI were not significantly different between LE and HE; therefore, the two responses were similar, suggesting that there was no energy×protein interaction (P=0.54).
Effect of digestible CP intake (DCPI) on BW gain. Dotted lines and closed circles indicate a level of energy that is above-the-medium to high (AME-H); solid black lines and open circles indicate a level of energy that is low to below-the-medium (L-BME). Y-values are corrected for the experiment effect.

The marginal ADG response was 1.21 g/g DCPI when DCPI was low (1.0 g/kg LW0.75). It decreased to 0.59 and 0 g/g DCPI when DCPI was increased to 7.0 g/kg LW0.75 and 12.7 g/kg LW0.75, respectively. In contrast to energy, the maximum ADG was within the range of the observed data of DCPI (for group HE). The range of DCPI was much smaller for the LE group than for the HE group, showing that there was no experiment exploring high DCPI combined with low energy.
Nitrogen utilisation
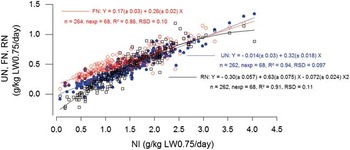
Effect of NI on faecal nitrogen (FN), urinary nitrogen (UN), and retained nitrogen (RN). For this part, only studies dealing with variation in nitrogen content (>3% CP between treatments) were considered. The statistical analysis indicated that FN and UN increased linearly with increasing NI, without any difference between species (Figure 5). The slope was higher for UN than for FN, and the value of the intercepts was not significantly different from zero for FN and was equal to 0 for UN. RN increased quadratically with increasing NI. Therefore, when NI=0, the marginal response of dRN/dNI was high (0.63 g/g, in Figure 5), and when NI increased dRN/dNI decreased (for instance, 0.37 g/g when NI=3.0 g/kg LW0.75). The large range of dietary N content of the dataset allowed us to explore the value of the minimum excretion of UN, which could be retained to assess the metabolic losses of N in urine that could be compatible with life. The intra-experimental equation between UN (g/kg LW) and digestible nitrogen intake (DNI, g/kg LW) is indicated in equation (7), Table 4. When DNI=0, which correspond to a minimum level of supply to stay alive, the excretion of UN was 0.063±0.008 g/kg LW.
Intra-experimental influence of nitrogen intake (NI) on urinary nitrogen (UN), faecal nitrogen (FN) and retained nitrogen (RN). Y-values are corrected for the experiment effect.

Discussion
This paper presents an approach complementary to that of the companion paper on requirements, calculated using the same database (Salah et al., Reference Salah, Sauvant and Archimede2014). With these two papers, we chose to use two different approaches (inter-publication analysis for nutrient requirements and intra-publication analysis for animal responses). In the present paper, the statistical treatment of the variations within experiments, pooled in groups having similar targets, allowed us to calculate responses of animals to the corresponding feeding practices. As far as we are aware, such a combined approach has never been systematically performed through meta-analyses. In the companion paper (Salah et al., Reference Salah, Sauvant and Archimede2014), the within-study variations were ignored and only the variations across publications were considered and treated, assuming that they were mainly caused by experimental contexts, particularly animal attributes corresponding to various levels of nutritional requirements (LW, potential for growth, physiological stage of growth, etc.).
DMI
Effect of NDF content on DMI
The negative effect of NDF on DMI is classically explained by the fill value of fibre, which is linked either to the limitation of chewing time, to a maximum of ~900 to 1000 min/day, or to its negative effect on passage rate (Assoumaya et al., Reference Assoumaya, Sauvant and Archimède2007). Recently, Meyer et al. (Reference Meyer, Hummel and Clauss2010) indicated that, at the level of 50% NDF, DMI (g/kg LW0.75) was 74.8 and 91.4 for small ruminants and cattle, respectively. At present, the respective values are 75.3 and 90.7 g/kg LW0.75. Arelovich et al. (Reference Arelovich, Abney, Vizcarra and Galyean2008) indicated a decrease of 0.21 g DMI/kg LW0.75 per unit of NDF. The value was 0.32±0.040 g DMI/kg LW0.75 per unit of NDF in this study. Compared with all the other cited studies, the present work took into account much more data and provides more reliable values.
Effect of dietary CP content on DMI
The effect of CP content on DMI has been studied before (Fenderson and Bergen, 1976). The effect of CP is not linear, and DMI reaches a plateau when CP exceeds a threshold of ~15% of DM with a maximum of intake obtained at the level of 17% CP, with parallel responses for sheep, goats and cattle. These results are consistent with several authors such as Roffler et al. (Reference Roffler, Wray and Satter1986) who found that the marginal increase in DMI equated to nearly 900 g at 12% CP, and that the increase in DMI was only 40 g/day with CP of around 18%. The increase in DMI up to the level of 15 to 17% CP can be explained by an increased rate of digestion of OM in the rumen (Assoumaya et al., Reference Assoumaya, Sauvant and Archimède2007) and by the better nitrogen status of the animals and microbes in this range of CP content.
The plateauing in DMI when the CP content exceeded 17% was likely because the potential for growth was reached. Furthermore, the fact that the intra-publication statistical analysis indicated a negative relationship between CP and NDF contributed indirectly to the influence of CP on DMI. However, the association of NDF and CP in the same prediction equation allowed us to achieve a slightly better precision than with either CP or NDF alone, as already suggested by Demarquilly and Andrieu (Reference Demarquilly and Andrieu1992) and Assoumaya et al. (Reference Assoumaya, Sauvant and Archimède2007). Estimation of rumen undegradable and degradable proteins may allow further explanation of the DMI response to increasing protein content and the simultaneous decrease in NDF. This global approach would have an advantage compared with the classical traditional method of fill unit mainly formatted for roughages. The fill value of concentrate is inferred from the fact that there is existence of digestive interactions in mixed diets.
Effect of percentage of concentrate on DMI
Total DMI increased with percentage of concentrate, but the marginal response tended to diminish until a level of concentrate of ~60%. Similar results have been previously reported (INRA, 1989; Nousiainen et al., Reference Nousiainen, Rinne and Huhtanen2008), where a quadratic effect of concentrate level on DMI was observed in dairy cows. The first possible explanation for the decrease in DMI at very high levels of concentrate is the fact that the potential for growth was reached and, consequently, the regulation of DMI became progressively more metabolic. Beyond this aspect, with high levels of concentrate, there is classically a radical alteration in the profile of the microbial fermentation in the rumen, with an increase of glucogenic precursors such as propionate and sometimes lactate (Allen, Reference Allen2000).
OMd
The present meta-analysis demonstrated a quadratic effect of CP concentration on OMd and corroborated with results of previous studies. Nousiainen et al. (Reference Nousiainen, Rinne and Huhtanen2008) indicated that OMd marginal response decreased from 0.41 to 0.21 g/kg when dietary CP concentration increased from 130 to 180 g/kg of DM in dairy cows. In the present study, on all types of ruminants, the corresponding values were 0.89 and 0.49 g/kg of DM, respectively. Furthermore, in the Bovidig database on cattle used to calculate the new INRA feed unit for ruminants (Sauvant and Nozière, Reference Sauvant and Nozière2013), the intra-experimental relationship between OMd and CP was very close to the present one and slightly more precise (OMd=50.7+1.88 CP−0.045 CP², n=209, number of experiment=80, r.s.d.=2.30). The positive effect of CP on OMd, despite an increase in DMI as seen before, was likely the outcome of an increase in the activity of rumen microorganisms allowed by a greater N availability (Agle et al., Reference Agle, Hristov, Zaman, Schneider, Ndegwa and Vaddella2010). The combined effects of dietary CP on DMI and OMd result in a large increase in DOMI, and therefore in ME intake as a response to dietary CP, which was also partly the outcome of the simultaneous increase of NDF as CP decreased.
Effectively, as frequently observed, there was a negative linear relationship between NDF content and OMd as indicated by Assoumaya et al. (Reference Assoumaya, Sauvant and Archimède2007), who studied only ration based on forage or containing <20% of concentrate. It appeared that OMd of sheep, goat and cattle responded similarly to increased NDF content. In contrast, it has been observed previously that goats and cattle were likely less sensitive than sheep, when receiving poor quality food (Dulphy et al., Reference Dulphy, Jouany, Rosset-Martin and Thériez1994).
Growth performance
Effect of MEI on growth performance
The present meta-analysis demonstrated a linear effect of MEI on ADG (P<0.10), with parallel responses for the three animal species, which is an original result. The mean response of ADG was 10.1 g/MJ ME. Mean ADG response values of 15.1 and 16.2 for growing lambs, 9.9 for goats and 15.6 g ADG/MJ MEI for cattle, respectively, have been previously established using less data by Mahgoub et al. (Reference Mahgoub, Lu and Early2000), Lu and Potchoiba (Reference Lu and Potchoiba1990) and Medina et al. (Reference Medina, Ku-Vera and Magana-Monforte2010).
It has been possible to split the data into three groups according to the level of dietary CP. There was no interaction between energy and protein content on animal growth. As such additivity between energy and protein content for growth on a large number of data is original. At the same level of MEI, a higher ADG was observed with HCP level, followed by MCP and LCP levels. Lammers and Heinrich (Reference Lammers and Heinrichs2000) fed heifers ration with LP, MP and HP and reported that ADG was improved by 9% in heifers fed a diet containing HP-to-ME ratio. The same results were observed in sheep and goats (Hwangbo et al., Reference Hwangbo, Choi, Kim, Son, Park, Lee and Jo2009; Sultan et al., Reference Sultan, Javaid and Aslam2010). Increasing dietary CP levels causes a change in the process of intake and digestion in the rumen and also improves absorption of by-pass proteins that contribute to metabolisable protein available for growth (Nolan and Leng, Reference Nolan and Leng1983). These changes improve the energy balance, allowing more nitrogen to be accreted and increasing ADG (Kioumarsi et al., Reference Kioumarsi, Korshidi, Zahedifar and Seidavi2008).
Effect of DCPI on growth performance
Our results indicate the existence of a quadratic and positive effect of DCPI on ADG, which was confirmed by the quadratic effect of DCPI on RN. The maximum response of ADG was obtained at ~150 g/kg DM of CP. Our results are globally in agreement with other studies (Titi et al., Reference Titi, Tabaa, Amasheh, Barakeh and Daqamseh2000). With much fewer treatments, Haddad et al. (Reference Haddad, Nasr and Muwalla2001) observed in growing lambs that 16% CP was the optimum level to promote growth.
The increase in protein intake was accompanied by an increase in the proportion of protein that escaped ruminal fermentation, resulting in an increased amount of protein reaching the abomasum and small intestine to be absorbed as amino acids, which subsequently improved animal growth (Shahzad et al., Reference Shahzad, Tauquir, Fayyaz, Niza, Sarwar and Tipu2011). As for MEI supply, there was no interaction between the DCPI and MEI, confirming the additivity between the two supplies for growth. At the same level of DCPI, a higher ADG would have been observed with a high level of energy. The increase of DCPI caused the same ADG responses in the HE and LE groups. A high ADG was observed for HE level compared with LE level at the same level of DCPI.
Nitrogen utilisation
Numerous researchers have reported that increasing NI is accompanied by an increase in FN and UN (Moore et al., Reference Moore, Goetsch, Luo, Owens, Galyean, Johnson, Sahlu and Ferrell2004; Yan et al., Reference Yan, Frost, Agnew, Binnie and Mayne2006). Previous results obtained by the analysis of a dataset from 25 studies indicated that the slope of the linear relationship between NI and FN or UN varied from 0.20 to 0.39 and 0.38 to 0.68, respectively (Castillo et al., Reference Castillo, Kebreab, Beever and France2000; Huhtanen et al., Reference Huhtanen, Nousiainen, Rinne, Kytola and Khalili2008; Weiss et al., Reference Weiss, Willett, St-Pierre, Borger, McKelvey and Wyatt2009; Kebreab et al., Reference Kebreab, Strathe, Dijkstra, Mills, Reynolds, Crompton, Yan and France2010). The corresponding values obtained in our studies were 0.26 for FN and 0.32 for UN. This difference can be attributed to the age of animals. Our results were obtained in growing ruminants, whereas previous authors worked with adult animals (dairy cows).
The new French unit system has proposed to quantify this loss by calculating the rumen protein balance (RPB) in diet formulation (Sauvant and Nozière, Reference Sauvant and Nozière2013). This RPB is the major criterion to predict UN excretion. The increase in UN level with increased NI can be attributed to the high blood and plasma urea nitrogen levels, which cause high nitrogen clearance rates of the kidneys and increase urea excretion via urine (Kohn et al., Reference Kohn, Dinneen and Russek-Cohen2005). A debate is remaining about the minimum loss of N in urine, which can be adopted as endogenous loss in protein unit system. Our debate allowed to predict the UN level that corresponds with DNI=0, a situation that, contarily with NI=0, allowed survival. For this reason, the proposed value of 0.063 g/kg LW UN loss has been proposed recently for the new protein unit system in France (Sauvant et al., Reference Sauvant, Cantalapiedra-Hijar and Nozière2014). Some authors noted a linear relationship between NI and RN (Archibeque et al., Reference Archibeque, Freetly and Ferrell2007), and others noted a quadratic relationship with a decreasing marginal effect (Zanton and Heinrichs, Reference Zanton and Heinrichs2008). This suggests that the intake was in excess of the animals’ capacity to utilise nitrogen efficiently.
Nitrogen balance can vary with the method used for collecting and preserving urine and faeces (Isaksson and Sjogren, Reference Isaksson and Sjogren1967). Nitrogen retention can differ between slaughter method and feeding. Rattray and Joyce (Reference Rattray and Joyce1970) indicated that the balance method appeared to overestimate N retention compared with the slaughter method. The data introduced in our analysis were based only on the feeding and balance technique.
Conclusions
This meta-analysis yielded new information on multicriteria responses of growing ruminants reared under warm conditions and their comparison with those reared under temperate conditions using the same database. This approach is original in the context of the development of agro-ecology in livestock research to optimise various functions, both productive and non-productive. This approach is also original from a nutritional point of view because it is complementary with the conventional approach based on estimation of requirements. This last one has limitations in the context of tropical areas where the objective is often to valorise available biomass rather than balancing diets. This analysis also shows the limitations of conventional experiments often built to analyse one factor, one function, rather that analysing multiple responses of the animal. This last point is a challenge for the future. This study, comparing animal species, also questions the relevance of basis of expression of input and requirements (LW v. metabolic weight).
Acknowledgement
This work is partly funded by SYSTALI project of the National Institute of French Agricultural Research (INRA).