I. INTRODUCTION
Nanomaterials are attracting increasing interest among worldwide research groups and various industries, due to their extraordinary thermal, electrical, magnetic, mechanical, and optical properties, which are different from their bulk counterparts. Reference Stranz, Waag and Peiner1–Reference Maxwell, Emory and Nie5 Over the past several decades, we have witnessed their broad application in nanodevices such as nanosensors, nanoresonators, nanoactuators, nanooscillators, and nanogenerators. Reference Cui, Wei, Park and Lieber6–Reference Wang and Song10 Cracks may nucleate in nanomaterials during the fabrication of nanodevices. Moreover, mechanical or thermal loadings applied to nanodevices may induce crack nucleation in nanomaterials. Once nucleated, cracks may arrest or propagate in a solid material, depending on the loading condition as well as on the crack growth resistance (R), which represents the material's resistance to crack growth. Hence, for maintaining the reliability of nanodevices, a comprehensive knowledge of the R-curve of nanomaterials is essential.
Many techniques are used in experiment to evaluate the R-curve of engineering materials, including compact tension, single-edged-notched tension, and three-point bending. However, it is a very challenging task to carry out such experiments on nanomaterials because of their extremely small size. In addition, R is calculated by equations derived on the base of continuum mechanics, which assumes that materials are continuous. This theory is valid on the macroscopic scale. However, when material size comes to nanoscale, its validity is debatable because of the significant role of lattice discreteness.
Atomistic simulation is a useful method for investigating mechanical responses of materials. Many breakthrough observations have been made using this technique. Reference Buehler, Abraham and Gao11,Reference Diao, Gall and Dunn12 In particular, atomistic simulations can capture the discreteness of nanomaterials and the essential process of bond rupturing associated with a crack extension. Consequently, they have been broadly utilized in the examination of fracture behaviors of various materials. Reference Buehler, Abraham and Gao11,Reference Cui and Beom13–Reference Kalia, Nakano, Omeltchenko, Tsuruta and Vashishta17 Despite its usefulness, however, atomistic simulation has rarely been used to determine the R-curve of nanomaterials.
This study determines the R-curve of a single-crystal Al-nanoplate under tension through atomistic simulations. The stiffness evolution of the simulation system was obtained from unloading curves. To formulate the relationship between stiffness and crack length, Al-nanoplates with different crack lengths were simulated and the corresponding stiffness for each nanoplate was evaluated. Then, the relation between stiffness and crack length was obtained through a regression analysis. This relationship was used to determine the evolution of crack length of the simulation system. Subsequently, through an energy analysis, R and the critical strain energy release rate at the onset of crack propagation were calculated.
II. SIMULATION SETUP AND PROCEDURE
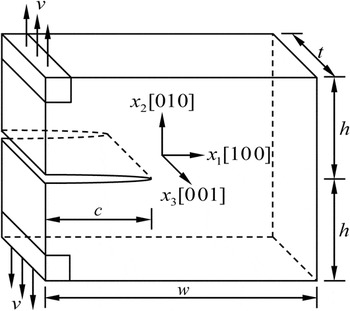
Figure 1 shows the geometry of the simulation model for a face-centered cubic single-crystal Al-nanoplate. Here the x 1, x 2, and x 3 axes of the atomic model were oriented along the [100], [010], and [001] directions, respectively. An edge crack of length c along the x 1–x 3 plane, with a crack front aligned in the x 3 direction, was inserted into the model. Periodic boundary conditions were imposed only in the x 3 direction, and free boundary conditions were used in the x 1 and x 2 directions. The model dimensions in the x 1, x 2, and x 3 directions were w = 50a, 2h = 50a, and t = 5a, respectively, where a = 0.405 nm was the lattice constant of Al. To preclude spurious size effects, simulations were repeated using a larger model with t = 10a. Identical results were obtained for the larger model, which validated that the current model was sufficiently large to yield reliable results. Simulation models of similar dimensions have been used in previous studies to investigate the fracture behavior of Al. Reference Baker and Warner18,Reference Krull and Yuan19 Crack length affects both the deformation mechanism and the critical load for crack propagation of a solid. Reference Cui and Beom13,Reference Ippolito, Mattoni, Pugno and Colombo20 The crack length c was set to 25a to eliminate crack size effects. Reference Ippolito, Mattoni, Pugno and Colombo20
The geometry of the atomic model for a single-crystal Al-nanoplate containing an edge crack of length c. The tensile displacement ν was applied to boundary regions located at the left upper and lower corners.

The accuracy of simulation results relies mainly on the reliability of the interatomic potential used to describe interactions between atoms. The embedded-atom method potential, Reference Mishin, Farkas, Mehl and Papaconstantopoulos21 which was parameterized by optimized systematic fitting to a large database of both experimental and ab initio data, was used to simulate Al. This potential has been widely used to investigate mechanical properties and deformation mechanisms of Al, and outcomes have been consistent with experimental and ab initio simulation results. The stress component of the simulation system was calculated based on the virial stress, Reference Tsai22 which is equivalent to the continuum Cauchy stress. Reference Subramaniyan and Sun23
Molecular statics (MS) simulations were conducted at 0 K by using an open-source molecular dynamic (MD) program called the large-scale atomic/molecular massively parallel simulator (LAMMPS). Reference Plimpton24 The MS technique was used to avoid extremely high strain rates intrinsic to MD simulations. Reference Farkas15 The lowest strain rate that can be achieved through a MD simulation is much higher than the bulk experimental loading rate. Spurious phenomena may arise from high loading rates. MS simulations have been broadly utilized to investigate the crack growth behavior in materials. Reference Cui and Beom13–Reference Kalia, Nakano, Omeltchenko, Tsuruta and Vashishta17 The evolution of an atomistic configuration was visualized using atomeye, an atomistic visualization program. Reference Li25
An edge crack was created in the simulation system by blocking interactions between atoms above and below crack surfaces. Reference Cui and Beom13,Reference Zhuo and Beom14,Reference Ippolito, Mattoni, Pugno and Colombo20 The conjugate gradient method was used to relax the system to the equilibrium state. Then the tensile displacement ν was applied to boundary regions located in left upper and lower regions, followed by a relaxation process. Each boundary region was of size a × a × 5a. This displacement/relaxation procedure was repeated until the edge crack propagated a long distance within the single-crystal Al-nanoplate. If the increment of ν per loading step is too small, the calculation burden is heavy, whereas if the increment is too large inaccurate results may be obtained. To determine the appropriate increment for ν, simulations were conducted several times with different values of increment, and simulation results converged when the increment was decreased to 5 × 10⁻⁵ h. Therefore, the increment of 5 × 10⁻⁵ h was used to mitigate calculation burdens without sacrificing accuracy.
III. RESULTS
A. The tensile stress–displacement curve
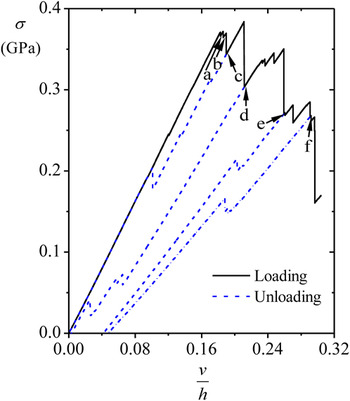
Figure 2 shows the tensile stress (σ) of the simulation system versus the normalized tensile displacement (ν/h). Here σ was defined as the average of the σ22 component of the atomic stress over the whole simulation volume. As shown in Fig. 2, σ increased linearly with an increase in ν/h until there was a slight decline in σ. A further increase in ν/h produced the second slight decline in σ, beyond which there were many sharp declines. After each decline, σ increased with an increase in ν/h until the next decline. The points a and b marked in Fig. 2 are the stopping points for the first two slight declines, and the points c to f in Fig. 2 correspond to stopping points for sharp declines.
The tensile stress (σ) of the Al-nanoplate as a function of ν/h. σ is defined as the average atomic stress (σ22) over the entire volume of the simulation system. Six different points (from a to f) corresponding to different ν/h levels are marked in the figure.

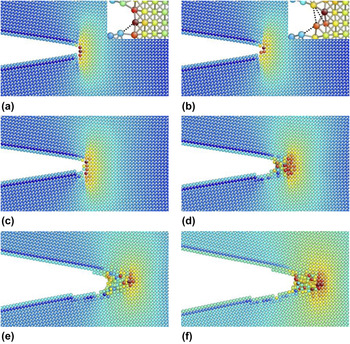
The manner in which the atomic configuration at a crack tip responds to the applied load is of considerable importance because it controls the deformation mechanism of a solid. Reference Farkas, Duranduru, Curtin and Ribbens26–Reference Kimizuka, Kaburaki, Shimizu and Li28 Therefore, to elucidate the deformation mechanism of Al-nanoplates behind the declines in σ, snapshots depicting the evolution of the crack tip configuration are shown in Fig. 3, with Figs. 3(a)–3(f) corresponding to the points a to f in Fig. 2. As shown in Figs. 3(a) and 3(b), the first and second slight declines in σ were associated with the snap of one and two bonds at the crack tip, respectively. The rupture of these three bonds led to the slight blunting of the crack tip but not to crack propagation. As shown in Figs. 3(b) and 3(c), many bonds ruptured simultaneously near the crack tip at point c, resulting in the first sharp drop in σ. Crack propagation was considered to start from point c. Upon further loading, the edge crack propagated along the [100] direction, and an amorphous zone nucleated at the crack tip, as shown in Fig. 3(d), inducing the second sharp decline in σ. The amorphous zone grew in size and moved along the [100] direction when ν/h increased from d to e, and a further increase in ν/h had no effect on the size of the amorphous zone. The movement of the amorphous zone in conjunction with crack propagation was responsible for subsequent sharp declines in σ.
Atomic configurations of the crack tip region. Atoms are colored according to the σ22 component of the atomic stress, with blue denoting low stress and red representing high stress. (a)–(f) correspond to the points a to f in Fig. 2. For clarity, a close-up of the crack tip structure is presented in (a) and (b), where snapped bonds are marked by dashed lines. To determine whether a bond is broken, an empirical cut-off distance of 0.35 nm is used, which is halfway between the first and second neighbor shells of Al. Reference Stukowski and Albe29

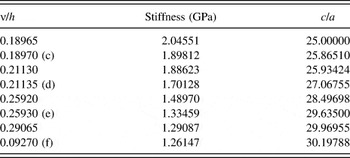
Each sharp decline in σ was correlated with crack propagation for the possible reduction in the stiffness of the Al-nanoplate. To clearly demonstrate the effects of crack propagation on this stiffness, the strained Al-nanoplate was unloaded at the starting and stopping points of each sharp decline in σ, and stiffness was calculated from the initial linear stage of the unloading curve. Here the slope of the σ–ν/h curve was considered the stiffness of the system. Each sharp decline in σ was accompanied by a reduction in stiffness, as shown in Table I.
Stiffness and crack lengths corresponding to different normalized displacement (ν/h) values. c to f correspond to the points c to f in Fig. 2.

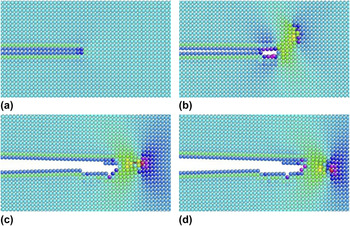
Figure 2 shows the unloading curves corresponding to c to f. In the case of unloading from c, the ν/h state recovered to its initial state when σ decreased to zero, indicating no plastic deformation before c. By contrast, when the system was unloaded at d to f, a permanent displacement remained as σ decreased to zero, indicating that the occurrence and movement of the amorphous zone were related to plastic deformation. In addition, the permanent displacement increased with crack propagation. Figure 4 validates these results by illustrating atomic configurations of the crack tip region corresponding to the zero-σ state obtained from unloading the system at c to f. As shown in Figs. 4(b)–4(d), some disordered atoms remained near the crack tip when the system was fully unloaded. On the contrary, in the case of unloading at c, the system recovered to its initial state [Fig. 4(a)].
Atomic configurations of the crack tip region corresponding to the zero-stress states, which are obtained from unloading the strained Al-nanoplate at the point c, d, e, and f in Fig. 2, respectively. Atoms are colored according to the σ22 component of the atomic stress. (a) Unloading at point c, (b) unloading at point d, (c) unloading at point e, and (d) unloading at point f.

B. The relationship between stiffness and the crack length
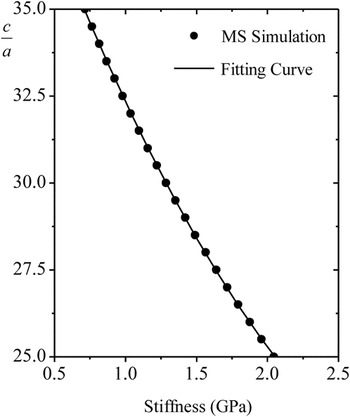
Because of the amorphous zone at the crack tip, it is difficult to identify the location of the crack tip, and therefore the traditional technique of evaluating the crack length by directly observing the crack tip configuration may not be appropriate. Therefore, a stiffness method was used to evaluate the crack length. MS simulations were conducted to formulate the relationship between the crack length and stiffness of an Al-nanoplate. Simulation systems with various crack lengths (from 25a to 35a with an interval of 0.5a) were constructed. The same displacement ν was applied to all simulation systems, and stiffness was calculated in the linear stage of the σ–ν/h curves. As shown in Fig. 5, a decrease in stiffness was associated with an increase in the crack length. A regression analysis of simulation results was conducted, and the following fitting curve was obtained:
 $${c \mathord{\left/ {\vphantom {c a}} \right. \kern-\nulldelimiterspace} a} = 1.5845{S^2} - 11.812S + 42.577\quad ,$$
where S indicates dimensionless stiffness equal to stiffness divided by 1 GPa. The fitting curve was in close agreement with the simulation results.
The dimensionless crack length c/a as a function of stiffness.

Given that the evolution of stiffness under tensile loading was obtained (Table I), the corresponding crack length was easily calculated from Eq. (1). Table I shows the crack length predicted by Eq. (1). In accordance with Fig. 3, each sharp decline in σ was associated with crack propagation.
C. Surface energy and the strain energy release rate
The energy required to form a unit surface area is defined as surface energy (γ). According to this definition, γ for a solid can be written as
 $$\gamma \left( c \right) = {1 \over 2}{{\Delta {E_0}\left( c \right)} \over {\Delta c}}\quad ,$$
where E 0 is the potential energy for the unit thickness of a system with no loading, ΔE 0(c) = E 0(c + Δc) − E 0(c), and Δc is the increment of crack length.
The strain energy release rate (G) is a measure of energy available for the unit increment of crack propagation. Reference Anderson30 Based on this definition, G for a solid can be expressed as
 $$G = - {{\Delta U\left( c \right)} \over {\Delta c}}\quad ,$$
 $$U\left( c \right) = E\left( c \right) - {E_0}\left( c \right)\quad ,$$
where U is the strain energy per unit thickness arising from the applied load, E is the total potential energy for the unit thickness of a loaded system, and ΔU(c) = U(c + Δc) − U(c). With Eqs. (2) and (4), Eq. (3) can be rewritten as
 $$G = - {{\Delta E\left( c \right)} \over {\Delta c}} + 2\gamma \left( c \right)\quad ,$$
where ΔE(c) = E(c + Δc) − E(c). According to conventional fracture mechanics, a crack extension initiates once G attains the critical value G c, which is the critical strain energy release rate, a measure of fracture toughness.
γ and G c for a single-crystal Al-nanoplate were determined through MS simulations. Two identical simulation systems were constructed, and an edge crack was inserted into both (one with a crack length of c and the other with a crack length of c + Δc). Subsequently, the two systems were relaxed to yield E 0(c) and E 0(c + Δc), respectively, and therefore ΔE 0(c) was obtained as 7.639 × 10⁻¹⁰ J/m. Here Δc was selected to be a, and c was equal to 25a. Substituting ΔE 0(c) and Δc into Eq. (2), γ was calculated as 0.943 J/m2, which is consistent with the findings of previous research. Reference Mishin, Farkas, Mehl and Papaconstantopoulos21 To obtain G c, both systems were loaded from the equilibrated state until an edge crack of length c started to propagate in the system. Here, E(c) and E(c + Δc) were recorded from MS simulations just before the initiation of crack propagation, and G c was then calculated from Eq. (5).
D. Evaluation of the R-curve
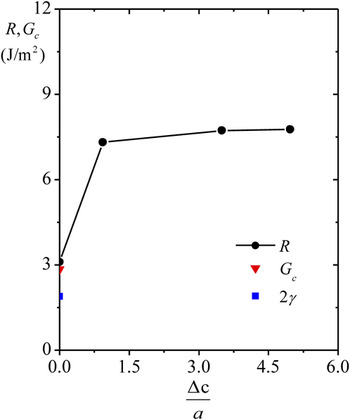
R is defined as the rate at which energy dissipates during the process of crack growth. Reference Eftis and Liebowitz31 Given the energy rate balance, G and R are equivalent at each instant of a crack extension. Therefore, Eq. (5) can be used to calculate R once E(c), E(c + Δc), and Δc were determined. Δc was extracted from Table I, and corresponding E(c) and E(c + Δc) were obtained through MS simulations. Figure 6 shows the numerical results for R as a function of the total amount of crack growth. For comparison, G c and the fracture toughness based on the Griffith criterion Reference Griffith32 (2γ) are inserted in Fig. 6. The initial point of the R-curve coincided with G c, potentially validating the proposed computational method for evaluating R. Here, R increased sharply during the initial stage of the crack extension, and the rising trend became more gradual with further crack growth. After the crack propagated by approximately 3a, R converged to a constant far exceeding 2γ. In addition, G c exceeded 2γ.
The R-curve of the Al-nanoplate. Δc is the amount of crack growth. For comparison purposes, the critical strain energy release rate at the initiation of the crack extension (G c) and the fracture toughness given by the Griffith criterion (G c = 2γ) are included.

IV. DISCUSSION
An amorphous zone near the crack tip was observed after the nucleation of crack propagation in a single-crystal Al-nanoplate. Similar crack tip amorphization phenomena have been reported to occur in
 $\left( {111} \right)\left[ {\bar 110} \right]$
,
Reference Baker and Warner18
 $\left( {110} \right)\left[ {\bar 112} \right]$
,
Reference Hung and Carter33
and
 $(1\bar 10)[110]$
(Ref. Reference White34) crack configurations. Here “()” and “[]” denote the crack plane and front, respectively. Similar to our work, in these crack configurations, an amorphous zone formed at the crack tip and it increased in size as the applied tensile loading was increased. However, the extending direction of the amorphous zone in the
 $\left( {111} \right)\left[ {\bar 110} \right]$
crack system was [110] direction, different from the [100] direction observed in this work. This divergence may be attributed to the difference in crack plane and front. In spite of being reported previously, its occurrence in the (010)[001] crack system has yet to be reported. Hogaland et al.
Reference Hoagland, Daw, Foiles and Baskes27,Reference Hoagland, Daw and Hirth35
and Nair et al.
Reference Nair, Warner and Hennig36
examined this crack system but observed the crack to behave in a brittle fashion. Because the size of the model in the direction of the crack front was only one-lattice parameter in their studies, plastic deformation was strongly inhibited, and therefore a brittle fracture was favored. Krull and Yuan observed that an edge crack with this orientation propagates in the form of void nucleation, growth, and coalescence.
Reference Krull and Yuan19
The inconsistency between this study's results and their findings may be due to the difference in the shape of the crack tip, the method of applying tensile loading, and the potential used to describe Al. The deformation mechanism of a cracked solid is strongly affected by the crack tip morphology.
Reference Beltz, Lipkin and Fischer37
In their study, the edge crack was created by removing five layers of atoms, whereas the present study considers an atomically sharp crack. In addition, the tensile displacement was applied to the whole simulation system in their study, while tensile loading was applied only to boundary regions in the present analysis. Furthermore, a different potential function was used in their simulations.
In the previous section, the R-curve of a single-crystal Al-nanoplate was observed to rise sharply in the initial stage of crack growth, and converge to a value far exceeding 2γ after crack propagation by a certain distance. Given the importance of the near-crack-tip process in governing the fracture behavior of a solid, Reference Farkas, Duranduru, Curtin and Ribbens26–Reference Kimizuka, Kaburaki, Shimizu and Li28 the results suggest that crack tip amorphization may play a key role in the rising trend in R and its sharp difference from 2γ. More specifically, the amorphous zone at the crack tip influences the R-curve trend through crack tip blunting, crack tip shielding, and plastic energy dissipation.
The derivation of the Griffith criterion is based on the assumption that the tip of a crack is atomically sharp. In practice, however, the crack tip is not always that sharp. According to previous theoretical analyses and experimental observations, the stress is less concentrated at a blunted crack tip such that the critical load for the onset of a crack extension can far exceed that predicted by the Griffith criterion, and the difference between them increases with an increase in the crack tip radius. Reference Krull and Yuan19,Reference Beltz, Lipkin and Fischer37,Reference Gómez and Elices38
It is well known that sources of internal stress in a solid can shield the crack tip from externally applied stress. As a consequence of this shielding effect, the actual driving force of the crack tip is less than that generated by the applied load, and therefore a load far exceeding the Griffith load is required to initiate crack growth. Reference Hoagland39 A representative example of such a source is dislocation. Many studies have demonstrated through experiments and atomistic simulations that a dislocation emitted from a crack tip can increase the fracture toughness of a solid to a value well above 2γ. Reference Farkas, Duranduru, Curtin and Ribbens26,Reference Gerberich, Huang, Zielinski and Marsh40 In addition, other types of defects such as phase transformations and microcracks may work to shield the crack tip. Reference Hoagland, Daw, Foiles and Baskes27,Reference Hoagland39 The amorphous zone may have a shielding effect on the crack tip and thus increase the R value of a solid.
The Griffith criterion is based on the balance between the strain energy stored in a cracked solid and the energy consumed in the formation of new crack surfaces. In the case of an ideally brittle fracture, this theory works quite well. For crack propagation accompanied by plastic deformation, however, this theory should be modified to account for the energy consumed by the plastic deformation. The critical load for the initiation of crack propagation can be increased by plastic dissipation to a level much higher than that expected based on the Griffith criterion. Reference Tvergaard and Hutchinson41 The amorphization behavior of the crack tip serves as a plastic deformation mechanism to increase the fracture toughness of a solid.
Because of the snap of the three bonds [Fig. 3(b)] near the crack tip, the crack was blunted to some extent, and therefore the initial point of the R-curve and G c far exceeded 2γ. The crack was further blunted after the onset of crack propagation [Fig. 3(c)], and huge amounts of energy were dissipated in the formation of the amorphous zone [Fig. 3(d)]. Because of synergistic effects of these two factors, R rose sharply from the first point to the second. Following the sharp increase, R increased more gradually from the second point to the third, which was triggered by the shielding effect of the amorphous zone and energy dissipation from the growth of the amorphous zone in size [Fig. 3(e)]. After the third point, R converged to a constant because there was no further growth in the radius of the crack tip and the size of the amorphous zone.
V. CONCLUSION
MS simulations were conducted to determine the R-curve of a single-crystal Al-nanoplate. The R-curve exhibited a marked upward trend and converged gradually to a constant far exceeding the fracture toughness provided by the Griffith criterion. This behavior was explained by a careful observation of the crack tip configuration. Following the onset of a crack extension, an amorphous zone moving along the [100] direction was observed at the crack tip. This amorphous zone blunted the crack, screened the crack tip from applied loading, and dissipated large amounts of energy, causing a substantial discrepancy between R and the level of fracture toughness predicted by the Griffith's criterion.
ACKNOWLEDGMENTS
This research was supported by the Basic Science Research Program through the National Research Foundation of Korea (NRF), funded by the Ministry of Education, Republic of Korea (NRF-2013R1A1A2A10008799).