


INTRODUCTION
Communicating who did what to whom requires placing the participants of an event (e.g. agent, patient) in the correct syntactic positions (e.g. subject, direct object). Theorists have long noted that these mappings are highly – if not perfectly – regular (for review, see Levin & Rappaport Hovav, Reference Levin and Rappaport Hovav2005), and experimentalists have asked when, whether, and how children acquire these generalizations (for review, see Ambridge & Lieven, Reference Ambridge and Lieven2011). One particular generalization that has garnered a great deal of attention in the theoretical, psycholinguistic, and language acquisition literatures is a putative relationship between caused events and transitive syntax (sentences with two arguments: a subject and a direct object).
Typologically, there is strong evidence for such a correlation. Many studies have concluded that, cross-linguistically, verbs which denote canonical caused events (an animate agent intentionally acts on and effects a change in a patient) are uniformly transitive (Andrews, Reference Andrews and Shopen1985; Croft, Reference Croft and Tsohatzidis1990; DeLancy, 1984; Hopper & Thompson, Reference Hopper and Thompson1980; Levin, Reference Levin1999; Nichols, Reference Nichols1975; Tsunoda, 1985). Less canonically caused two-participant events are less likely, cross-linguistically, to be encoded with transitive verbs. For example, verbs of authority and ruling (Sally ruled/directed/managed Mary), in which one entity acts on but does not necessarily change the other entity, are transitive in English but intransitive in Russian, taking an indirect rather than direct object (Levin & Rappaport Hovav, Reference Levin and Rappaport Hovav2005; Wheeler, Unbegaun, Falla & Thompson, Reference Wheeler, Unbegaun, Falla and Thompson2000). Similarly, verbs of contact (Sally kicked/kissed/slapped Mary), which likewise involve intentional action but no change, are transitive in English but not necessarily in other languages (Tsunoda, 1985). More generally, while some languages like English show a broad tolerance for inanimate subjects of transitive, causative verbs (The lightning/bullet/disease killed Sally), many other languages such as Korean and Irish allow few if any such sentences (Guilfoyle, Reference Guilfoyle, Carnie and Guilfoyle2000; Wolff, Jeon, Klettke & Yu, Reference Wolff, Jeon, Klettke, Yu, Malt and Wolff2010).
The privileged link hypothesis
Given that there is a strong relationship between canonical caused events and transitive syntax, if children were aware of that relationship, they could profitably use it during language acquisition. We call this the ‘privileged link hypothesis’ – the hypothesis that children recognize and exploit this correlation to aid acquisition – and distinguish between its weak form (children note a relationship between caused events and transitive syntax) and its strong form (children additionally note that the cause of the event is typically realized as the subject of the verb, and the patient of the event is realized as the direct object). Note that the universality of subject and direct object as cross-linguistically robust categories is not necessary, only that there be some systematic relationship between semantic role and syntactic position.
Children could exploit this privileged mapping between causal events and transitive syntax in two ways. First, as noted by Pinker (Reference Pinker1984) in his semantic bootstrapping theory, children could exploit the syntax-to-semantics mapping as follows: if children come to the problem of language learning with an expectation that agents of causal events will be mapped onto subject position, they can use that knowledge to identify how subjects are syntactically marked in their language (e.g. by a special affix, by appearing first in the sentence, etc.). Children can use this information to learn other aspects of syntax and thus ‘bootstrap’ themselves into language. Note that semantic bootstrapping requires the strong privileged link hypothesis, and likely requires that the link be innate. While the orthogonal issue of whether the privileged link is innate or learned is important, it is beyond the scope of this paper.
Syntactic bootstrapping theorists have noted that children could also exploit mappings from syntax to semantics (Fisher, Gertner, Scott & Yuan, Reference Fisher, Gertner, Scott and Yuan2010; Gleitman, Reference Gleitman1990). If the learner expects transitive verbs to describe caused events, the learner can then hypothesize that a novel transitive verb describes a caused event and use that inference to narrow the hypothesis space for the verb's meaning.
Note that the relationship between caused events and transitive syntax is not the only semantics–syntax relationship learners could exploit to accomplish either semantic or syntactic bootstrapping (cf. Ambridge, Pine & Rowland, Reference Ambridge, Pine and Rowland2012; Ambridge, Pine, Rowland & Chang, Reference Ambridge, Pine, Rowland and Chang2012; Naigles, Reference Naigles1996; Pinker, Reference Pinker1989; Scott & Fisher, Reference Scott and Fisher2009). However, there is more evidence for a privileged link between causal events and transitive syntax – in terms of both typological cross-linguistic evidence and experimental evidence (reviewed below) – than for any other such relationship, and thus if there are any privileged links guiding acquisition, the caused event–transitive syntax link is highly likely to be among them. For this reason and because the caused event–transitive syntax relationship has been the most thoroughly investigated, we focus both our experiments and our literature review on it. (For discussion of other possible privileged links, see especially Ambridge, Pine, Rowland, Chang & Bidgood, Reference Ambridge, Pine, Rowland, Chang and Bidgood2013; Ambridge & Lieven, Reference Ambridge and Lieven2011; Gleitman, Reference Gleitman1990; Pinker, Reference Pinker1989.)
Testing the privileged link
Both syntactic and semantic bootstrapping, coupled with the privileged link, predict that canonically causal transitive verbs should be acquired faster than non-causal transitive verbs, all else being equal (e.g. frequency). Interestingly, while there is some evidence for this in laboratory settings (see discussion and caveats below), it has never been demonstrated for natural vocabulary (this applies to the other potential privileged links as well). Perhaps this is because such a study requires a well-controlled comparison between causal and non-causal transitive verbs. Below, we exploit recent advances in semantics to provide just such a comparison involving verbs of emotion. Before describing the study, however, we review extant evidence relevant to the privileged link hypothesis.
By two years of age, children prefer to interpret novel transitive verbs (The duck is kradding the bunny) as referring to a caused event (a duck making a rabbit bend over) rather than to a non-caused event involving the same participants (a duck and a rabbit independently waving their arms in circles) (Arunachalam, Escovar, Hansen & Waxman, Reference Arunachalam, Escovar, Hansen and Waxman2012; Arunachalam & Waxman, Reference Arunachalam and Waxman2010; Naigles, Reference Naigles1990, Reference Naigles1996; Naigles & Kako, Reference Naigles and Kako1993; Noble, Rowland & Pine, Reference Noble, Rowland and Pine2011; for related findings, see also Yuan & Fisher, Reference Yuan and Fisher2009; Yuan, Fisher & Snedeker, Reference Yuan, Fisher and Snedeker2012). There is some evidence for the strong privileged link hypothesis as well: by two years of age, children infer that the subject of a transitive verb is the agent – rather than patient – of a caused event (Dittmar, Abbot-Smith, Lieven & Tomasello, Reference Dittmar, Abbot-Smith, Lieven and Tomasello2011; Fernandes, Marcus, Di Nubila & Vouloumanos, Reference Fernandes, Marcus, Di Nubila and Vouloumanos2006; Noble et al., Reference Noble, Rowland and Pine2011; but see Akhtar & Tomasello, Reference Akhtar and Tomasello1997) and that they find it harder to learn novel verbs where the subject is the patient of a caused event than where the subject is the agent (Fisher & Song, Reference Fisher, Song, Hirsh-Pasek and Golinkoff2006; Marantz, Reference Marantz1982).
While suggestive, these studies are limited in that there is no comparison to non-causal transitive verbs. Children's preference for transitive verbs to encode (two-role) caused events rather than (one-role) non-caused events is also consistent with a simpler strategy, which is essentially the theta criterion (Chomsky, Reference Chomsky1981): a verb that takes two different types of syntactic argument (e.g. a subject and a direct object) should correspond to an event that requires two different types of semantic argument (e.g. an agent and a patient) (for a related idea, see Fisher's structure mapping hypothesis, described below in the ‘General discussion’). On this alternative account, nothing is special about caused events; contact events (Sally kicked Mary) or perception events (Sally saw Mary) would work just as well. Indeed, Naigles and Kako (Reference Naigles and Kako1993) replicated the above results with contact events, and also found that children aged 2;3 showed no preference for interpreting a novel transitive verb as referring to a caused motion event relative to a contact event. Similarly, while the studies above show that children prefer to map the agent of a caused event onto subject position and the patient onto direct object position, it may be that children are equally good at inferring the correct semantic-role-to-syntactic-position mappings for other events commonly encoded with transitive syntax in English, a result that would be inexplicable on the privileged link hypothesis.
Importantly, it is unclear whether findings of a privileged link generalize beyond laboratory experiments to the acquisition of natural vocabulary. Bowerman (Reference Bowerman1990), in a diary study of two children acquiring English, found that ‘prototypical agent–patient’ verbs appeared no earlier than other two-argument verbs.
Emotion verbs
In the present study, we ask whether causal transitive verbs are acquired more quickly than non-causal transitive verbs. We focus on a fortuitous case study: transitive emotion verbs. Transitive emotion verbs come in two types, distinguished by their argument structure and whether they describe caused events. This first type, which for short-hand we call ‘frighten-type’ verbs, describe emotions experienced by the grammatical object (Sally frightens/angers/delights Mary). In contrast, ‘fear-type’ verbs describe emotions experienced by the grammatical subject (Sally fears/hates/likes Mary). On most if not all analyses, frighten-type verbs are causative: the grammatical subject causes the grammatical object to experience the emotion (Dowty, Reference Dowty1991; Jackendoff, Reference Jackendoff1990; Pesetsky, Reference Pesetsky1995; Pinker, Reference Pinker1989), thus following the proposed strong privileged link between causal events and transitivity. In contrast, most authors conclude either that fear-type verbs do not encode causation at all (Dowty, Reference Dowty1991; Pesetsky, Reference Pesetsky1995; Pinker, Reference Pinker1989) or that they describe an event both caused and experienced by the grammatical subject (Jackendoff, Reference Jackendoff1990). These linguistic analyses have recently been experimentally confirmed (Hartshorne, O'Donnell, Sudo, Uruwashi & Snedeker, Reference Hartshorne, O'Donnell, Sudo, Uruwashi and Snedeker2010; unpublished observations). Thus, we can ask whether frighten-type verbs are acquired more rapidly than fear-type verbs, as predicted by the privileged link hypothesis.
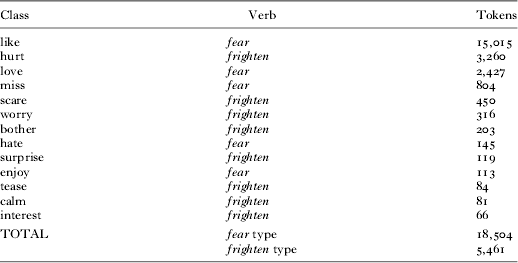
While these verb types are distinguished by whether they encode caused events, they are very similar in meaning otherwise. This eliminates many potential confounds (though not all; see ‘General discussion’). One remaining confound helpfully works against the privileged link hypothesis: the highest-frequency fear-type verb (like) is more frequent in child-directed speech than all frighten-type verbs combined (Table 1). Of the four most frequent emotion verbs, three are fear-type. Thus, if frighten-type verbs are nonetheless acquired first, that is compelling evidence for the privileged link hypothesis.
The fourteen most common emotion verbs
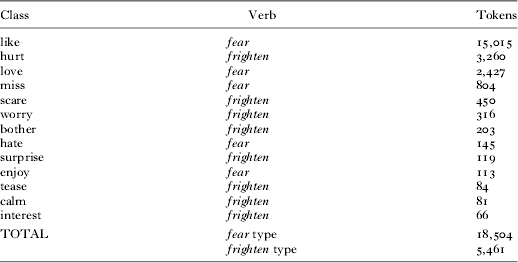
note: Based on transitive use only in a corpus of 5,112,439 words of child-directed speech.
To determine input frequency, we analyzed 3,235 American English transcripts in CHILDES in which at least one child no older than 5;0 was present: the Bates corpus (Bates, Bretherton & Snyder, Reference Bates, Bretherton and Snyder1988), the Gleason corpus (Bellinger & Gleason, Reference Bellinger and Gleason1982), the Bernstein-Ratner corpus (Bernstein, Reference Bernstein1984), the Bliss corpus (Bliss, Reference Bliss1988), the Bloom Reference Bloom1970 corpus (Bloom, Hood & Lightbown, Reference Bloom, Hood and Lightbown1974; Bloom, Lightbown & Hood, Reference Bloom, Lightbown and Hood1975), the Bloom Reference Bloom1973 corpus (Bloom, Reference Bloom1973), the Bohannon corpus (Bohannon & Marquis, Reference Bohannon and Marquis1977; Stine & Bohannon, Reference Stine and Bohannon1983), the Brent corpus (Brent & Siskind, Reference Brent and Siskind2001), the Brown corpus (Brown, Reference Brown1973), the Demetras-Trevor corpus (Demetras, Reference Demetras1989b), the Demetras-Working corpus (Demetras, Reference Demetras1989a, Reference Demetras1989b), the Post corpus (Demetras, Post & Snow, Reference Demetras, Post and Snow1986; Post, Reference Post1992, Reference Post, Sokolov and Snow1994), the Providence corpus (Demuth, Culbertson & Alter, Reference Demuth, Culbertson and Alter2006), the Home–School Study of Language and Literacy Development corpus (Dickinson & Tabors, Reference Dickinson and Tabors2001), the Haggerty corpus (Haggerty, Reference Haggerty1929), the Hall corpus (Hall, Nagy & Linn, Reference Hall, Nagy and Linn1984; Hall, Nagy & Nottenburg, Reference Hall, Nagy and Nottenburg1981), the Higginson corpus (Higginson, Reference Higginson1985), the Kuczaj corpus (Kuczaj, Reference Kuczaj1977), the MacWhinney corpus (MacWhinney, Reference MacWhinney2000), the Feldman corpus (Menn & Feldman, Reference Menn and Feldman2001), the Morisset corpus (Morisset, Barnard, Greenberg, Booth & Spieker, Reference Morisset, Barnard, Greenberg, Booth and Spieker1990), the New England corpus (Ninio, Snow, Pan & Rollins, Reference Ninio, Snow, Pan and Rollins1994), the Sachs corpus (Sachs, Reference Sachs and Nelson1983), the Soderstrom corpus (Soderstrom, Blossom, Foygel & Morgan, Reference Soderstrom, Blossom, Foygel and Morgan2008), the Suppes corpus (Suppes, Reference Suppes1974), the Valian corpus (Valian, Reference Valian1991), the Van Houten corpus (Van Houten, Reference Van Houten1986), the Warren-Leubecker corpus (Warren-Leubecker, Reference Warren-Leubecker1982; Warren-Leubecker & Bohannon, Reference Warren-Leubecker and Bohannon1984), and the Weist corpus (Weist, Pawlak & Hoffman, Reference Weist, Pawlak and Hoffman2009; Weist & Zevenbergen, Reference Weist and Zevenbergen2008). We excluded any utterances made by the target child. After an automatic script cleaned the formatting, utterances involving any of the 56 fear-type or 242 frighten-type verbs listed in VerbNet's exhaustive database (Kipper, Korhonen, Ryant & Palmer, Reference Kipper, Korhonen, Ryant and Palmer2008) were extracted. However, many of these were non-verb uses (e.g. like used as a noun). Neither excluding non-verb uses through hand annotation (via Amazon Mechanical Turk) nor the use of a high-accuracy PCFG parser trained on the Penn Wall Street Journal Treebank (Klein & Manning, Reference Klein and Manning2003; de Marneffe, McCartney & Manning, Reference de Marneffe, McCartney and Manning2006) was sufficiently accurate on its own, but we found the combination to prove satisfactory: a token was considered to be a verb if (i) 2/3 of annotators and the parser judged it to be a verb, or (ii) the parser determined the token to not be a verb but was overruled by 3/4 annotators. We then calculated the frequency of occurrence for each verb. Several verbs (e.g. throw, cut, stand) were excluded as they are rarely used as emotion verbs.
One additional reason to focus on emotion verbs is that most of the work on the privileged link hypothesis has focused on caused motion verbs, with much less known about other types of causal transitive verbs (but see Bowerman, Reference Bowerman1990; Fisher & Song, Reference Fisher, Song, Hirsh-Pasek and Golinkoff2006; Naigles & Kako, Reference Naigles and Kako1993; Pinker, Lebeaux & Frost, Reference Pinker, Lebeaux and Frost1987).
One might worry that some of the research reviewed in the previous section makes it unlikely that canonically causal transitive verbs like frighten-type verbs are acquired more rapidly than non-causal transitive verbs like fear-type verbs (Bowerman, Reference Bowerman1990; Naigles & Kako, Reference Naigles and Kako1993). Neither of these studies are conclusive, however. Bowerman's sample was small (two children), and her ‘prototypical agent–patient’ transitive verbs in fact included non-causal verbs (hug, buy, hit) as well as arguably non-transitive verbs (gimme, pick up, put away), complicating interpretation of her results. The Naigles and Kako study was a preferential-looking study, and interpretation is complicated by the fact that the single largest effect was a baseline preference to not look at the contact events, which may have masked the effects of interest.
Previous studies of emotion verb acquisition
A few prior studies have investigated the acquisition of causative and non-causative transitive emotion verbs (frighten-type and fear-type, respectively), though the data are methodologically limited. In Bowerman's (Reference Bowerman1990) diary study, her two subjects occasionally misused some fear-type verbs in frighten-type syntax (“I saw a picture that enjoyed me.”), potentially consistent with the privileged link hypothesis. Mitigating this observation is that the overapplications of the frighten-type pattern were rare and first observed at the relatively old age of six to eight, though the sample size is admittedly small. Unfortunately, Bowerman does not investigate which type of verb was learned earlier.
More recently, Messenger, Branigan, McLean, and Sorace (Reference Messenger, Branigan, McLean and Sorace2012), in a control condition for a study of children's acquisition of the passive, asked children (3;4–4;11, M = 4;2) to match sentences (A dog is surprising a nurse) to the appropriate picture, where the two alternative pictures reversed the arguments (a dog surprising a nurse vs. a nurse surprising a dog). They reported significantly better performance for ‘theme–experiencer’ verbs (frighten-type) compared with ‘experiencer–theme’ verbs, a category including two fear-type verbs (love, hate), two perception verbs (see, hear), and two mental activity verbs (remember, ignore). If the poor performance on experiencer–theme verbs included the fear-type verbs, that could support the privileged link hypothesis. However, it could well have been driven by the mental activity verbs and thus merely reflect children's well-known difficulty with comprehending propositional mental states (for review, see Wellman, Cross & Watson, Reference Wellman, Cross and Watson2001). The authors themselves suggest that the findings could be due to experimental confounds (see ‘Results and discussion’ to Experiment 1, below).
Similarly, in an unpublished study by Tinker, Beckwith, and Dougherty (Reference Tinker, Beckwith and Dougherty1989), described in DiDesidero (Reference DiDesidero1999), seven four-year-olds were presented with scenarios dramatized by puppets and then asked “Who frightened/feared/pushed/etc. who?” Accuracy was better for frighten-type than fear-type verbs. Interestingly, in an echo of Bowerman (Reference Bowerman1990), the verb fear itself was systematically misused as a synonym for frighten. However, given the small sample and without a full reporting of the method, caution in interpretation is warranted.
One additional study deserves mention. Braine, Brooks, Cowan, Samuels, and Tamis-LeMonda (Reference Braine, Brooks, Cowan, Samuels and Tamis-LeMonda1993) were interested in when children acquire the abstract category subject. They trained participants of different ages to place a token on the subject of one type of sentence (e.g. sentences involving transitive action verbs like The big bear is washing the little bear) and then tested how participants generalized to other types of sentence (e.g. passive sentences, sentences with predicate adjectives, etc.). The sentences were presented orally in the context of a picture, allowing the participant to place the token on the pictorial representation of the relevant character (e.g. the big bear in the example above).
Most relevant is Experiment 3, in which five-year-olds, nine-year-olds, and adults were trained to place a triangular token on the agent of the action and a circular token on the patient. In order to prevent word-order strategies, half the training trials were active and half were passive. The authors then tested how participants generalized this task to other action verbs as well as to ‘behavioral’ and ‘experiential’ predicates. The behavioral predicates consisted of four frighten-type verbs, whereas the experiential predicates consisted of a fear-type verb (like), a predicate adjective (is afraid of), and a verb (smell) which is polysemous between a physical activity or perception. Adults put the ‘subject’ token (the triangle) on the subject of all three generalization sets, though they were more likely to do this for action verbs (100%) and behavioral predicates (96%) than experiential predicates (78%). By nine years of age, children had reached adult performance on the action and behavioral predicate sentences (100% and 96%, respectively), but not experiential predicate sentences (58%). This could reflect poorer understanding of the experiential predicates including the fear-type verb like, or it could be driven by the predicate adjective is afraid of alone, since, in separate experiments, the authors showed that children have particular difficulty generalizing between the subject of a transitive verbs and predicate adjectives.
Thus, there is some limited evidence that caused transitive emotion verbs (frighten-type) are acquired earlier than non-caused transitive emotion verbs (fear-type), but the data are far from conclusive. Below, we present a systematic study of the earliest stages of emotion verb acquisition.
PILOT STUDY
We conducted a pilot study to determine at what age children are beginning to learn emotion verbs, in order to set the stage for further investigation.
METHOD
Subjects
Three age groups were tested, with eight participants in each group: four-year-olds (age: 4;2–4;8, M = 4;6; 5 females), five-year-olds (age: 5;1–5;8, M = 5;5; 2 females), and adults (age: 19–26, M = 21; 7 females). All participants in all studies were native English speakers and were recruited from the greater Boston community.
Materials and procedure
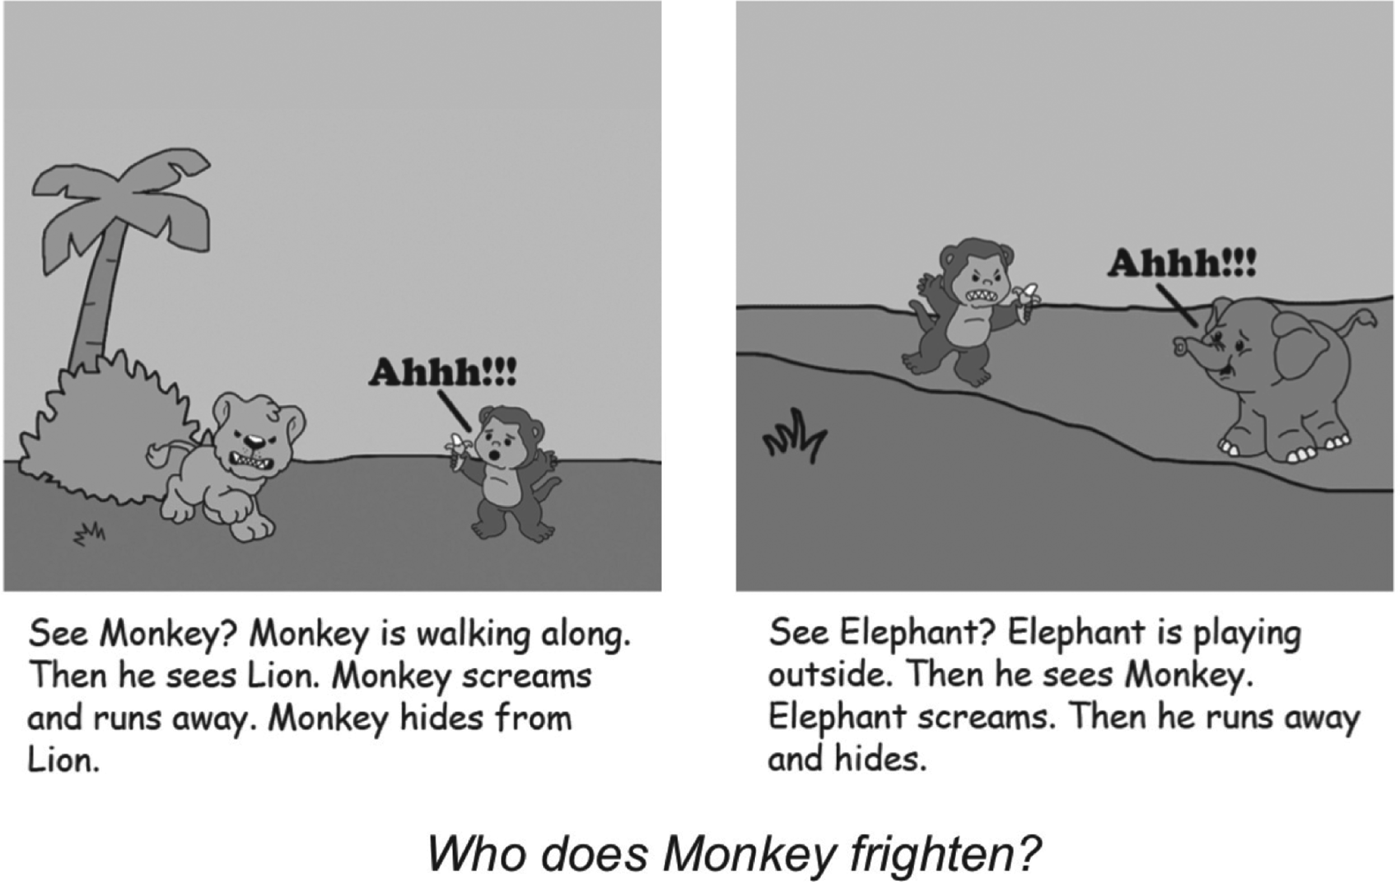
Participants were read a series of stories from a storybook. Figure 1 presents an example. In the first panel, Lion elicits fright in Monkey. In the second panel, Monkey elicits fright in Elephant. Participants were then asked: “Who does Monkey frighten?” Because Monkey is involved in both frighten events, answering correctly requires understanding how the verb describes the structure of the event (that Monkey is the stimulus, not the experiencer of the emotion). Whether the correct answer involved the panel on the left or right was counterbalanced within and across participants.
An example story from the pilot study.

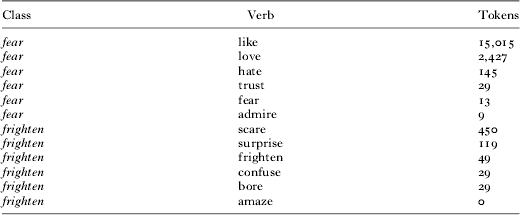
The storybook contained fourteen stories depicting events taking place between six animals (tiger, lion, giraffe, monkey, elephant, and chicken). The first two stories were familiarization/practice trials involving transitive action verbs (hug, kiss), and the remaining twelve involved emotion verbs. These were the highest-frequency non-polysemous fear-type and frighten-type verbs based on a small, preliminary corpus analysis: six frighten-type (scare, surprise, frighten, bore, confuse, amaze) and six fear-type (like, love, fear, hate, admire, trust). Consistent with the general trend for emotion verbs shown in Table 1, the fear-type verbs were as a group considerably more frequent than the frighten-type verbs (Table 2), though the difference did not reach significance (t(10) = 1·15, p = ·28). Neither the target verb (e.g. frighten) nor any related forms (fright, frightened, frightful) were mentioned in the stories. A second storybook was created with the character assignments reversed, to counterbalance for character, side, or story bias. Two more storybooks were created by reversing the order of the critical trials.
Frequencies of verbs used in the experiments
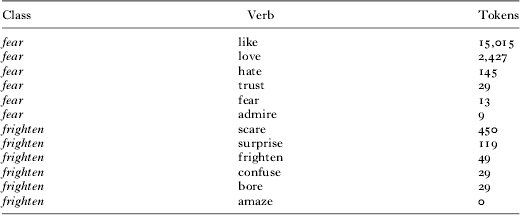
note: Based on transitive use only in a corpus of 5,112,439 words of child-directed speech.
As described above and depicted in Figure 1, each story involved two panels involving an emotional interaction between two characters. One of the characters appeared in both panels, being the stimulus of the emotion in one and the experiencer in the other. After going through both panels, the participant was asked about the repeated character (e.g. “Who does Monkey frighten?”). Whether the correct answer involved the panel on the left or right was counterbalanced, both within and across subjects. Children who did not respond either vocally or by pointing were allowed to hear the story again until they were ready to respond.
Several of the stimuli involved thought or speech bubbles, which can be understood by children as young as three years old with minimal instruction (Wellman, Hollander & Schult, Reference Wellman, Hollander and Schult1996). Before the task began, children were introduced to an example image with a thought bubble and another with a speech bubble. Children who could not appropriately explain the bubbles (thought bubble: 5; speech bubble: 15) were familiarized with the relevant concept.
RESULTS AND DISCUSSION
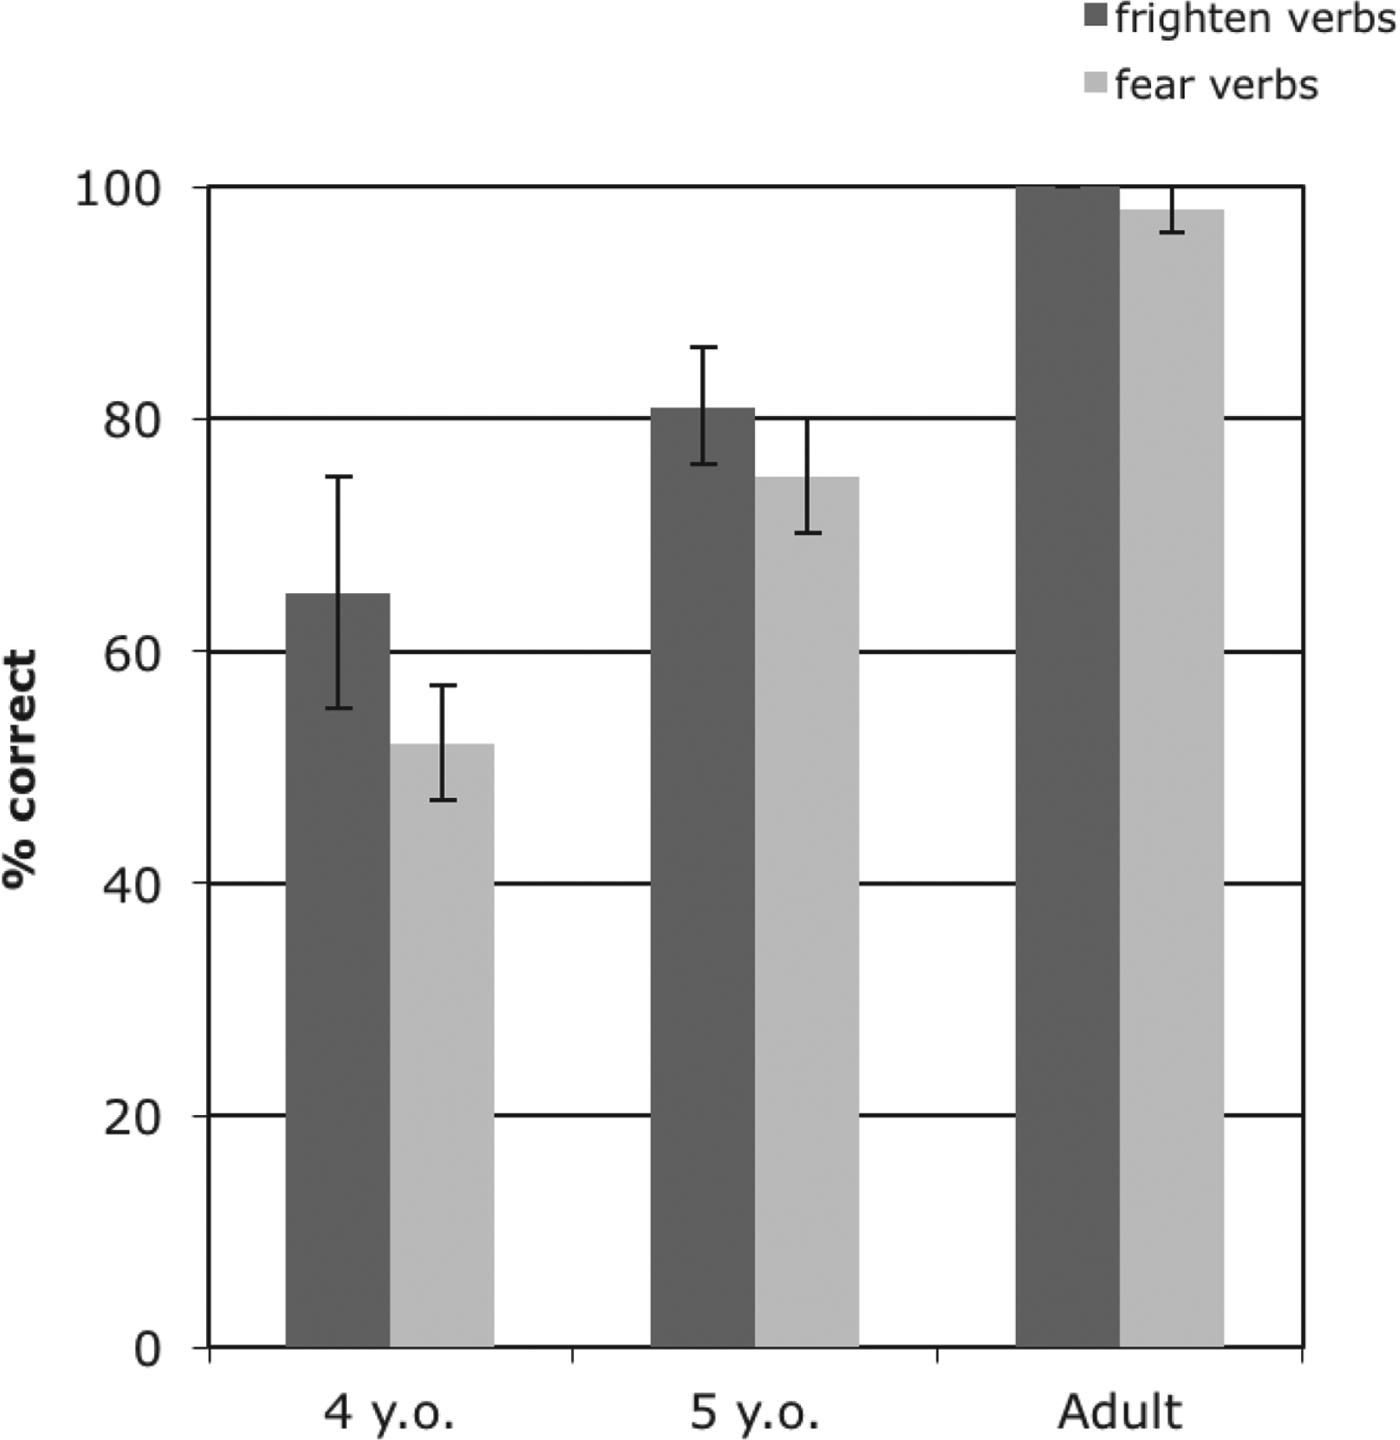
The responses of both the adult population and the five-year-old population were significantly above chance (t(11) = 47·00, p < ·001; t(11) = 5·05, p < ·001), indicating that both groups displayed an understanding of the directionality of each of the verbs, while the four-year-olds performed at chance (t(11) = 1·77, p > ·1) on the task (Figure 2). Each age group differed significantly from each other in pairwise comparisons (ps < ·01).
Percent correct responses with standard errors for each age group by verb type in Experiment 1.
Thus it appears that emotion verb acquisition is in its earliest stages in four-year-olds, and thus the following experiments investigate this group in detail. Interestingly, each age group performed better on frighten-type verbs than fear-type verbs. The present study had limited statistical power for this analysis, and indeed it was not significant at any age group, though it is consistent with the privileged link hypothesis and is despite the fear-type verbs' higher frequency.
EXPERIMENT 1
In Experiment 1, we take a closer look at four-year-olds, who are just beginning to show knowledge of emotion verbs. During the pilot study, several adult participants complained of the memory demands involved in keeping track of two similar stories on each trial. Although the children did not complain, presumably the memory challenge for them was no less. Thus, in subsequent experiments, we employ a different task – Truth Value Judgment (Crain & Thornton, Reference Crain and Thornton1998) – which places fewer working memory demands on the participants.
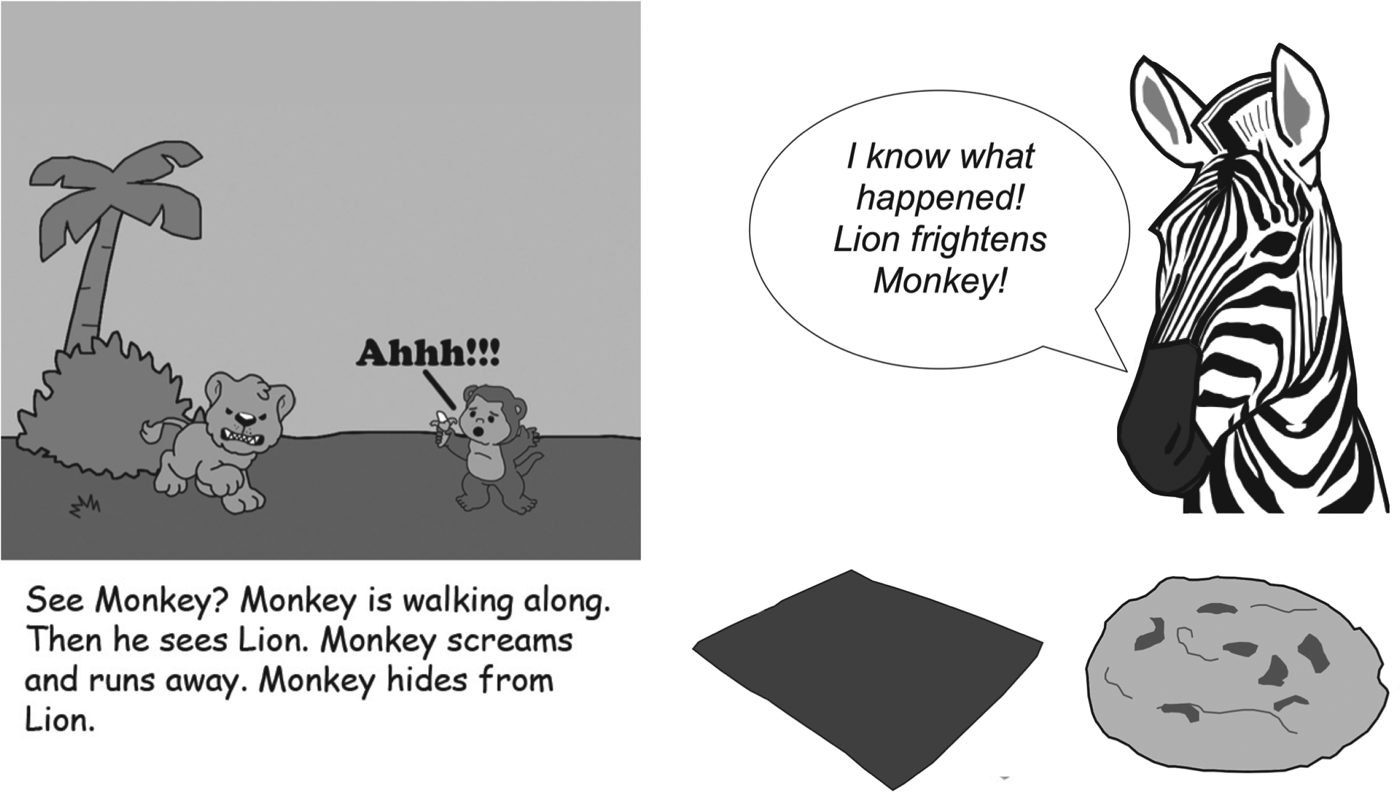
The child was introduced to a puppet, Zebra, and made to understand that Zebra is just learning to talk and consequently makes occasional mistakes. It was the child's job to help teach Zebra. The experimenter would read from a storybook, and after each part of the story, Zebra would try to explain what happened. If Zebra got it right, the child was to feed Zebra a cookie as a reward. If Zebra said something wrong or silly, the child was to feed Zebra a dirty rag as a punishment. Children find this method highly engaging, and it has been found to be a very sensitive measure of children's linguistic understanding (Chierchia, Crain, Guasti, Gualmini & Meroni, Reference Chierchia, Crain, Guasti, Gualmini, Meroni and Do2001; Crain & Thornton, Reference Crain and Thornton1998; Fox & Grodzinsky, Reference Fox and Grodzinsky1998; Papafragou, Li, Choi & Han, Reference Papafragou, Li, Choi and Han2007).
METHOD
Participants
Participants were sixteen native English-speaking four-year-old children (age: 4;1–4;11, M = 4;6; 7 females).
Materials and procedure
One page from each of the original two-page stories from the pilot study was used, including the familiarization/practice trials. As in the pilot study, the order of the critical items and which animal experienced the emotion was counterbalanced. The Truth Value Judgment method was employed, as described above (Figure 3; see also ‘Appendix’). Whether Zebra's statement was true or false (that is, whether Zebra reversed the subject and object) was counterbalanced within and between subjects. The counterbalancing of order, which animal was the experiencer, and whether Zebra's statement was true, resulted in a total of eight storybooks.
A depiction of one trial from Experiment 1. In this case, the correct response is to feed the Zebra the cookie. Additional examples are given in the ‘Appendix’.
RESULTS AND DISCUSSION
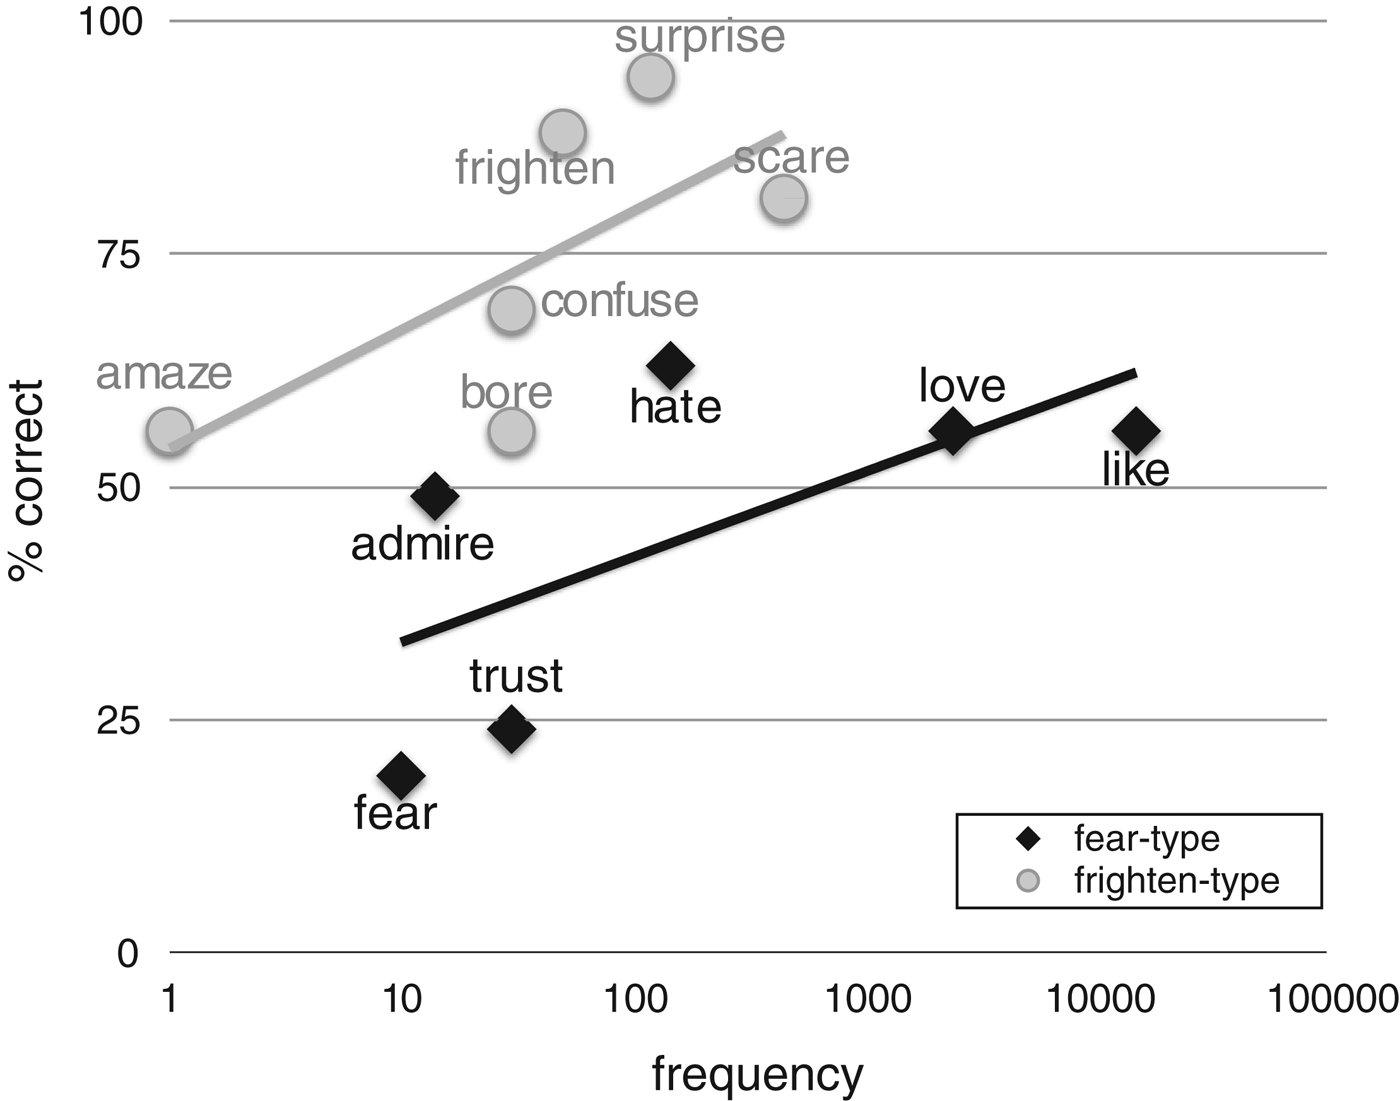
While the four-year-old children accepted or rejected Zebra's responses at a rate exceeding chance for frighten-type verbs (t(15) = 6·01, p < ·001), they performed at chance on fear-type verbs (t(15) = 0·62, p > ·5). This difference was significant (t(15) = 4·57, p < ·001). While performance was numerically better on higher-frequency verbs, this was modulated by verb type (Figure 4). Follow-up binomial tests revealed that children were above chance on three of the six frighten-type verbs (surprise: 15/16; frighten: 13/16; scare: 13/16; ps < ·05), whereas performance did not exceed chance for any fear-type verb (best performance was for admire: 11/16, p = ·1) and performance was significantly worse than chance for both fear (3/16, p = ·01) and trust (4/16, p = ·04), suggesting children misanalyzed these verbs as frighten-type verbs, further indicating an advantage for frighten-type verbs. This same argument reversal for fear was previously reported by Tinker et al. (Reference Tinker, Beckwith and Dougherty1989) and matches Bowerman's (Reference Bowerman1990) finding of argument reversals for fear-type verbs in the spontaneous speech of older children.
Verb-by-verb performance in Experiment 1 against verb frequency with regression lines. In order to plot frequency on a logarithmic scale, raw frequency was incremented by 1.
Is it possible that the advantage for frighten-type verbs is an artifact of not including the high-frequency fear-type verbs miss and enjoy? This is unlikely for two reasons. First, these verbs are much less frequent than like and love and are on par with hate – verbs included in our study and which the children failed to fully comprehend. Moreover, we also did not include several high-frequency frighten-type verbs, e.g. hurt and bother, so if anything the frighten-type advantage may have been underestimated. Second, such considerations do not explain why children would misanalyze lower-frequency fear-type verbs as frighten-type verbs.
Nonetheless, there are other reasons not to take these results at face value. Young children use like and love frequently. The first emotion verb uttered by children in our selection of CHILDES corpora (restricted to those corpora that are POS-tagged) that was not a clear repetition of the preceding adult utterance was like, which was uttered by an infant aged 1;6 (Tardif, 1996) (Several child uses of like in the Brent corpus (Brent & Siskind, Reference Brent and Siskind2001) appear to be transcription errors, such as a child aged 0;8 saying “Do you like that toy too huh?”). Counting repetitions, CHILDES children less than two years old used like 87 times and love 27 times, with few if any obvious errors. Looking at older children, four-year-olds in the corpus produced 1131 fear-type tokens and only 47 frighten-type tokens.
Thus, the failure of children to correctly interpret verbs they frequently use correctly is surprising. Messenger and colleagues (Reference Messenger, Branigan, McLean and Sorace2012) hypothesized that the poor performance on ‘experiencer–theme’ verbs in their study (see ‘Emotion verbs’, above) was due to a confound: being stative, ‘experiencer–theme’ verbs may be harder to depict visually and thus harder for the participants to interpret. Though they did not test to see whether their ‘experiencer–theme’ stimuli actually were harder to interpret, the hypothesis is sufficiently plausible that in Experiment 2 we tested whether differences in the interpretability of our frighten-type and fear-type stimuli could explain children's poorer performance.
EXPERIMENT 2
We considered two possible ways in which our fear-type stimuli could be deficient. First, because fear-type verbs are stative, it may have been more difficult for children to identify in the illustrations who the experiencer of the emotion was. Although the story itself resolved any such ambiguities, the children may have used the illustrations as a mnemonic, in which case it is important that the fear-type illustrations be equally good mnemonically as the frighten-type illustrations. We explore this possibility in Experiment 2a.
Second, it may have been that since frighten-type verbs can describe events, we were better able to write and illustrate instances of frighten-type verbs than instances of fear-type verbs. Given that, Zebra's fear-type utterances may have simply been poor descriptors of the story regardless, minimizing the differences between Zebras ‘correct’ and ‘incorrect’ statements. We consider this possibility in Experiment 2b.
METHOD
Participants
All participants were recruited through Amazon Mechanical Turk and given a small monetary compensation. Forty English-speaking adults participated in each of Experiment 2a (18–71 y.o.; M = 37·3) and Experiment 2b (18–61 y.o.; M = 34·1). Nine additional participants (5 in Experiment 2a) were excluded for not completing the experiment or for repeating the experiment.
Materials and procedure
The survey was generated using Qualtrics software of the Qualtrics Research Suite (Qualtrics Research Suite, 2013). The same stimulus lists from Experiment 1 were used, and participants in Experiments 2a and 2b were randomly assigned to a list. In Experiment 2a, on each trial, participants were presented with one of the illustrations from Experiment 1 and asked to identify the subject of the relevant verb (“This is a picture accompanying a storybook about emotions. One of these animals fears the other one. Which one fears the other one?”). In Experiment 2b, on each trial, participants were presented with an illustration from Experiment 1 along with the accompanying story. They were then presented with Zebra's statement (“Lion frightens Monkey”) and asked to rate, on a five-point Likert scale, how good a description of the story/illustration the statement was.
RESULTS AND DISCUSSION
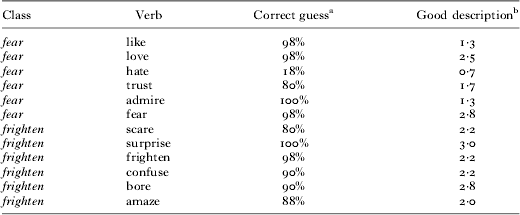
There was no correlation between success in Experiment 1 with either the likelihood of correctly identifying the experiencer based on the illustration in Experiment 2a (r = 0·13, p = ·66) or with the difference in the goodness-of-description rating between the correct and incorrect descriptions in Experiment 2b (r = −0·11, p = ·70). The fear-type verb that children found most challenging in Experiment 1 was fear. However, this was one of the items that adults found easiest to interpret in Experiments 2a and 2b. Conversely, children in Experiment 1 had numerically the best performance on hate, whereas the stimuli for hate were the least transparent of all (Table 3): while adults did find the correct sentence to be a (slightly) better description of the illustrated ‘hate’ story, they had difficulty identifying the experiencer from the illustration alone.
Results for Experiment 2
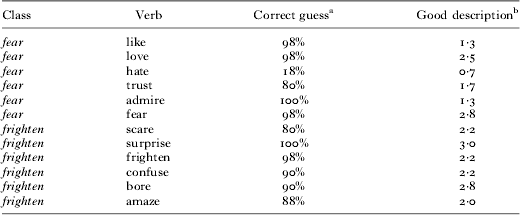
notes:aResults of Experiment 2a (percentage of participants correctly identifying the experiencer). b Results of Experiment 2b (goodness of description score for correct sentence – goodness of description score for incorrect sentence).
Primarily because of hate, performance on the frighten-type stimuli was superior to performance on fear-type stimuli in both Experiment 2a (t(39) = 2·96, p = ·005) and Experiment 2b (t(39) = 4·31, p = ·0001). We chose four fear-type verbs (admire, love, fear, trust) and four frighten-type verbs (amaze, confuse, frighten, scare) such that performance was matched in Experiment 2a (94% vs. 89%, respectively; t(39) = 1·5, p = ·13) and in Experiment 2b (2·0 vs. 2·1, respectively; t(39) < 1). Nonetheless, even for this subset of verbs, performance in Experiment 1 remained significantly better for frighten-type verbs (p = ·0007).
Thus, whatever difficulties children had with fear-type verbs in Experiment 1, they do not seem to be caused by the difficulties in interpreting the stories or illustrations. In Experiment 3, we consider another possible confound.
EXPERIMENT 3
The emotions described by high-frequency fear-type verbs (liking, loving, and hating) are frequently requited. Bi-directional liking, loving, and hating between two animates may be sufficiently common in the child's experience (e.g. most of the people she loves also love her in return) that she simply expects such emotions to always be requited. Note that our stimuli in Experiments 1 and 2 only described the emotional state of one character in each scenario. Consider one of our love scenarios:
(1) See Lion and Tiger? Lion thinks Tiger is very pretty. Lion thinks Tiger is very nice. Lion wants to marry Tiger some day.
How Tiger feels about Lion is left unsaid; a generous child might assume Tiger loves Lion every bit as much as Lion loves Tiger. Thus, when Zebra says “Tiger loves Lion”, although the truth of the statement was not established in the story, the child may nonetheless assume it is true. In Experiment 3, we disabused the child of this notion by reconstructing the stories for like, love, and hate in order to make the unidirectionality of the emotion salient (e.g. that Tiger does not love Lion).
METHOD
Participants
Participants were sixteen native English-speaking four-year-old children (age: 4;2–4;11, M = 4;7; 7 females).
Materials and procedure
Two new storybooks were created, using the same training stories as in Experiment 1. The new stories included only three of the fear-type verbs (like, love, hate) with new, unidirectional stories:
(2) See Lion and Tiger? Lion thinks Tiger is very pretty, but Tiger doesn't think Lion is handsome. Lion thinks Tiger is very nice. Lion wants to marry Tiger some day, but Tiger doesn't want to marry Lion.
Three frighten-type stimuli from Experiment 1 (frighten, confuse, surprise) were included – stories unchanged – as fillers.
RESULTS AND DISCUSSION
Children's performance on like, love, and hate (M = 63%, SE = 7%) was indistinguishable (t(28) < 1) from that in Experiment 1 (M = 58%, SE = 6%) and not significantly different from chance (t(15) = 1·87, p > ·05). In contrast, performance on the three frighten-type verbs was again significantly greater than chance (t(15) = 4·09, p = ·01) and not different than the results for the same verbs in Experiment 1 (t(28) < 1). Note that overall fear-type performance was somewhat better in Experiment 3 only because we did not include several low-frequency fear-type verbs in Experiment 3 that had been included in Experiment 1.
Thus, the frighten-type advantage cannot be explained by children assuming that loving and hating is reciprocal unless otherwise specified. Though the additional support provided in Experiment 3 did lead to above-chance performance on like, a strong frighten-type advantage remained, especially once input frequency is considered. How then can we account for the fact that toddlers apparently produce high-frequency fear-type emotion verbs in spontaneous speech? In Experiment 4, we consider the possibility that they make use of non-adult-like strategies.
EXPERIMENT 4
It has long been noted that, in early speech, children's subjects are typically animate and objects inanimate (e.g. Bloom, Reference Bloom1970) and that children are better at understanding sentences with an animate subject and inanimate object than sentences where both the subject and object are animate (e.g. Slobin, Reference Slobin1966). We coded a subset of children's early uses of love and hate from CHILDES. We found that in the vast majority of codable cases, the subject was animate (love: 127/129; hate: 169/170) and the object was frequently inanimate, an infinitive, gerund, or a dummy pronoun (love: 60/129; hate: 130/170). Thus, in Experiment 4, we tested the possibility that children would succeed on fear-type verbs if the experiencer was animate and the non-experiencer inanimate:
(3) See Giraffe and the beach ball? Giraffe always plays with the beach ball. Giraffe says the beach ball is his favorite toy. Giraffe brings the beach ball everywhere he goes.
Note that it is not sufficient for children to know that beach balls cannot feel emotion in order to reject The beach ball loves Giraffe, as children could entertain the possibility that love is a frighten-type verb, where the experiencer (Giraffe) is the grammatical object. To correctly reject this sentence, children must decide that the inanimate beach ball could not be the grammatical subject of love.
METHOD
Participants
Participants were eight native English-speaking four-year-old children (age: 4;2–4;10, M = 4;7; 5 females).
Materials and procedure
The training trials and procedure remained the same as in Experiments 1 and 3. New stories involving one animate and one inanimate character were created for five of the previously used fear-type verbs (admire was excluded because, e.g. Monkey admired the object, appears to describe an activity, not an emotional state). The animate character was described as having one of the relevant emotional states in reference to the inanimate character (3). No frighten-type verbs were included. The procedure was otherwise the same as before.
RESULTS AND DISCUSSION
Overall performance on the five fear-type verbs was well above chance (M = 78%, SE = 10%; t(7) = 2·89, p = ·02). Follow-up binomial analyses found that children were above chance on like (8/8, p < ·01), love (7/8, p < ·05), and hate (7/8, p < ·05), though they were still at chance for fear (4/8) and trust (5/8).
Thus, when the target of the emotional state was inanimate, four-year-olds were able to correctly map it to the object position of at least three fear-type verbs, though they nonetheless continued to fail on two low-frequency fear-type verbs: fear and trust, the verbs which were misanalyzed as frighten-type verbs in Experiment 1. These data suggest at least one strategy by which young children may succeed in using such verbs correctly in spontaneous production, but nonetheless highlights the difficulty that the children have with these verbs.
There is an interesting parallel to work on aphasics' comprehension of emotion verbs: in two studies, patients with Broca's aphasia show better performance with fear-type verbs than frighten-type verbs (Piñango, Reference Piñango, Grodzinsky, Shapiro and Swinney2000; Thompson & Lee, Reference Thompson and Lee2009). These findings have been taken as evidence that frighten-type verbs are more difficult than fear-type verbs (e.g. Thompson & Lee, Reference Thompson and Lee2009), perhaps because the former require movement (Bellletti & Rizzi, Reference Belletti and Rizzi1988; but see Pesetsky, Reference Pesetsky1995, for a thorough critique). This conclusion conflicts with the present one based on developmental data. However, patients with Broca's aphasia are not uniformly worse at frighten-type verbs; when the sentences are passivized, they are instead better at frighten-type than fear-type verbs.
These results cannot be explained by linking the animate argument to subject position, since both arguments are animate. Nonetheless, a slightly modified version of this strategy would work: link the necessarily animate argument (the experiencer) to subject position. There is some evidence that such a strategy may be partly active even in typical adults: Paczynski and Kuperberg (Reference Paczynski and Kuperberg2011) report that felicitous but animate direct objects (The farmer penalized the laborer) evoke larger N400 s than equally felicitous inanimate direct objects (The farmer plowed the meadow), suggesting that animate direct objects are processed as (slight) semantic anomalies. This effect generalizes even to frighten-type verbs, which require animate direct objects (The farmer interested the laborer).
Though intriguing, the exact relationship between these findings and the developmental data presented here is unclear. Elucidating and describing the alternative interpretation and production strategies that can be employed when the standard routes are not available remains an important avenue for future research.
GENERAL DISCUSSION
By four years of age, children are beginning to understand transitive sentences involving frighten-type verbs but still struggle with those involving fear-type verbs, despite the higher frequency of the latter (Experiments 1–3). Similar results have appeared in preliminary reports using methods similar to those in the present study (Messenger et al., Reference Messenger, Branigan, McLean and Sorace2012; Tinker et al., Reference Tinker, Beckwith and Dougherty1989). In addition to confirming those findings, we were able to rule out several potential experimental confounds that could have explained these results (Experiments 2 and 3). Interestingly, these results contrast with what is observed in spontaneous production, where fear-type verbs appear earliest. We explain at least some of these early, apparently correct, uses of fear-type verbs as the result of an alternate strategy of placing the animate argument first (Experiment 4).
On the privileged link hypothesis, there are at least two reasons children may have acquired frighten-type verbs before fear-type verbs, despite the latter's higher frequency. First, a privileged link between caused events and transitive syntax may make it easier for children to correctly narrow the hypothesis space for the meaning of frighten-type verbs (they likely describe a caused event) while conversely sending them down the wrong path for fear-type verbs (noting fear-type verbs' transitive syntax, they expect them to refer to caused events, which they do not). Alternatively or additionally, acquisition of frighten-type verbs may have benefited from a privileged link between agents and subjects and between patients and direct objects; fear-type verbs, having neither agents nor patients, cannot benefit from this expectation. On the latter, the frighten-type advantage is in the acquisition of argument structure (distinguishing the semantic roles of the subject and object), whereas on the former, it is in identifying the right type of event (events of frightening, angering, etc.). Thus, if the frighten-type advantage derives from a privileged link between caused events and transitive syntax per se, then one might expect children to learn that frighten describes events of frightening (regardless of the semantic roles of the subject and object) at an earlier age than they learn that fear describes events of fearing, controlling for input frequency. Additional research will be needed to test this possibility.
If the frighten-type advantage is indeed due to a privileged link between causal events and transitive syntax – whether strong or weak – these data provide an important addition to the research described in the ‘Introduction’. Nearly all of that research has investigated caused motion events, raising the question of whether their results generalize to other caused events. Just as importantly, nearly all of this work has compared caused motion events to events that are not normally encoded in transitive syntax in English, and are thus consistent with children having a broad understanding of which types of proposition are encoded with transitive syntax in English (but see Bowerman, Reference Bowerman1990; Naigles & Kako, Reference Naigles and Kako1993; both are discussed in the ‘Introduction’).
In the remainder of this section, we discuss (i) possible alternative explanations for the frighten-type advantage, (ii) the nature of links between syntax and semantics, (iii) the development of the privileged link, and (iv) the implications for the development of the passive.
Alternative explanations
Could anything other than the privileged link hypothesis explain the frighten-type advantage? One possibility we considered above is experimental artifact. Messenger et al. (Reference Messenger, Branigan, McLean and Sorace2012) ascribed their observation of worse performance on fear-type verbs to the difficulty of depicting states visually. This particular concern was mitigated in the present study by using stories as well as pictures (states seem no harder than events to describe). Moreover, the ease of interpreting the stimuli used in Experiment 1 did not predict children's success (Experiment 2). While one can never entirely rule out the existence of some uncontrolled confound in one's stimuli, there is no strong reason remaining to suppose there is one.
Alternatively, it may be the case that although the quality of our stimuli in the experiment was not an issue, the quality of the stimuli in the world is. Perhaps children have more difficulty identifying what is being referred to when hearing like and fear than when hearing surprise and frighten, and thus although fear-type verbs are more frequent, the true opportunities to acquire them are fewer. This is an intriguing possibility, but there are at least as many reasons to think the opposite is true. While events are brief and ephemeral, states are not. If the child blinks, she may miss Antoinette surprising or frightening Buster, while she has many opportunities to observe Antoinette liking or fearing Buster. Relatedly, one reason verbs are famously difficult to learn is that they typically describe future or past events – that is, something that is not present (Akhtar & Tomasello, Reference Akhtar and Tomasello1997; Gleitman, Reference Gleitman1990). This is probably less true for fear-type verbs: while one is unlikely to describe Antoinette surprising or frightening Buster as it happens, we very often do describe someone's current affective state (Antoinette likes Buster. That's why she's being so nice to him). Indeed, a preliminary search of the CHILDES corpora described above resulted in many such examples. Nonetheless, fully addressing this issue requires a well worked-out theory of the ideal conditions for the acquisition of stative as opposed to eventive verbs, which remains an important avenue for future research.
Finally, the input may be more informative about the meaning of frighten-type verbs than fear-type verbs. Inspection of the corpora discussed above showed that while frighten-type verbs are used with a variety of subjects and objects, fear-type verbs – among them especially like, love, and hate – are very often used with the subject I or you. These uses might be interpreted as set phrases, leaving few remaining opportunities to learn the meaning of the verb independent of the specific arguments. Comparison with non-causal verbs that admit a wider variety of subjects and objects in child-directed speech may be informative. Nonetheless, given that children hear orders of magnitude more instances of, e.g. like and hate than surprise and frighten, it remains likely that they receive more total information about the semantics of the former than the latter.
Thus, there are several alternative (or additional) explanations that we cannot fully rule out. At this point, however, they are highly speculative, particularly in contrast to the wealth of empirical and theoretical results consistent with a privileged link between causal events and transitive syntax (Andrews, Reference Andrews and Shopen1985; Arunachalam & Waxman, Reference Arunachalam and Waxman2010; Arunachalam et al., Reference Arunachalam, Escovar, Hansen and Waxman2012; Croft, Reference Croft and Tsohatzidis1990; DeLancy, Reference DeLancy1984; Dittmar et al., Reference Dittmar, Abbot-Smith, Lieven and Tomasello2011; Fernandes et al., Reference Fernandes, Marcus, Di Nubila and Vouloumanos2006; Gibson, Piantadosi, Brink, Bergen, Lim & Saxe, Reference Gibson, Piantadosi, Brink, Bergen, Lim and Saxe2013; Guilfoyle, Reference Guilfoyle, Carnie and Guilfoyle2000; Hopper & Thompson, Reference Hopper and Thompson1980; Kako, Reference Kako2006; Levin, Reference Levin1999; Lidz, Gleitman & Gleitman, Reference Lidz, Gleitman and Gleitman2003; MacWhinney, Reference MacWhinney1977; Naigles, Reference Naigles1990, Reference Naigles1996; Naigles & Kako, Reference Naigles and Kako1993; Nichols, Reference Nichols1975; Noble et al., Reference Noble, Rowland and Pine2011; Pinker, Reference Pinker1984, Reference Pinker1989; Tsunoda, Reference Tsunoda1985; Wheeler et al., Reference Wheeler, Unbegaun, Falla and Thompson2000; Wolff et al., Reference Wolff, Jeon, Klettke, Yu, Malt and Wolff2010; Yuan & Fisher, Reference Yuan and Fisher2009; Yuan et al., Reference Yuan, Fisher and Snedeker2012). Thus, unless or until new data are found to support the alternatives, the privileged link hypothesis should be preferred.
The nature of the privileged link
While the strong privileged link hypothesis often appears in the context of theories on which subject and direct object are cross-linguistically universal constructs (for review, see Levin & Rappaport Hovav, Reference Levin and Rappaport Hovav2005), the universality of subject and direct object is not necessary for the strong privileged link hypothesis: The most basic claim is merely that many properties of those syntactic categories onto which agent and patient map are driven by the fact that agent and patient map onto them.
One such property may be word order. Across languages that have a dominant word order, subjects nearly always precede objects in transitive sentences (Dryer, Reference Dryer, Haspelmath, Dryer, Gil and Comrie2005; Greenberg, Reference Greenberg and Greenberg1963). One possible explanation is a preference for describing agents (the causers of caused events) before patients (the entities affected by those events) (Gibson et al., Reference Gibson, Piantadosi, Brink, Bergen, Lim and Saxe2013; cf. MacWhinney, Reference MacWhinney1977). Note that implicit in this hypothesis is that although many transitive sentences do not describe canonical agents acting on and affecting canonical patients (Sally kicked Mary; The lightning killed Sally; Alfred saw Guinevere; The lamppost leaned against the wall), the word order of these sentences is nonetheless determined by the word order of sentences describing caused events: That is, there is a privileged link between caused events and transitive syntax.
Most discussion of the privileged link hypothesis in the literature focuses on how it would benefit the acquisition of causative verbs. As the discussion above highlights, non-privileged verbs (fear-type verbs, contact verbs, etc.) must be learned, as well. It is presumably for this reason that Pinker's (Reference Pinker1984) semantic bootstrapping theory conceptualizes the privileged link as unidirectional: children expect caused events to appear in transitive syntax but have no particular expectations that a transitive verb necessarily encodes a caused event. While these ‘forward’ semantics-to-syntax mappings are useful for determining how to use a verb for which you already know the meaning – and, as Pinker (Reference Pinker1984) suggested, for learning syntax – they are of little use for learning the meaning of an unknown verb. What is the nature of the ‘reverse’ syntax-to-semantics inferences?
One possibility is that reverse (syntax-to-semantics) mappings are exactly of the same sort as forward (semantics-to-syntax) mappings, simply running in the other direction. Verbs that violate these expectations (fear-type verb, contact verbs, etc.) would have to be learned as exceptions to the general rule, much like irregular morphological forms (walk–walked, jump–jumped, love–loved, but go–went). A related proposal is that non-causal transitive verbs are in fact underlyingly non-transitive and only appear as transitives due to movement (e.g. Belletti & Rizzi, Reference Belletti and Rizzi1988), an unexpected oddity that children would presumably have to learn.
Alternatively, there may only exist forward (semantics-to-syntax) linking rules. Expectations about the semantics of a novel verb are derived by running those mappings backwards, perhaps by Bayesian inference (for a related discussion, see Kako, Reference Kako2006). Thus, the degree to which the learner expects a novel transitive verb to encode a caused event depends on the proportion of transitive verbs already in her lexicon that encode caused events (alternatively, this inference could be performed over types of verb rather than tokens of verb). If the majority of transitive verbs the learner knows are caused events, she will predict caused event semantics for novel transitive verbs, making such verbs easier to learn. Note that if the new verb turns out to have a different semantics, it will be harder to learn but not an exception to the rule, because there is no rule running from syntax to semantics (a verb with an unusual semantics-to-syntax mapping would be a different story).
Directly testing this account is difficult given current research, since on this account predicting what children at different ages should infer about a novel transitive verb, for instance, requires a reasonably accurate census of the verbs in their individual vocabularies. About the latter, little is known. Few, if any, studies test whether children both understand the type of proposition encoded by a given verb (hating vs. dancing vs. waving) and its argument structure (which semantic role is played by which syntactic argument). The only study we have identified is Golinkoff, Hirsh-Pasek, Cauley, and Gordon (Reference Golinkoff, Hirsh-Pasek, Cauley and Gordon1987), which unfortunately tests knowledge of the proposition (dancing vs. waving) for one set of verbs and knowledge of the argument structure for a different set (feed and tickle). Much of our understanding of children's verbal vocabularies comes from spontaneous production, which, as we have seen above, can be unreliable, which also suggests that MacArthur CDI norms (Fenson et al., Reference Fenson, Dale, Reznick, Thal, Bates, Hartung, Pethick and Teilly1993) may be similarly misleading: given that four-year-olds appear to use like, love, and hate correctly, their parents likely mistakenly assume the children have fully acquired the verb.
The development of the privileged link
Whether children explicitly represent reverse (syntax-to-semantics) mappings or infer them from the semantics-to-syntax mappings, the developmental trajectory will be affected by whether the mappings are learned or innate. Few researchers would endorse the claim that all forward (semantics-to-syntax) mappings are innate, for the simple reason that many types of verb exhibit different forward mappings in different languages (e.g. contact verbs; see ‘Introduction’). Pinker's (Reference Pinker1984) semantic bootstrapping account proposes that only a small subset of forward mappings (e.g. caused event → transitive syntax) are innate. As reviewed in the ‘Introduction’, while there is some evidence that children have expectations about the semantics of novel transitive verbs prior to their second birthday, it has not yet been established that these expectations are as specific as is proposed by Pinker. Our own data do show such specificity, but only in four-year-olds. Given the complexities of both depicting and inferring mental states, emotion verbs are not ideal test cases to use with younger children as null results would be hard to interpret; contact verbs would make for a better test.
If mappings between syntax and semantics are learned, the developmental trajectory depends on the underlying representations. For instance, Chang, Dell, and Bock (Reference Chang, Dell and Bock2006) present a model on which mappings are learned but which contains only three semantic roles (roughly agent, patient, and oblique). While it learns a privileged mapping roughly equivalent to one between agent and subject and between patient and direct object, it cannot restrict this mapping to caused events because it cannot distinctly represent caused events. For instance, caused event verbs (break, smash) are represented the same way as contact verbs (hit, touch). The model may be saved by positing more semantic roles, though given the emergentist nature of connectionist models, without actually implementing the model, it is hard to know how this would affect its behavior. Regardless, this highlights the necessity of having a semantics rich enough to distinguish all the classes of verb that empirically behave differently.
In contrast to Chang and colleagues (2006), lexicalist accounts posit that children's semantic roles are initially narrow and verb-specific (e.g. frightener, frightenee, liker, likee) and become more abstract through iterative generalization during development (e.g. Alishahi & Stevenson, Reference Alishahi and Stevenson2010; Tomasello, Reference Tomasello1992). Since, by extension, mappings between syntax and semantics become more abstract rather than less, the fact that four-year-olds have a privileged link between specifically caused events and transitive syntax (as we demonstrate above) implies that the link at two years of age cannot be less specific. Thus, demonstrating that the privileged link elicited in a study of two-year-olds (see ‘Introduction’) is – like four-year-olds' – specific to caused events is an important test for such theories. Note that there is some limited evidence that semantic inferences about transitive verbs does become more abstract with time: Ibbotson, Theakston, Lieven, and Tomasello (Reference Ibbotson, Theakston, Lieven and Tomasello2012) presented adults and four-year-olds with transitive sentences that did not describe canonical caused events. In a subsequent memory test, adults were more likely than the four-year-olds to falsely remember related but more canonically causal lures.
An interesting hybrid theory has been proposed by Fisher and colleagues (Fisher, Reference Fisher1996, Reference Fisher2002; Yuan et al., Reference Yuan, Fisher and Snedeker2012). On this ‘structure-mapping’ account, children come to the language learning problem with an innate preference for, e.g. two-role events to be mapped onto verbs with two distinct syntactic arguments (essentially, the theta criterion; see ‘Introduction’). As such, Lion and Tiger jumped has only one distinct syntactic role (subject) and one distinct event/semantic role (jumper). As children acquire verbs, they begin to acquire mappings between syntax and semantics that are specific to semantic roles. As noted in the ‘Introduction’, data showing that young children expect transitive verbs to describe events with two distinct roles are consistent with this hypothesis (Arunachalam & Waxman, Reference Arunachalam and Waxman2010; Arunachalam et al., Reference Arunachalam, Escovar, Hansen and Waxman2012; Naigles, Reference Naigles1990, Reference Naigles1996; Naigles & Kako, Reference Naigles and Kako1993; Noble et al., Reference Noble, Rowland and Pine2011; Yuan & Fisher, Reference Yuan and Fisher2009; Yuan et al., Reference Yuan, Fisher and Snedeker2012), though an important prediction is that this early privileged link is not specific to caused events. Less clear is how the structure-mapping hypothesis accounts for evidence that two-year-olds also expect the agent of caused events to map to the subject position (Dittmar et al., Reference Dittmar, Abbot-Smith, Lieven and Tomasello2011; Fernandes et al., Reference Fernandes, Marcus, Di Nubila and Vouloumanos2006; Noble et al., Reference Noble, Rowland and Pine2011; but see Akhtar & Tomasello, Reference Akhtar and Tomasello1997), except perhaps if two-year-olds have also already acquired some mappings between syntax and semantics. Thus, an important prediction of the structure-mapping hypothesis is that there is some age at which children expect two-role events to map onto sentences with two argument types but not yet have expectations about which event/semantic role maps onto which syntactic argument.
Passive experiencers
The above results may have implications for the long-standing debate about the acquisition of passive constructions (Fox & Grodzinsky, Reference Fox and Grodzinsky1998; Gordon & Chafetz, Reference Gordon and Chafetz1990; Hirsch & Wexler, Reference Hirsch, Wexler, Deen, Nomura, Schulz and Schwartz2006; Maratsos, Fox, Becker & Chalkley, Reference Maratsos, Fox, Becker and Chalkley1985; Messenger et al., Reference Messenger, Branigan, McLean and Sorace2012; Pinker, Reference Pinker1989). A number of studies have reported that children are delayed at comprehending the passives of non-causal verbs, with research focusing in particular on experiencer–subject verbs, which include perception verbs (smell, hear), mental activity verbs (know, remember), and fear-type verbs. This has been explained variously as evidence for delayed acquisition of adult syntactic categories/processes (Fox & Grodzinsky, Reference Fox and Grodzinsky1998; Hirsch & Wexler, Reference Hirsch, Wexler, Deen, Nomura, Schulz and Schwartz2006), evidence that children initially apply passivization only to verbs describing canonically caused events (Maratsos et al., Reference Maratsos, Fox, Becker and Chalkley1985; Pinker, Reference Pinker1989), or as a confound of the task used (Messenger et al., Reference Messenger, Branigan, McLean and Sorace2012). Each of these accounts makes different assumptions about the nature of the passive construction and its acquisition, making these results and this debate of broad interest.
The results above suggest an additional explanation: in some cases, poor performance on experiencer–subject passives may be due to incomplete acquisition of the active form. (Note that this assumes asymmetric dependence of the passive form on the active form – a common but far from universal assumption across theories.) For instance, Messenger and colleagues (2012) found that children indeed had more difficulty with the active forms of the experiencer–subject verbs relative to other verbs used in their study (see ‘Results and discussion’ to Experiment 1 above). Note that this suggestion is not mutually exclusive with any of those described above – in fact, our claim that children are delayed at acquiring non-causal transitive verbs meshes well with the suggestion that children are delayed at learning to passivize non-causal verbs (see especially Maratsos et al., Reference Maratsos, Fox, Becker and Chalkley1985; Pinker, Reference Pinker1989) – and may not play any role in studies where children were as likely to know the active forms of the action verbs and experiencer–subject verbs employed (e.g. Gordon & Chafetz, Reference Gordon and Chafetz1990; Maratsos et al., Reference Maratsos, Fox, Becker and Chalkley1985). However, this consideration could be a factor even in those studies if non-causal transitive verbs are processed differently from canonically causal transitive verbs even by adults (cf. Paczynski & Kuperberg, Reference Paczynski and Kuperberg2011). Regardless, this will be an issue researchers will want to consider when conducting future studies on the acquisition of the passive.
CONCLUSION
While the above discussion does not exhaust the range of theories entertained in the literature, it is enough to demonstrate that current empirical data is consistent with a wide range of possibilities, and also to point out what kind of data is needed to constrain the theoretical possibilities. In particular, now that it is well established that young children have expectations about the semantics of a verb given its syntax, we need to determine what the boundary conditions and constraints on those expectations are. The present work provides some of these boundary conditions and constraints, but data from younger children and from additional types of verb (e.g. contact verbs) is needed. Similarly, teasing apart the predictions of different theories will in many cases require a much richer description of children's early verb lexicons and how they change in the first couple of years of acquisition.
APPENDIX
Examples of one stimulus for each verb in Experiment 1 are included below.
Admire.
Amaze.
Bore.
Confuse.
Fear.
Frighten.
Hate.
Like.
Love.
Scare.
Surprise.
Trust.