INTRODUCTION
Coastal zones are among the most productive systems on the planet (Odum, Reference Odum1983) and offer a wide array of resources and ecosystem services that have always attracted human populations and anthropogenic activities. For centuries, multiple direct and indirect human influences have significantly modified coastal ecosystems, especially harbours and semi-enclosed basins that embody the interface between cities and the sea. In the last decades, the exacerbation of coastal areas' deterioration has increased the concern about their management and protection. In response, a huge effort has been made by the scientific community to collect data in order to develop effective tools aimed at properly assessing the environmental/ecological status of a given area and then addressing remediation actions. The Italian RITMARE project (la RicercaITaliana per il MARE – Italian Research for the Sea), running in the period 2012–2016, is one of the most recent examples of such an effort. Prioritizing sites for which it is possible to address issues relevant to society (impacts of human activities and maritime spatial planning), the project focused on marine areas of strategic importance, in order to support integrated policies for the safeguard of the environment (Cardellicchio et al., Reference Cardellicchio, Annicchiarico, Di Leo, Giandomenico and Spada2016a). Among these, the coastal area of Taranto (Ionian Sea, Italy) was selected for its complex industrial and productive infrastructure and the consequent potential threat for the marine environment. In particular, the effort was concentrated on the Mar Piccolo due to its suitability as an ‘on field’ laboratory for investigating release/diffusion mechanisms of contaminants, evaluating chemical-ecological risks towards the marine ecosystem and testing potential remediation strategies for contaminated sediments (Cardellicchio et al., Reference Cardellicchio, Annicchiarico, Di Leo, Giandomenico and Spada2016a). Since the 1960s, industrial activities have been affecting this semi-enclosed basin to such an extent that, at present, the largest steelworks in Europe, the main navy arsenal in Italy and other smaller industrial plants are responsible for the severe contamination of the area by disposing of heavy metals, polycyclic aromatic hydrocarbons (PAHs) and polychlorinated biphenyls (PCBs) via sewage discharge, dumping and river runoff (Cardellicchio et al., Reference Cardellicchio, Annicchiarico, Di Leo, Giandomenico and Spada2016a and references therein). Furthermore, the release of nitrogen-rich waste from mussel farms that occupy an extensive portion of the basin was identified as one of the main causes for the persistence of eutrophic conditions at least in its innermost part (Bongiorni et al., Reference Bongiorni, Fiorentino, Auriemma, Bernardi Aubry, Camatti, Camin, Nasi, Pansera, Ziller and Grall2016). Within the RITMARE framework, therefore, a task force of researchers carried out a complete and integrated environmental characterization of the Mar Piccolo and the knowledge obtained was then suitable as a starting point for decision makers to define appropriate management strategies (Cardellicchio et al., Reference Cardellicchio, Covelli and Cibic2016b). According to such characterization, natural and anthropogenic pressures were detected at the basin scale and several ecosystem components were shown to respond to these. Overall, the former can be ascribed to a gradual transition from marine to more brackish environmental conditions, i.e. from the area near the channel to the innermost part of the basin, while the main anthropogenic pressure was the severe contamination due to heavy metals and PCBs, which was more pronounced near the navy arsenal (Cibic et al., Reference Cibic, Bongiorni, Borfecchia, Di Leo, Franzo, Giandomenico, Karuza, Micheli, Rogelja, Spada and Del Negro2016; Franzo et al., Reference Franzo, Auriemma, Nasi, Vojvoda, Pallavicini, Cibic and Del Negro2016). Although this contamination seemed to affect both the pelagic and the benthic systems of the basin, the latter had more impact due to the tendency of contaminants to accumulate in the sediments (Cibic et al., Reference Cibic, Bongiorni, Borfecchia, Di Leo, Franzo, Giandomenico, Karuza, Micheli, Rogelja, Spada and Del Negro2016).
Although the main benthic communities (i.e. microphytobenthos, Rubino et al., Reference Rubino, Cibic, Belmonte and Rogelja2016; meio- and macrofauna, Franzo et al., Reference Franzo, Auriemma, Nasi, Vojvoda, Pallavicini, Cibic and Del Negro2016) were already investigated in terms of abundance and composition, a detailed study of free-living nematodes was not included in the environmental characterization, hampering a comprehensive understanding of the Mar Piccolo ecosystem. Being the typical dominant and the most diverse group of meiofauna (Balsamo et al., Reference Balsamo, Albertelli, Ceccherelli, Coccioni, Colangelo, Curini-Galletti, Danovaro, D'Addabbo, De Leonardis, Fabiano, Frontalini, Gallo, Gambi, Guidi, Moreno, Pusceddu, Sandulli, Semprucci, Todaro and Tongiorgi2010; Appeltans et al., Reference Appeltans, Ahyong, Anderson, Angel, Artois, Bailly and Bamber2012), nematodes fulfil a large portion of the ecological role of this important community. Meiofauna, and then nematodes, act as vertical conveyors within sediments and between sediments and the overlying water by bioturbating sediments and generating bioconstructions (e.g. burrows and mucous spots). These activities influence the structure and the main processes in the sedimentary environment such as the permeability/stability of sediments, nutrient cycling, biogeochemical fluxes and chemical gradients (Schratzberger & Ingels, Reference Schratzberger and Ingels2018 and references therein). This community occupies a unique position in the benthic food web since it is at the same time both a consumer of a range of carbon sources and a food source for secondary consumers. Meiofauna can affect other benthic communities with repercussions on the ecosystem scale. The predation on microbiota, for example, contributes to maintain microbes at an active phase of growth, with the consequent stimulation of microbial activities like the breakdown of organic matter (Schratzberger & Ingels, Reference Schratzberger and Ingels2018).
The assessment of the environmental/ecological status of the Mar Piccolo can give further useful indications in supporting integrated policies aimed at the safeguarding of the environment. For the classification of water bodies, European umbrella regulations such as the Water Framework Directive recommend the use of biological indicators as EcoQ (Ecological Quality) parameters. Benthic assemblages, living in close contact with sediment particles and interstitial water, are directly exposed to adverse ecological conditions and may respond to them by showing local extinctions, taxonomic and functional structure changes and diversity loss. Nematodes represent a good alternative to macrobenthos as Ecological Indicators (EcoInds), because they are permanent members of the benthos with short generation time and lack of larval dispersal (Moreno et al., Reference Moreno, Semprucci, Vezzulli, Balsamo, Fabiano and Albertelli2011; Semprucci et al., Reference Semprucci, Losi and Moreno2015b). Moreno et al. (Reference Moreno, Semprucci, Vezzulli, Balsamo, Fabiano and Albertelli2011) suggested a suite of thresholds specifically designed for nematodes and their associated indices/metrics for the assessment of the Ecological Quality Status (EQS) of coastal areas. These thresholds were successful in detecting Good/Bad ecological conditions in shallow marine systems subjected to riverine inputs (Semprucci et al., Reference Semprucci, Frontalini, Sbrocca, Armynot du Châtelet, Bout-Roumazeilles, Coccioni and Balsamo2015a), in tourist marinas (Moreno et al., Reference Moreno, Albertelli and Fabiano2009) and in ports (Moreno et al., Reference Moreno, Ferrero, Gallizia, Vezzulli, Albertelli and Fabiano2008; Losi et al., Reference Losi, Ferrero, Moreno, Gaozza, Rovere, Firpo, Marques and Albertelli2013). Concerning the Mar Piccolo of Taranto, only Sandulli et al. (Reference Sandulli, Carriglio, Deastis, Marzano, Gallo D'Addabbo, Gerardi and De Zio Grimaldi2004) provided a glimpse on free-living nematodes inhabiting the basin, while the assessment of the EQS by means of these organisms has never been attempted.
In view of the scarcity of data on nematofauna from the Mar Piccolo, in the present study we provide an updated and complete description of this assemblage inserting this knowledge in the context of the integrated characterization of the basin developed during the RITMARE project. Abundance, diversity and genera composition of free-living nematodes were related to both the main natural (confinement gradient) and anthropogenic (different contamination levels) pressures acting on the basin (Cibic et al., Reference Cibic, Bongiorni, Borfecchia, Di Leo, Franzo, Giandomenico, Karuza, Micheli, Rogelja, Spada and Del Negro2016; Franzo et al., Reference Franzo, Auriemma, Nasi, Vojvoda, Pallavicini, Cibic and Del Negro2016). In addition, for the first time the EQS of the Mar Piccolo was assessed by identifying nematodes to the genus level and by applying the main indicators/indices specifically developed for these organisms (i.e. sensitive/tolerant genera, the Index of Trophic Diversity and the Maturity Index).
We addressed, therefore, the following questions: (1) Do nematode assemblages change within the Mar Piccolo of Taranto according to the increasing environmental confinement? (2) Do nematodes respond to the severe contamination of the sediments? (3) What is the EQS of the Mar Piccolo according to EcoInds based on nematode assemblages?
MATERIALS AND METHODS
Study site and sampling
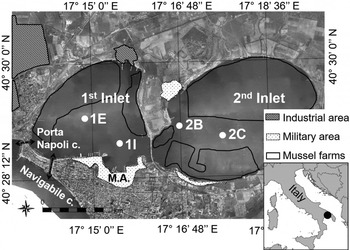
The Mar Piccolo of Taranto is a semi-enclosed basin with lagoonal features divided into two inlets: the first is close to the navy arsenal and the steelworks plant, while the second is mainly influenced by mussel farms. Maximum depth is equal to 13 and 8 m, respectively. While tidal range does not exceed 30–40 cm, scarce hydrodynamism characterizes the whole basin. The low water exchange takes place through two narrow channels in the first inlet, which connect the basin to the Mar Grande: the ‘Navigabile’ and the ‘Porta Napoli’ channels (Figure 1).
The Mar Piccolo of Taranto with the four investigated stations (modified from Franzo et al., Reference Franzo, Auriemma, Nasi, Vojvoda, Pallavicini, Cibic and Del Negro2016). The main anthropogenic pressures are highlighted: the industrial area, the military arsenal and the mussel farms. Porta Napoli c., Porta Napoli channel; Navigabile c., Navigabile channel; MA, Military arsenal.
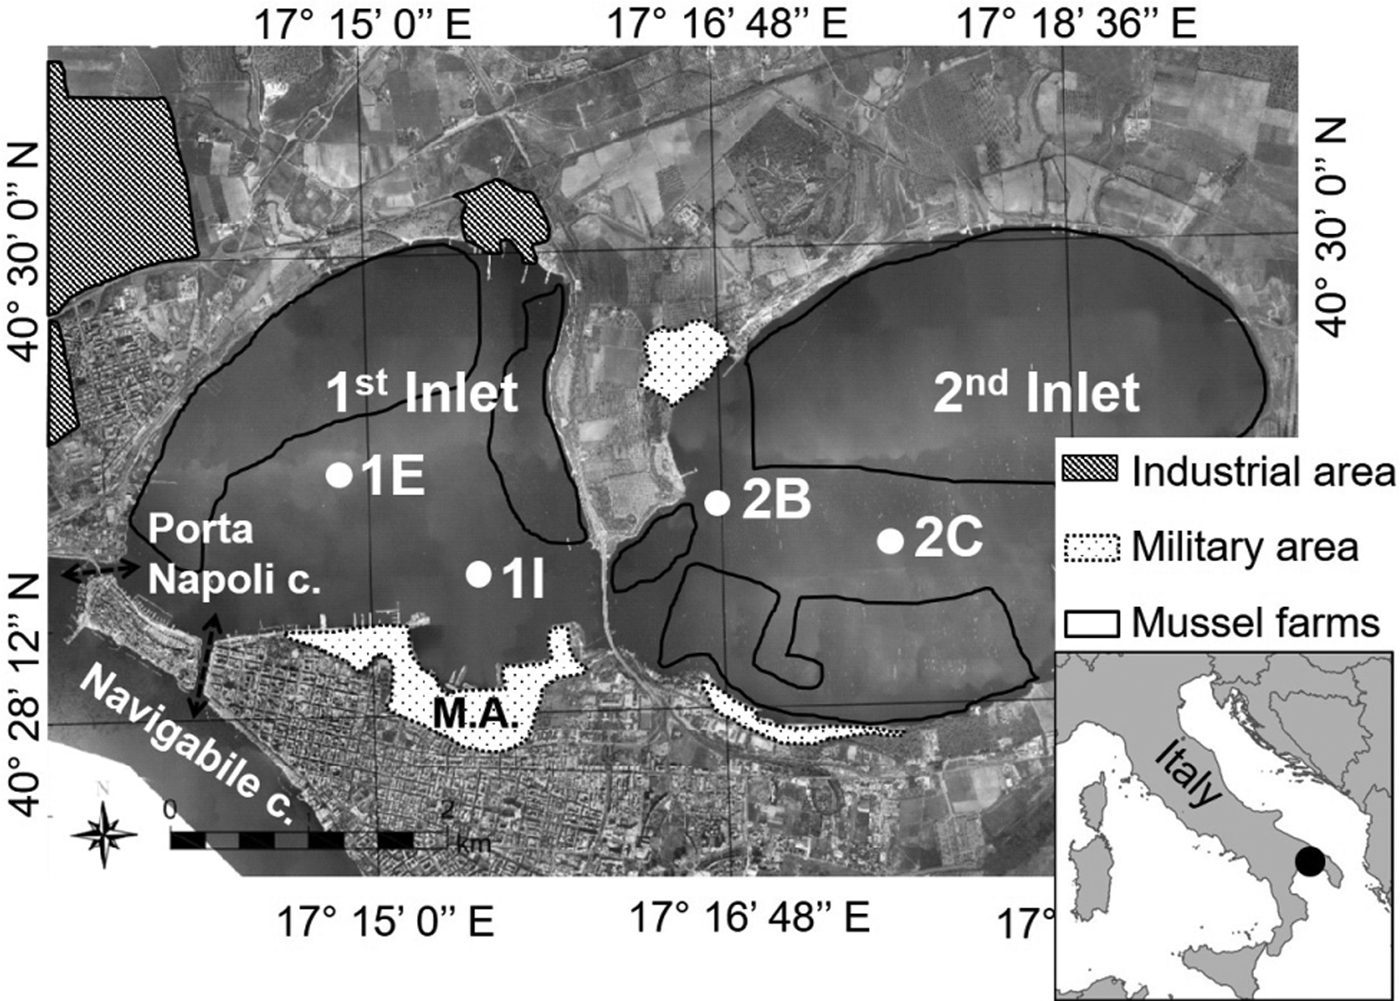
In June 2013 and April 2014, sampling was carried out at four sites located at increasing distance from the channels and selected as representatives of different environmental issues and anthropogenic impacts (Figure 1). In the first inlet, St. 1E (40°29′01N 17°14′46E) and St. 1I (40°28′46N 17°15′38E) should summarize the environmental features of the area in front of the ‘Navigabile’ channel and the nearby military navy arsenal, respectively. In the second inlet, St. 2B (40°28′57N 17°16′42E) and St. 2C (40°28′57N 17°17′41E) were selected as representatives of the most enclosed part of the Mar Piccolo. These two stations were chosen to represent an increasing distance from the main sources of industrial pollution (located mainly in the first inlet) and, at the same time, a more pronounced influence of mussel farms.
Simultaneously with the collection of sediment samples for nematodes and for the environmental variables used in the present study (Table 1), depth and salinity were measured using a Seabird 19 PlusSeacat probe. At each station, scuba divers collected five virtually undisturbed sediment cores using polycarbonate sample tubes (internal diameter: 12.7 cm, surface area: 127 cm2). When conspicuous as at St. 2B and St. 2C, macroalgae were avoided in order to maintain the same sampling conditions at all sites. Four cores were dedicated to environmental variables following specific protocols as exhaustively described in Rubino et al. (Reference Rubino, Cibic, Belmonte and Rogelja2016) for sediment grain-size, Franzo et al. (Reference Franzo, Auriemma, Nasi, Vojvoda, Pallavicini, Cibic and Del Negro2016) for Total Nitrogen (TN) and Biopolymeric Carbon (composed of proteins, lipids and carbohydrates) and Di Leo et al. (Reference Di Leo, Annicchiarico, Cardellicchio, Cibic, Comici, Giandomenico and Spada2016) for contaminants (Total Hg and Total PCBs).
Environmental data measured at the sea bottom (depth and salinity) and in the sediments at the four stations.

TN, total nitrogen; C-PRT, proteins; C-CHO, carbohydrates; C-LIP, lipids; J13, June 2013; A14, April 2014.
a Rubino et al. (Reference Rubino, Cibic, Belmonte and Rogelja2016).
For meiofauna/nematodes, three pseudo-replicates were subsampled from one dedicated sediment core by using cut-off plastic syringes (internal diameter: 2.7 cm, surface area: 5.72 cm2) and immediately frozen at −20 °C. Once defrosted, the top 10 cm of the sediment samples were extruded and preserved in buffered 4% formaldehyde solution using prefiltered seawater. Meiofaunal organisms (38–1000 µm) were extracted from sediment samples as described in Franzo et al. (Reference Franzo, Auriemma, Nasi, Vojvoda, Pallavicini, Cibic and Del Negro2016). One pseudoreplicate from St. 1E and St. 2C (June 2013), and from St. 1I (April 2014) was lost during processing. Nematodes were counted under a stereomicroscope (Olympus SZX12; final magnification of 40 or 80×) and their abundance was expressed as individuals per 10 cm2.
Nematode community
One hundred nematodes from each replicate were randomly picked out using a fine pin under a stereomicroscope (Zeiss Discovery V20, magnification 40×). The organisms were transferred from formalin to glycerol through a series of ethanol-glycerol solutions and mounted on permanent glass slides in anhydrous glycerin, following the procedure described by Seinhorst (Reference Seinhorst1959). Nematodes were identified at the genus level using the pictorial keys of Platt & Warwick (Reference Platt and Warwick1983, Reference Platt and Warwick1988) and Warwick et al. (Reference Warwick, Platt and Somerfield1998), as well as the original species descriptions and identification keys available through NeMys (Guilini et al., Reference Guilini, Bezerra, Eisendle-Flöckner, Deprez, Fonseca, Holovachov, Leduc, Miljutin, Moens, Sharma, Smol, Tchesunov, Mokievsky, Vanaverbeke, Vanreusel, Venekey and Vincx2017).
The trophic structure of nematode assemblages was studied by assigning each genus to one of four feeding groups according to Wieser (Reference Wieser1953): selective (1A) and non-selective (1B) deposit feeders, epistrate feeders (2A) and predators/omnivores (2B). The Index of Trophic Diversity (ITD) was calculated according to Heip et al. (Reference Heip, Vincx and Vranken1985): ITD = ∑θ2, where θ is the percentage contribution of each feeding type. ITD values range from 0.25 (the highest trophic diversity; i.e. each trophic group accounts for 25% of the nematode assemblage) to 1.0 (the lowest trophic diversity; i.e. one feeding type represents 100% of the organisms). The maturity index (MI, Bongers, Reference Bongers1990; Bongers et al., Reference Bongers, Alkemade and Yeates1991) was calculated as the weighted average of the individual colonizer-persister (c-p) values: MI = ∑v(i)f(i), where v is the c-p value of genus i and f(i) is the frequency of that genus. This index is based on the gradual discrimination among r-strategist (colonizers, i.e. c-p1 and c-p2) towards k-strategist nematodes (persisters; i.e. c-p4 and c-p5).
Statistical analysis
Univariate and multivariate analyses were performed using the PRIMER v7 software package (Clarke & Warwick, Reference Clarke and Warwick2001) with the PERMANOVA add-on package (Anderson et al., Reference Anderson, Gorley and Clarke2008).
Principal Component Analysis (PCA) was carried out on environmental data (Table 1) in order to visualize the trends of the main abiotic variables. Salinity, sand %, TN, proteins, lipids and total carbohydrates were included in the analysis together with total PCBs and total Hg. Mud % and depth were excluded: the first variable is redundant in respect to sand % (mud % = 1-sand %), whereas the fact that at each station depth remained the same during the two periods masked the differences between June 2013 and April 2014 due to the other environmental variables.
Taxonomic diversity indices (d, Margalef, Reference Margalef1986; H′ log2, Shannon & Weaver, Reference Shannon and Weaver1949) were calculated based on nematode genera abundances.
To test for temporal and spatial differences in nematode assemblage composition, a two-way PERMANOVA analysis was carried out with the following crossed factor design: ‘period’ and ‘station’ as fixed factors with 2 (June 2013 and April 2014) and 4 levels (1E, 1I, 2B and 2C), respectively. Prior to analysis, genera abundance data were square root transformed to scale down densities of highly abundant genera and therefore increase the importance of less abundant ones. The PERMANOVA test was conducted on the Bray–Curtis similarity matrix with permutation of the residuals under a reduced model (9999 permutations). The null hypothesis (i.e. no significant difference between nematode assemblages at the four stations and during the two periods) was rejected when the significance level P was <0.05. The Monte Carlo permutation P was used when the number of permutations was lower than 150. If significant differences were detected, a posteriori pair-wise comparisons were performed using 9999 permutations under a reduced model. To visualize the differences in nematode composition at the four stations and during the two periods, a principal coordinates analysis (PCO) was used with Bray–Curtis as similarity measure. On the PCO output, a similarity profiles (SIMPROF) analysis was used to test significant differences (P < 0.05) in nematode assemblages from different stations/periods.
Afterwards, the relative contribution of each genus to the average dissimilarities between stations and periods was calculated using a two-way crossed similarity percentage procedure (SIMPER, cut-off percentage: 50%).
To test the null hypothesis on the main nematofauna descriptors, two-way PERMANOVA analysis was applied to nematode abundance, trophic composition, d, H′, ITD and MI, using the same design described for nematode genera, but based on Euclidean-distance similarity matrices with 9999 permutations of residuals under a reduced model.
The relationships between the main environmental variables and the structure of the nematode assemblage were explored by carrying out the BIOENV routine (Clarke & Ainsworth, Reference Clarke and Ainsworth1993) using Spearman's correlation. The set of environmental variables included in the analysis (Table 1) was tested for collinearity (Draftsman plot and Spearman correlation matrix) and redundant variables (with correlation r 2 > 0.90) were omitted from the analysis. To compensate for skewness, log(X) transformation was performed on total Hg, total PCBs, lipids, proteins and carbohydrates while salinity and TN were square-root transformed and sand % was arcsine-transformed. All variables were normalized prior to analysis.
RESULTS
Overall, the main environmental variables considered in the present study (Table 1) suggested that the four sampling stations represented different environmental situations. St. 1E and 1I were deeper than St. 2B and 2C and characterized by slightly coarser sediments, in particular compared to St. 2C, where sand per cent was <3% during both campaigns. Focusing on the sedimentary organic pool, the highest concentrations of TN characterized the second inlet while the first one showed higher amounts of lipids, especially at the site nearby the navy arsenal (St. 1I). Total carbohydrates were more elevated in the second inlet during June 2013 while proteins showed some variability among stations and periods. Focusing on the considered contaminants, at St. 1I Hg and PCBs amounts were two orders of magnitude higher than those at St. 2C during both campaigns. PCA illustrated the above-described differences among stations by clearly separating St. 1E and 1I on the right side of the plot, from St. 2B and 2C on the left side (Figure 2). The ordination plot accounted for 69.2% of the total variance that was explained by the principal component axis 1 (PC1) for 42.9% and by PC2 for 26.3%. The site nearby the navy arsenal showed to be mainly influenced by PCBs, Hg and lipids during both campaigns while St. 2B and St. 2C were characterized by TN, total proteins and carbohydrates, especially during June 2013.
Principal component analysis of the main environmental variables. TN, total nitrogen; C-PRT, proteins; C-CHO, carbohydrates; C-LIP, lipids; J13, June 2013; A14, April 2014.

In June 2013, nematode abundance varied between 299.4 ± 245.3 and 1225.9 ± 707.8 ind. 10 cm−2 at St. 1I and St. 1E, respectively, while the sites of the second inlet showed intermediate values (Table 2). In April 2014, lower abundances were detected at all stations and the same pattern of the first campaign was observed: the maximum at the station close to the channel (639.7 ± 336.2 ind. 10 cm−2), the minimum at the site near the navy arsenal (102.1 ± 38.7 ind. 10 cm−2, Table 2). PERMANOVA analysis showed that nematode abundance significantly differed according to the factors ‘period’ and ‘station’ (Table 3). In June 2013, nematode abundances were significantly higher than in April 2014 and St. 1I statistically differed from all the other stations due to the lower abundances that characterized its sediments (Table 4).
Average density (ind. 10 cm−2), percentage of contribution (%) and rank by density (Rk) of nematode genera in each area.

J13, June 2013; A14, April 2014.
Only genera with a Relative Abundance (RA) >1% are listed. The five most abundant genera at each site are marked in bold.
Outputs of the two-factor PERMANOVA test (‘period’ with 2 levels and ‘station’ with 4 levels, as fixed factors).

Per × stat, the interaction term of both factors (i.e. period × station).
Significant differences (i.e. P < 0.05) are indicated in bold.
Outputs of the a posteriori pair-wise comparisons according to the factor ‘station’ (A); the interaction of factors ‘period’ and ‘station’ for pairs of levels of the factor ‘period’ (B) and for pairs of levels of factor ‘station’ (C).

Significant differences (i.e. P < 0.05) are indicated in bold.
Overall, 64 genera of free-living nematodes, belonging to 23 families, were identified. Among them, Xyalidae (21.21%), Linhomoeidae (20.89%), Cyatholaimidae (11.94%) and Comesomatidae (8.13%) were the dominant families. The number of genera was higher in June 2013 than in April 2014 (Table 3) and ranged from 23 (St. 2C) to 32 (St. 1E) in June 2013, and from 12 (St. 1I) to 30 (St. 1E) in April 2014 (Table 2). The number of genera at St. 1E was significantly higher than at St. 1I and 2B while at St. 1I the value was significantly lower than at St. 2B (Table 4).
Considering the average of all sampling periods and stations, eight genera represented more than 58% of the whole community and their abundances remarkably varied both spatially and temporally (Table 2, Figure 3). Pomponema was the dominant genus in the first inlet during June 2013, while it was completely absent at St. 2B and St. 2C during both periods. In the first inlet, Cyatholaimidae were represented also by Marylynnia (St. 1E and St. 1I in June 2013; St. 1E in April 2014) and, to a lesser extent, by Paralongicyatholaimus. St. 1E was also characterized by Terschellingia since this genus was the second and the first most abundant in June 2013 and April 2014, respectively. On the other hand, Theristus mainly characterized the sediments of the second inlet, especially in April 2014. At St. 2C, the assemblage was dominated by Diplolaimella during the first campaign and by Leptolaimus during the second one, a genus that was not encountered in the first inlet during the same period.
Contribution (%) of the eight most abundant nematode genera. J13, June 2013; A14, April 2014.

Focusing on the trophic structure of nematode assemblage, in June 2013 non-selective deposit feeders (1B) dominated St. 2C, due to the high abundances of Diplolaimella and Theristus. Similarly, at St. 2B, during April 2014 this trophic group accounted for more than 60% of the community due to the high numbers of Diplolaimella, Theristus and Metalinhomoeus. At St. 1E, the four trophic groups were equally represented during both campaigns (Figure 4). PERMANOVA analysis revealed a significant interaction between factors ‘period’ and ‘station’ in the trophic structure of nematode assemblage (Table 3). Pair-wise outputs indicated that at both St. 2B and St. 2C the trophic structure of nematodes was statistically different by comparing the two periods of the study. Moreover, St. 2C significantly differed from St. 2B during June 2013 while St. 1I differed from both St. 1E and St. 2C during April 2014 (Table 4).
Contribution (%) of the trophic groups according to Wieser (Reference Wieser1953). 1A, selective deposit feeders; 1B, non-selective deposit feeders; 2A, epistrate feeders; 2B, predators/omnivores; J13, June 2013; A14, April 2014.

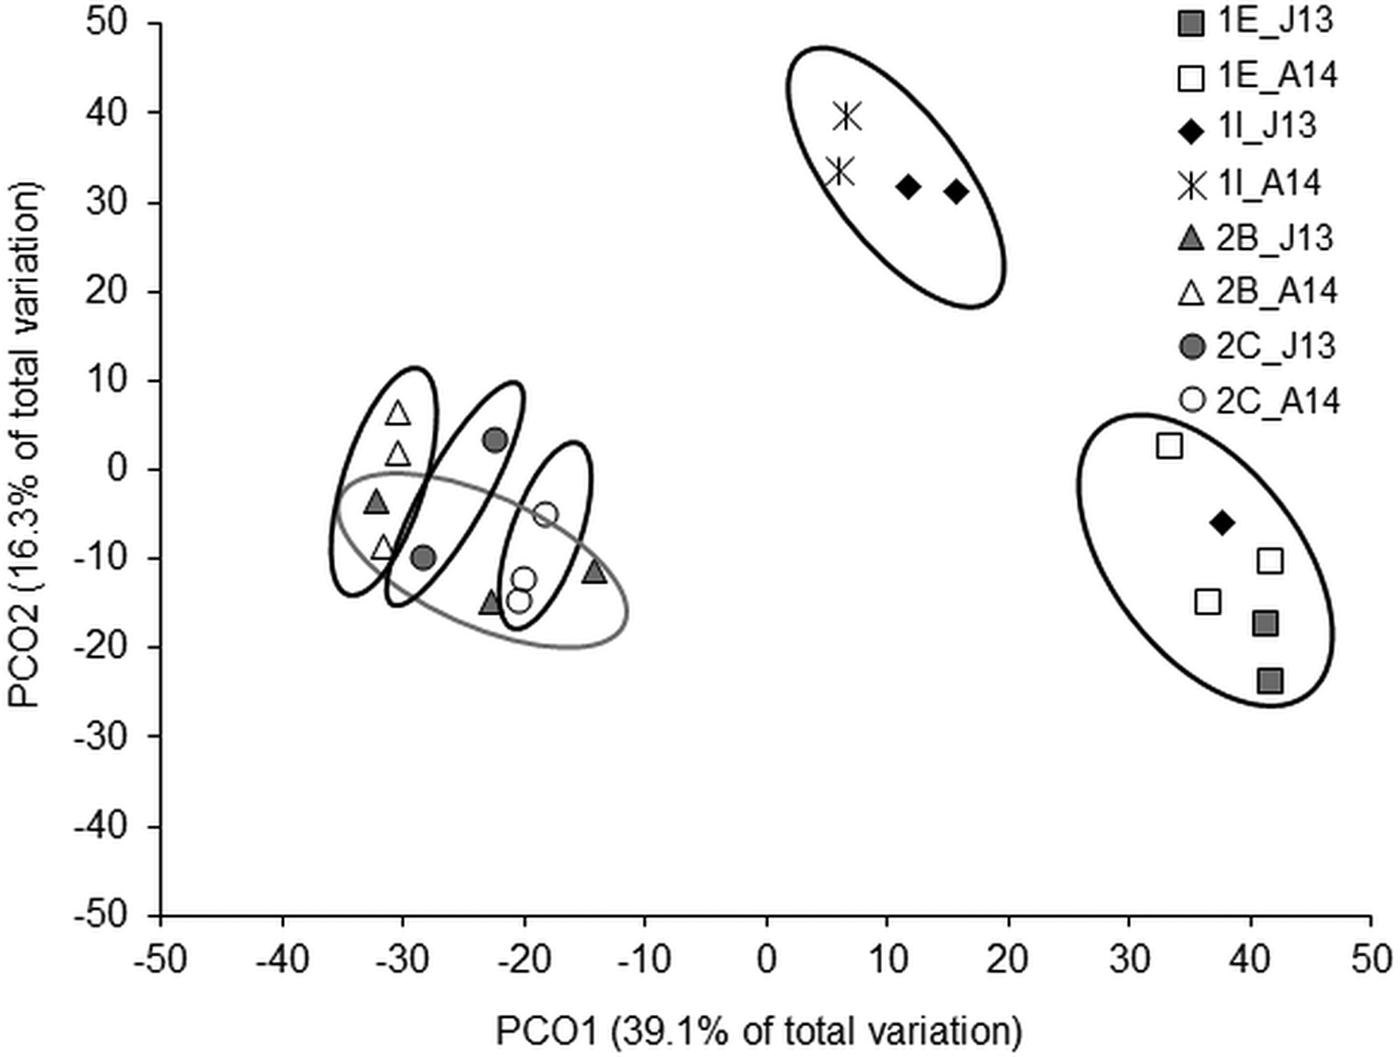
Regarding the overall composition of nematodes, the two-way PERMANOVA analysis showed a significant interaction between ‘period’ and ‘station’ (Table 3). Pair-wise comparison indicated that in the second inlet nematode assemblages of June 2013 statistically differed from those of April 2014. However, a more pronounced difference in the genera composition was evidenced from the comparison among stations. Nematode assemblages of the first inlet were statistically different from those of the second one both in June 2013 and in April 2014. Furthermore, the comparison between St. 2B and St. 2C indicated a significant difference in nematode composition even within the same inlet (Table 4). The PCO analysis explained 55.4% of total variance in the nematode composition on the first two axes (39.1% and 16.3%, respectively) (Figure 5). The stations were distinctly separated in six groups. Two of them clearly gathered all samplings of St. 1E and almost all samplings of St. 1I, respectively. Although located closer to each other in the plot, the samplings from the second inlet formed the remaining four groups, as indicated by the SIMPROF.
Principal coordinates analysis based on nematode genera at each station and both sampling periods. Circles represent SIMPROF groups (P < 0.05). J13, June 2013; A14, April 2014.
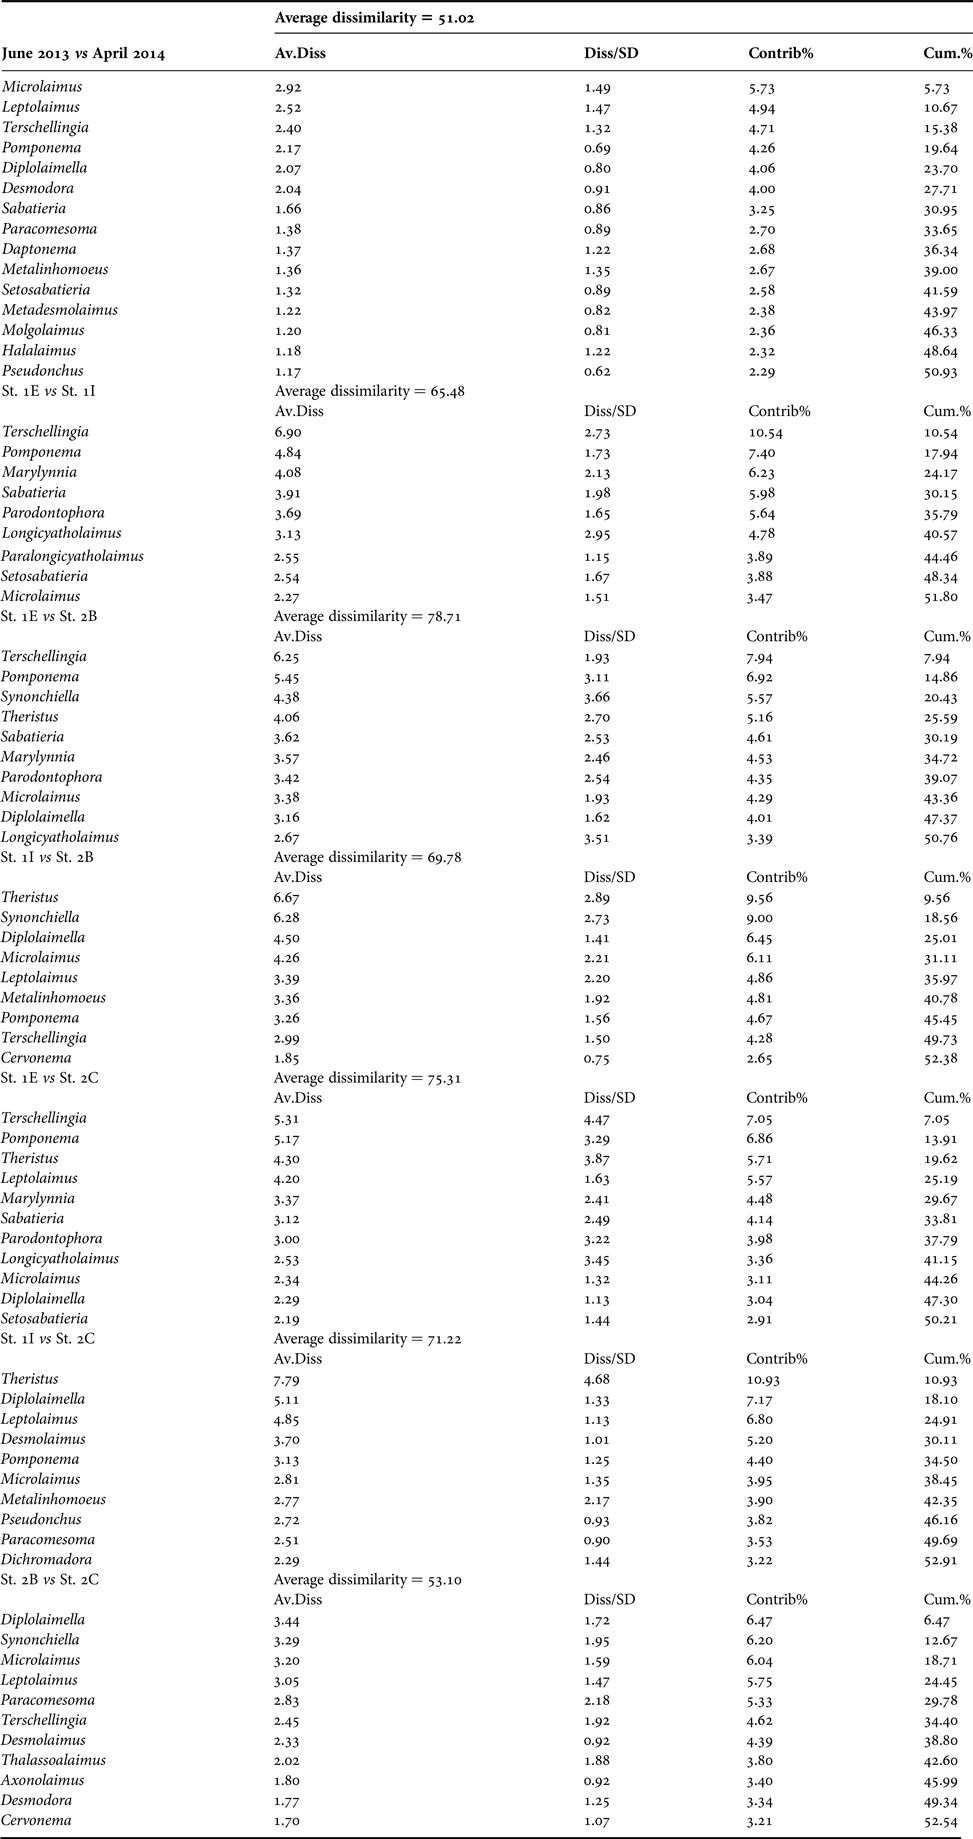
Two-way SIMPER analysis showed to what extent nematode genera contributed to the dissimilarity of the assemblages at different sites and during both periods (Appendix). Also considering the temporal variability that characterized the nematode assemblage of the same station, the community at St. 1E was overall different from that observed at all the other investigated stations. The highest dissimilarity was reported, in fact, between St. 1E and the stations of the second inlet: 78.71% and 75.31% when compared with St. 2B and St. 2C, respectively. The nematode assemblages from sites of the same inlet were less dissimilar: 65.48% and 53.10%, when the sites of the first and second inlet were compared, respectively. The comparison between St. 1I and the stations of the second inlet showed less pronounced dissimilarities, indicating a composition in-between the assemblage at the marine St. 1E and at the innermost sites St. 2B and 2C.
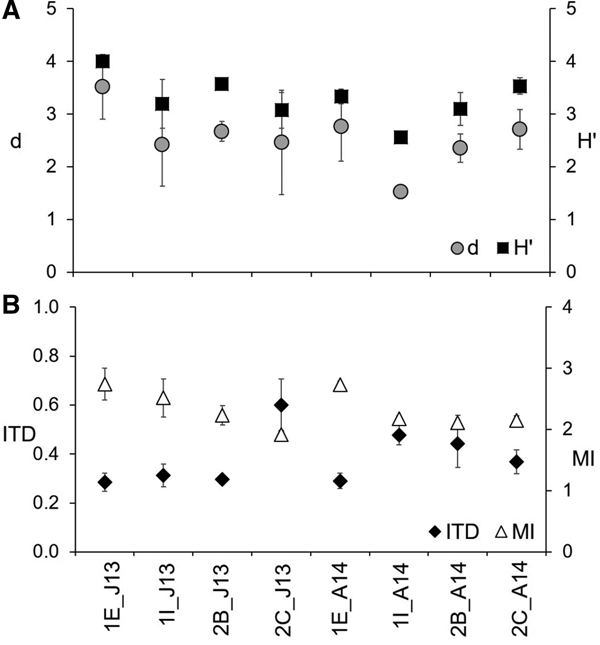
Throughout the study, diversity indices displayed the same pattern, as shown in Figure 6A. Focusing on d, maxima and minima were obtained at St. 1E and at St. 1I, respectively, during both periods. Overall, the nematode assemblage was more biodiverse during the first campaign since d ranged from 2.42 ± 0.78 to 3.52 ± 0.61 in June 2013, and between 1.53 ± 0.13 and 2.76 ± 0.65 in April 2014. Interestingly, the station in the middle of the second inlet showed an opposite pattern with a more diverse nematode assemblage during the second campaign (2.71 ± 0.38) than during the first one (2.46 ± 0.99). PERMANOVA analysis on d data highlighted significant differences among stations (Table 3) and, more precisely, between St. 1E and St. 1I, as indicated by the pair-wise comparison (Table 4). Similarly, H′ was on average slightly higher in June 2013 (3.5 ± 0.4) than in April 2014 (3.1 ± 0.4). Values varied from 3.1 ± 0.3 (St. 2C) to 4.0 ± 0.1 (St. 1E) during the first campaign, and between 2.6 ± 0.1 (St. 1I) and 3.5 ± 0.2 (St. 2C) during the second one. Overall, the site close to the channel harboured a more diverse nematode community while the sediments nearby the military arsenal were characterized by the lowest biodiversity. The sites of the second inlet showed a certain degree of variability depending on the period. PERMANOVA analysis on H′ data showed a significant interaction between ‘period’ and ‘station’ (Table 3) and the pair-wise comparison indicated that St. 1E statistically differed between June 2013 and April 2014. Moreover, during the first campaign, this site differed from St. 2B while during the second one, St. 1I differed from St. 1E and St. 2C (Table 4).
Values of Margalef (d) and Shannon–Weaver (H′) indices (A); values of Index of Trophic Diversity (ITD) and Maturity Index (MI) at the four stations during both periods (B). J13, June 2013; A14, April 2014.

Overall, ITD values were higher in April 2014 than in June 2013, as shown in Figure 6B. During the first campaign, the lowest ITD, equal to 0.28 ± 0.04, was measured at St. 1E while the maximum (0.60 ± 0.10) at St. 2C. In April 2014, ITD varied from 0.29 ± 0.03 to 0.48 ± 0.04 at St. 1E and 1I, respectively. Significant interactions between ‘period’ and ‘station’ were indicated by PERMANOVA main results (Table 3). The pair-wise comparison showed that ITD values did not change between the two periods of the study at St. 1E, only. In June 2013, St. 2C differed from St. 1I and St. 2B while St. 1E and St. 1I were statistically different in April 2014 (Table 4). Ranging between 1.9 ± 0.0 (St. 2C) and 2.7 ± 0.3 (St. 1E), MI showed a decreasing pattern from the station in front of the channel towards the innermost sites in June 2013 (Figure 6B). During the second campaign, the maximum was obtained at St. 1E (2.7 ± 0.1) while the other sites were characterized by almost the same MI value (2.2 ± 0.1 at St. 1I; 2.1 ± 0.1 at St. 2B and 2C). Significant differences were observed between stations (Table 3), with St. 1E that significantly differed from all the other sites and St. 1I from St. 2C (Table 4).
In order to ascertain the role of different environmental variables (Table 1) on nematofauna genera composition, the BIOENV routine was performed. As shown in Table 5, BIOENV outputs pointed out that the assemblage was mainly shaped by total PCBs, TN and carbohydrates (ρ = 0.764, P < 0.05). Furthermore, TN was the most important factor since it provided the highest ρ (0.576), when considering one variable at a time.
Results of the BIOENV routine.

TN, total nitrogen; C-PRT, proteins.
DISCUSSION
The study of free-living nematodes (i.e. abundance, genera composition, diversity, MI and ITD) revealed that the dissimilar environmental conditions at the four investigated stations (Figure 2) were mirrored by likewise different assemblages. Nematodes responded to both the confinement of St. 2C in June 2013, which was concomitant with the organic enrichment exerted by mussels, and the severe contamination of St. 1I, especially in April 2014.
Focusing on total abundances, the overall higher values observed in June 2013 could be ascribed to the seasonal dynamics of benthic communities that tend to proliferate as a response to ‘fresh’ organic matter inputs, i.e. decaying phytoplankton material that settles to the bottom at the end of seasonal blooms (Schratzberger et al., Reference Schratzberger, Forster, Goodsir and Jennings2008). C and N stable isotope analysis carried out synoptically with nematodes revealed that in June 2013 the contribution of plankton to the POM (particulate organic matter) was slightly higher than in April 2014 (Bongiorni et al., Reference Bongiorni, Fiorentino, Auriemma, Bernardi Aubry, Camatti, Camin, Nasi, Pansera, Ziller and Grall2016), suggesting an enrichment of the sediments due to fresh organic matter from the water column. The significantly lower abundances at St. 1I (Table 3) may be attributed to the toxic effects exerted by the extremely high amounts of Hg and PCBs nearby the arsenal. This finding is in accordance with the patterns of microalgae (Rubino et al., Reference Rubino, Cibic, Belmonte and Rogelja2016), meio- and macrofauna (Franzo et al., Reference Franzo, Auriemma, Nasi, Vojvoda, Pallavicini, Cibic and Del Negro2016) that showed minima of abundance at this station. Similarly, lower nematode abundances were reported also at the most contaminated stations of a Mediterranean harbour characterized by anthropogenic activities (a commercial port, an oil-terminal and an oil-burning power plant) and affected by major amounts of heavy metals and hydrocarbons in the sediments (Losi et al., Reference Losi, Ferrero, Moreno, Gaozza, Rovere, Firpo, Marques and Albertelli2013), confirming furthermore the susceptibility of the assemblage to this kind of contamination.
The statistically different trophic composition of nematodes (Tables 3 and 4) indicated the presence of a well-structured assemblage at St. 1E, characterized by the presence of all the four trophic groups in comparable percentages during both campaigns (Figure 4). On the other hand, a significantly unbalanced trophic structure, dominated by non-selective deposit feeders (1B), was observed at the most contaminated St. 1I when compared to St. 1E and St. 2C in April 2014 (Table 4), suggesting a response of nematodes to contamination also in terms of trophic composition. On the other hand, in June 2013 the effects of an increasing confinement at St. 2C resulted in the dominance of 1B-group, which represented 76% of the whole assemblage (Table 2, Figure 4). Cibic et al. (Reference Cibic, Bongiorni, Borfecchia, Di Leo, Franzo, Giandomenico, Karuza, Micheli, Rogelja, Spada and Del Negro2016) inferred that during this campaign the stratification of the water column probably slowed down the water exchange between the two inlets magnifying, therefore, the confinement of the innermost part of the basin. Limited circulation and water exchange between inlets could have exacerbated the organic enrichment exerted by mussels resulting in a decreasing eutrophication gradient from the second inlet to the first one, as already reported in previous studies (Alabiso et al., Reference Alabiso, Giacomini, Milillo and Ricci2005). Since the N-enriched excretions of mussels can be taken up by primary producers (Vermuelen et al., Reference Vermuelen, Sturaro, Gobert, Bouquegneau and Lepoint2011), the activity of the bivalves may have favoured the proliferation of nitrophilic macroalgae (Caulerpa prolifera, Caulerpa racemosa and Chaetomorpha spp.) that were, in fact, more abundant in the second inlet (Cibic et al., Reference Cibic, Bongiorni, Borfecchia, Di Leo, Franzo, Giandomenico, Karuza, Micheli, Rogelja, Spada and Del Negro2016). In such an environmental context, Diplolaimella, the genus responsible for the unbalanced trophic structure of nematodes at St. 2C, could have been favoured. Indeed, this genus is known for being able to exploit high inputs of organic matter associated with macroalgal proliferation, as reported by Villano & Warwick (Reference Villano and Warwick1995) during the decay of Ulva rigida blooms in the Venice lagoon.
Among the main genera, the presence of Terschellingia, Daptonema and Microlaimus at all sites indicated that the assemblages within the entire basin were subjected to environmental stress. In fact, these genera are abundant in other port areas of the Mediterranean Sea and were reported to be tolerant to organic enrichment and contaminants such as hydrocarbons and heavy metals (Moreno et al., Reference Moreno, Ferrero, Gallizia, Vezzulli, Albertelli and Fabiano2008; Losi et al., Reference Losi, Ferrero, Moreno, Gaozza, Rovere, Firpo, Marques and Albertelli2013). However, in the present study, the temporally variable mixing of contamination, low hydrodynamism, organic enrichment and confinement acted together resulting in nematode assemblages that greatly varied depending on the prevalence of some environmental factors over the others.
Nematofauna of the Mar Piccolo was overall more diverse than that reported in the Genoa-Voltri harbour (Moreno et al., Reference Moreno, Ferrero, Gallizia, Vezzulli, Albertelli and Fabiano2008) and comparable to that inhabiting the commercial port of Vado Ligure (Losi et al., Reference Losi, Ferrero, Moreno, Gaozza, Rovere, Firpo, Marques and Albertelli2013). The assemblage was more structured and diverse in June 2013 than in April 2014, as indicated by the overall higher values of d, H′ and MI, confirming that the basin experienced a better environmental situation during the first campaign. From St. 1I a gradual amelioration of nematode diversity was observed towards St. 2C, indicating that the decreasing contamination gradient was detectable also in terms of biodiversity, with the exception of St. 2C in June 2013, due to Diplolaimella dominance, and of St. 1E that harboured the most diverse assemblage during both campaigns (Figure 6A).
In a shallow enclosed harbour (7–12 m) subjected to anthropogenic activities similar to those in the Mar Piccolo (container and oil terminal, handling of crude oil, refined products, semi-manufactured and basic petrochemical products), Moreno et al. (Reference Moreno, Ferrero, Gallizia, Vezzulli, Albertelli and Fabiano2008) found that organic matter concentration, total bacteria numbers and Chl a were the environmental factors that mainly shaped the structure of the assemblage. This is partially in accordance with our results since, in the Mar Piccolo, nematodes were mainly influenced by proteins and TN, i.e. variables associated with the mussel farms of the second inlet (Table 5). In addition to the susceptibility of nematodes to such organic enrichment, the BIOENV outputs indicated PCBs were also one of the environmental factors that influenced the composition of the assemblage. This result, mainly referring to the most contaminated St. 1I, confirms the detrimental effects exerted by PCBs on benthic communities and identifies these contaminants as one of the most important issues of concern in the Mar Piccolo of Taranto (Cardellicchio et al., Reference Cardellicchio, Buccolieri, Giandomenico, Lopez, Pizzulli and Spada2007).
The assessment of the EQS of the Mar Piccolo pointed out a discrepancy in the outputs when considering the main contaminants (total Hg and total PCBs) compared with nematode metrics (sensitive/tolerant genera, H′, d, MI and ITD) (Table 7). Applying the thresholds proposed by Marin et al. (Reference Marin, Moreno, Vassallo, Vezzulli and Fabiano2008) for total PCBs and total Hg (Table 6), Bad and Moderate scores were assigned to the first and the second inlet, respectively, in accordance with the more severe contamination levels that are found in the entire first inlet (Table 7). On the contrary, the scores obtained considering nematode metrics suggested how complex the response of this assemblage can be to the environmental pressures and in a way not detectable with the use of chemical indicators only (Table 7).
Thresholds used for the assessment of the EQS.

a Marin et al. (Reference Marin, Moreno, Vassallo, Vezzulli and Fabiano2008).
b Moreno et al. (Reference Moreno, Semprucci, Vezzulli, Balsamo, Fabiano and Albertelli2011).
EQS scores for the Mar Piccolo of Taranto applied on the nematode assemblages.

J13, June 2013; A14, April 2014.
The overall better environmental situation during the first campaign was confirmed by the higher scores at St. 1I in June 2013 than in April 2014. The more structured and diverse community at St. 1E was confirmed by the High/Good scores obtained for the majority of nematode metrics during both campaigns even though chemical indicators assigned a Bad EQS at that station. The disturbance induced by organic enrichment exerted by mussels at St. 2C in June 2013 was detectable by the overall lower scores achieved during the first campaign at that site, when compared to the other stations in June 2013 and to St. 2C in April 2014. Overall, in April 2014 the decreasing contamination gradient from the navy arsenal towards the second inlet was suggested by the attainment of an overall increasing EQS from St. 1I to St. 2C. However, the apparent discrepancy between the Bad scores provided by MI and the Good ones obtained considering ITD and H′ for St. 2C pointed out the possible different sensitivity of specific metrics depending on variable environmental contexts (Moreno et al., Reference Moreno, Semprucci, Vezzulli, Balsamo, Fabiano and Albertelli2011). We think that ambiguous and sometimes contrasting outputs deserve to be critically treated, but not necessarily discarded, by their integration/comparison with the scores provided by the other metrics. Furthermore, any consideration in the EQS assessment should be evaluated bearing in mind the main findings from which the scores themselves come from, especially when giving ambiguous results. Although the analysis of nematode assemblage in terms of sensitive/tolerant genera was reported to provide the most reliable scores (Moreno et al., Reference Moreno, Semprucci, Vezzulli, Balsamo, Fabiano and Albertelli2011; Semprucci et al., Reference Semprucci, Losi and Moreno2015b), in the present study this approach does not seem to reflect different EQS at the four investigated stations. For example, some sensitive genera, such as Pomponema, were surprisingly abundant even at the most contaminated site. This apparent discrepancy highlighted the need to implement the set of sensitive/tolerant genera in order to create more comprehensive lists of EcoInds that should encompass different marine ecosystems (e.g. coastal, deep, lagoonal, estuarine, etc.).
CONCLUSIONS
In the present study, the most updated and thorough description of nematofauna of the Mar Piccolo of Taranto was performed and related to the main pressures acting on the basin. Our main findings pointed out that:
1. Nematodes respond to the environmental confinement in terms of less biodiverse and structured assemblages in the innermost part of the basin. Brackish genera (Diplolaimella), that benefit from the organic enrichment represented by mussel excretions and by nitrophilic algae proliferation, lead to an unbalanced trophic structure dominated by non-selective deposit feeders, especially at the end of spring when higher temperatures contribute to the stratification of the water column limiting, in turn, the dilution of mussel faeces and pseudofaeces.
2. Nematodes respond to the severe contamination near the navy arsenal in terms of a scarcely abundant and diverse assemblage. However, basin-scale dynamics such as seasonal plankton blooms can contribute to an amelioration of the sedimentary environment of the entire basin. This allows the temporary presence of more biodiverse and abundant assemblages even in the most contaminated site.
3. Besides being more comprehensible to stakeholders/authorities, the indication of environmental quality (Bad, Good, etc.) obtained by using free-living nematodes as EcoInds reflects a higher sensitivity of these organisms than the use of contaminants alone. However, since some indicators were shown to provide ambiguous results, we are aware of the need to create more comprehensive lists of EcoInds that should encompass different kinds of environments (from marine to brackish), taking into account the seasonal variability of the assemblages and the type/magnitude of contamination.
ACKNOWLEDGEMENTS
A special thanks goes to Professor Vanreusel, the Head of the Marine Biology Research Group of the UGent and to all the staff for the help and nice hospitality.
FINANCIAL SUPPORT
The activities described in this publication were carried out in the framework of the flagship Project RITMARE (La Ricerca Italiana per il Mare – coordinated by the National Research Council and funded by the Ministry for Education, University and Research within the National Research Programme 2011–2013) and in the context of the Outgoing Staff Mobility Programme held by OGS. The latter allowed a 2-month training in nematode identification at the Marine Biology Research Group of Ghent University (UGent), Belgium. Additionally, this work was supported by the Flemish fund for Scientific Research (K.G., grant number 1242114N).
APPENDIX
Nematode genera contribution to the average dissimilarity between stations and periods (two-way crossed SIMPER, cut-off percentage: 50%).