1. INTRODUCTION
Maritime transportation is the most commonly used mode of transportation in world trade, both in terms of volume and value. With the increasing volume of trade, both the number and capacity of ships navigating the seas are constantly increasing, which brings about an increase in the number and severity of accidents, hence making the seas riskier areas. One of the most important problems of the maritime industry is marine accidents, due to their severe consequences which include loss of life and property and environmental pollution (Eleftheria et al., Reference Eleftheria, Apostolos and Markos2016). Thus, industry stakeholders are laboriously working to prevent marine accidents (Weng et al., Reference Weng, Yang, Chai and Fu2019). Despite the precautions taken, marine accidents cannot be prevented completely and accidents are still occurring. When the literature in related areas is examined, it is apparent that most marine accidents occur in restricted waters such as berths, port approaches, coastal waters and inland waters (Bogalecka and Popek, Reference Bogalecka and Popek2008). Heavy traffic and manoeuvring restrictions in these areas increase the risk of marine accidents.
The growing dimensions of ships in recent years cause difficulties of berthing/sailing operations, especially in ports and in restricted waters. The ability of large ships to conduct these operations on their own is very limited. This situation also increases the risk of marine accidents and pollution. Therefore, tugboats, small but powerful craft, were started to be used for assist and enable especially large ships to be manoeuvred as required in these areas by pushing or towing (Couce et al., Reference Couce, Couce and Formoso2015; Mansson et al., Reference Mansson, Lutzhoft and Brooks2017; Balin et al., Reference Balin, Şener and Demirel2019). These operations, which enable ships to perform safer manoeuvres, are processes that have high accident risk due to the very close interaction of two craft (Xu and Bai, Reference Xu and Bai2017). Although there are many studies on accidents involving various types of ships, there are limited studies on service ships (Sevgili and Zorba, Reference Sevgili and Zorba2018). Similarly, it is observed that there are limited studies on tugboats, which is one of the most important types of service ship. The related literature on tugboats is generally on the problems of scheduling and allocation (Liu, Reference Liu2009; Wang et al., Reference Wang, Kaku, Chen and Zhu2012; Nas et al., Reference Nas, Özkan and Uçan2016). There are also some studies on the selection and braking/towing force of tugboats (Yang et al., Reference Yang, Hong, Inoue and Sadakane2010; Çakíroğlu et al., Reference Çakíroğlu, Şener and Balín2018; Balin et al., Reference Balin, Şener and Demirel2019). Fuel consumption, environmental impacts and autonomous tugboats are other areas of tugboat studies (Bui and Kim, Reference Bui and Kim2011; Gysel et al., Reference Gysel, Russell, Welch and Cocker2016; Yuan et al., Reference Yuan, Tjahjowidodo, Lee, Chan and Adnanes2016).
A review of the related literature shows that there is no study on accidents involving tugboats. Accordingly, this study aims to fill this gap by analysing accidents involving tugboats using various methods of data mining. Analysis of accidents involving tugboats might enable the stakeholders to take measures to reduce the risks of tugboat-related accidents in ports and restricted waters, which are the most dangerous water areas (Bogalecka and Popek, Reference Bogalecka and Popek2008). In addition, the importance of the variables affecting tugboat accidents according to accident severity would be determined by the analyses. The performance of predictions from the algorithms used were also compared. The methods used in the study were applied for the first time to tugboat accidents, which further increases the importance of this study.
The rest of the paper is structured as follows. Related works are discussed in Section 2. Details of the dataset and description of the methods are presented in Section 3. Section 4 provides the findings of the methods implemented and comparison with other studies. Section 5 presents the conclusion including final evaluation of the results and suggestions.
2. LITERATURE REVIEW
When the literature is examined, there are many studies related to marine accidents and other maritime issues. Hashemi et al. (Reference Hashemi, Le Blanc, Rucks and Shearry1995) suggested a transportation safety model based on a total of 279 accident reports on the Mississippi River using neural network and logistic regression. Lu and Tsai (Reference Lu and Tsai2008) examined the effects of the safety climate on container ship accidents using the logistic regression method, based on data obtained from 291 interviews. Another study on shipping safety was conducted on the role of human factors in marine accidents, and a total of 1,248 marine accident records from the Fujian water areas were used to investigate this likelihood (Weng et al., Reference Weng, Yang, Chai and Fu2019). Human error in marine accidents is widely investigated. Tzannatos (Reference Tzannatos2010) conducted a study on the significance of the human element in accidents and, in that research, accidents involving Greek-flagged ships that occurred worldwide between 1993 and 2006 were examined. Weng and Yang (Reference Weng and Yang2015) investigated injury severity and mortality in marine accidents using worldwide marine accident records from 2001 to 2011. Kim and Jeong (Reference Kim and Jeong2016) created a visual ship collision risk using Automatic Identification System (AIS) data on coastal water areas of Busan Port. In another study using AIS data, statistical relations between marine accidents and AIS data were determined (Bye and Aalberg, Reference Bye and Aalberg2018). Rezaee et al. (Reference Rezaee, Pelot and Finnis2016) analysed the relationship between cyclones and the severity of accidents involving fishing vessels. Data from a total of 50 of the most intensive cyclones that occurred in the Atlantic Canada region and a total of 5,393 accidents involving fishing vessels were used for logistic regression. Other studies using the logistic regression method in the maritime field have especially studied safety and occupational accidents (Moenv et al., Reference Moenv, Riise and Helseth1994; Oltedal and McArthur, Reference Oltedal and McArthur2011; Zytoon, Reference Zytoon2012; Li et al., Reference Li, Yin, Bang, Yang and Wang2014; Forsell et al., Reference Forsell, Eriksson, Järvholm, Lundh, Andersson and Nilsson2017; Karakasnaki et al., Reference Karakasnaki, Vlachopoulos, Pantouvakis and Bouranta2018).
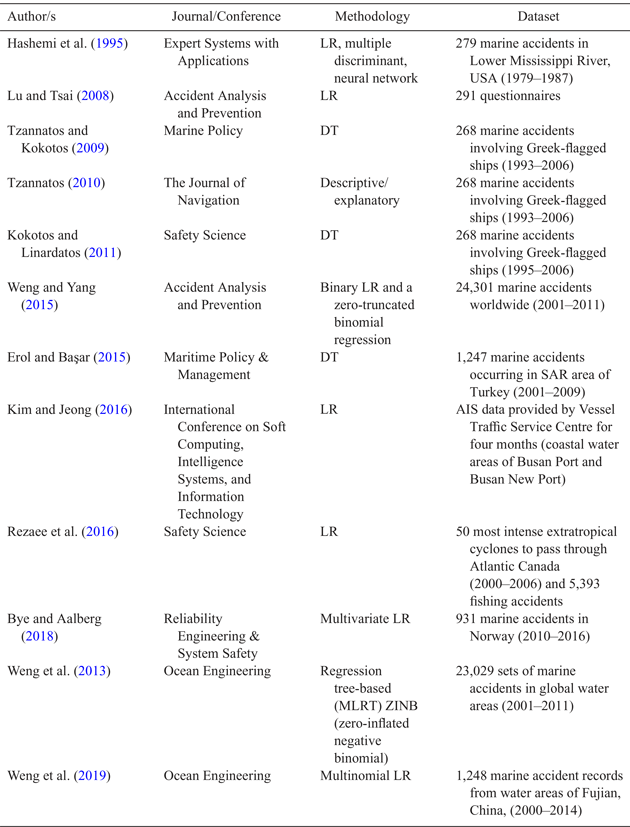
In the literature, there are some studies in which marine accidents have been examined using decision tree methods. Tzannatos and Kokotos (Reference Tzannatos and Kokotos2009) analysed marine accidents in the pre- and post-International Safety Management (ISM) period. A total of 268 accidents, all involving Greek-flagged ships, were analysed using the chi-squared automatic interaction detector (CHAID) algorithm. Kokotos and Linardatos (Reference Kokotos and Linardatos2011) studied the effectiveness of the ISM Code using the distribution of marine accidents based on human factors. Erol and Başar (Reference Erol and Başar2015) investigated marine accidents that occurred in the search and rescue (SAR) area of Turkey through a total of 1,247 accident reports covering the period from 2001 to 2009. Weng et al. (Reference Weng, Yang, Chai and Fu2019) suggested a regression tree-based zero-inflated negative binomial approach to evaluate marine accidents. Apart from marine accidents, studies using the decision tree method are generally on safety issues (Tsou, Reference Tsou2019), cargo operations (Thill and Venkitasubramanian, Reference Thill and Venkitasubramanian2015; Wu et al., Reference Wu, Chen and Tsau2017; Luna et al., Reference Luna, Mar-Ortiz, Gracia and Morales-Ramírez2018), smart vessels (Guo et al., Reference Guo, Xia and Wang2015; Xue, Chen, et al., Reference Xue, Chen, Papadimitriou, Wu and Van Gelder2019; Xue, Wu, et al., Reference Xue, Wu, Chen, Van Gelder and Yan2019), customer retention (Lin et al., Reference Lin, Chen and Chiu2017), fuel consumption (Coraddu et al., Reference Coraddu, Oneto, Baldi and Anguita2017, Reference Coraddu, Oneto, Baldi, Anguita and Corona2018), scheduling (Bodunov et al., Reference Bodunov, Schmidt, Martin, Brito and Fetzer2018) and human resources (Saeed et al., Reference Saeed, Bury, Bonsall and Riahi2017). Table 1 shows the studies that analysed marine accidents using logistical regression and decision tree methods.
Studies using LR and DT in the analysis of marine accidents.

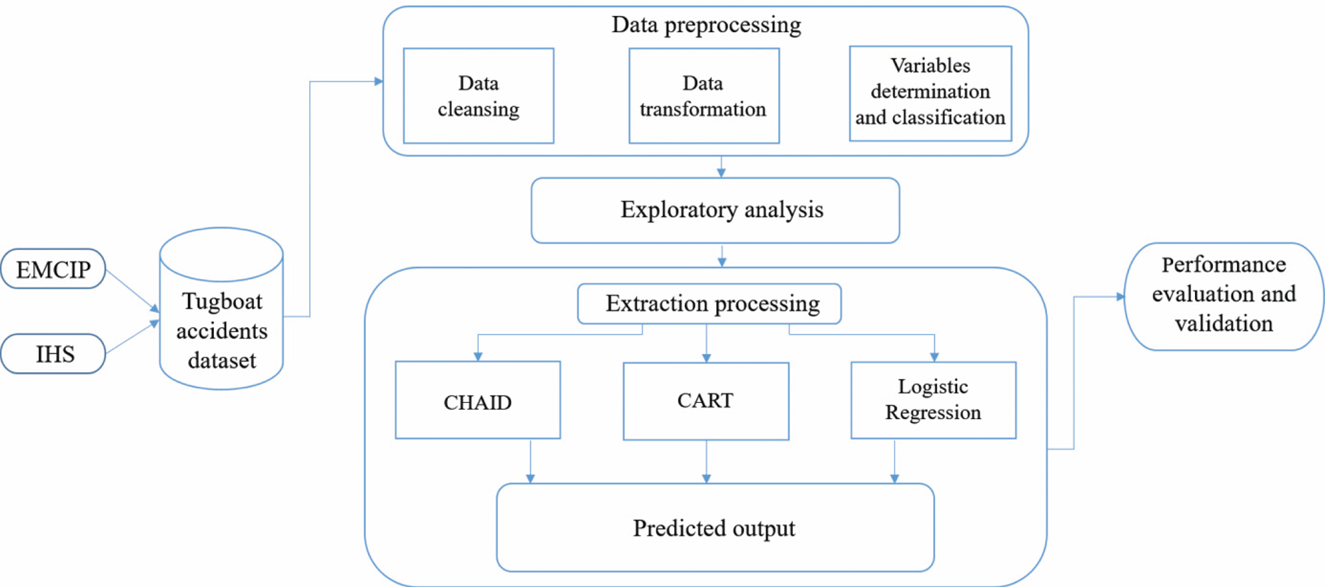
To sum up, although there are many papers exploring the factors contributing to marine accidents using logistical regression and decision tree methods, there is no paper on tugboat accidents. As mentioned above, the aim of this study is to fill in this gap in related fields by analysing tugboat accidents. For this purpose, data on tugboat accidents were examined using a set of machine learning algorithms and statistical model. The complete system architecture implemented in this study is illustrated in Figure 1.
System architecture of the study.

3. MATERIAL AND METHOD
3.1. Dataset details
Tugboats, typically, provide different services in different environments, such as entering/leaving or shifting within a harbour, ocean towing or assistance to an offshore unit. In order to reduce the heterogeneity of the sample and focus on a specific activity, accidents that occurred during the services provided by harbour tugboats are included in the dataset (‘tugboat accidents data’).
Tugboat accidents data were collected from the IHS Sea-web database and the European Marine Casualty Information Platform (EMCIP). The IHS database enables users to view vessel accident histories and search for accidents by a number of combined criteria such as details of ship, accident, voyage, event etc. The database includes an extensive search facility and covers over 113,000 records. The EMCIP platform, on the other hand, is a database and data distribution system operated by the European Maritime Safety Agency. The platform provides a tool to collect and store data on marine casualties involving all types of ships. These two databases have been the data source for many studies (Maragkogianni and Papaefthimiou, Reference Maragkogianni and Papaefthimiou2015; Dachev and Panov, Reference Dachev and Panov2017; Rodríguez et al., Reference Rodríguez, Martin-Alcalde, Murcia-González and Saurí2017)
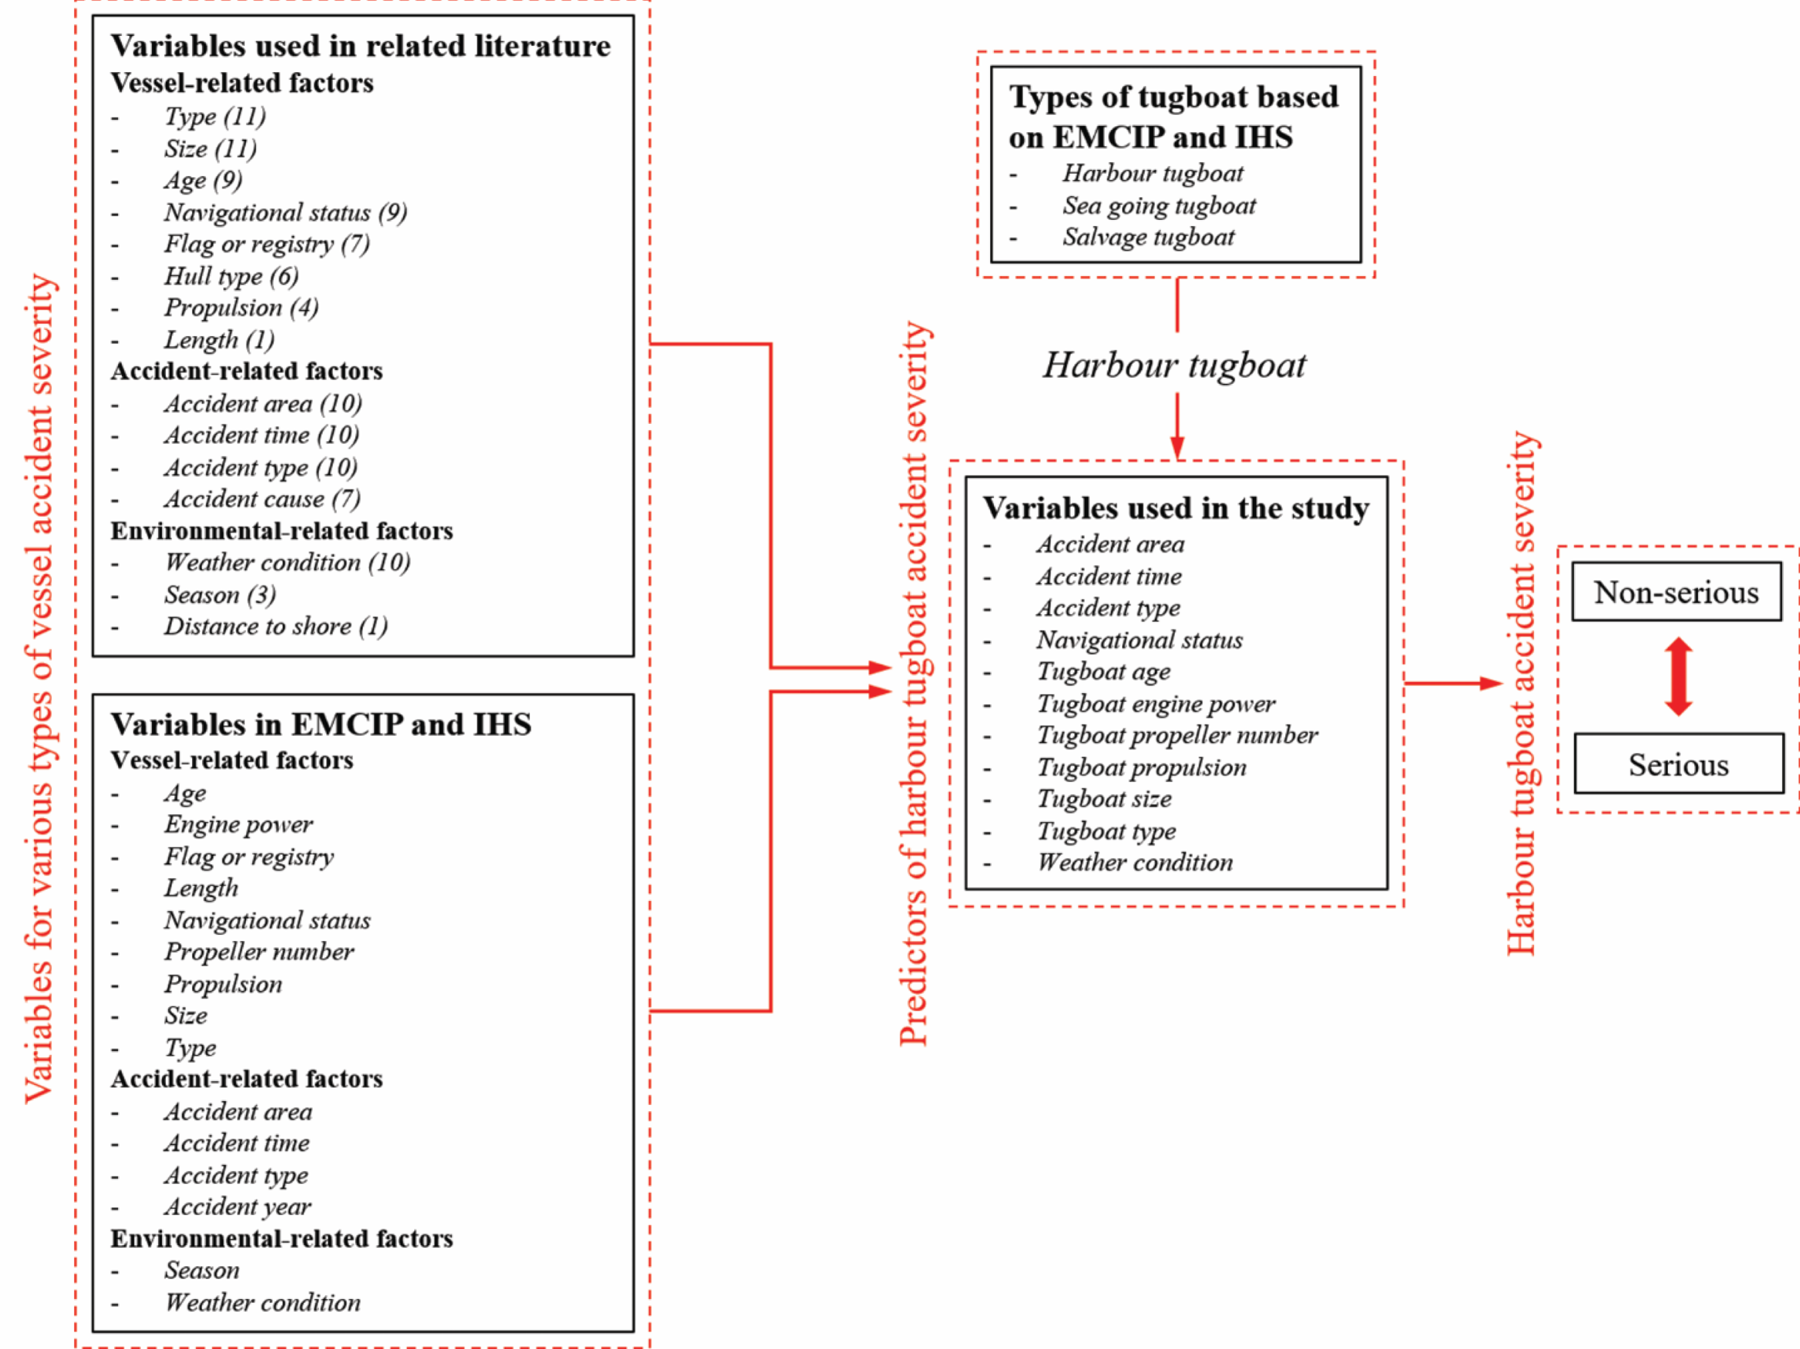
Figure 2, which illustrates the conceptual framework of the study, shows the variables used in accident severity studies related to various ship types, as well as the frequency of use of these variables in the studies (in brackets). As shown in the figure, ship type and ship size have been utilised in all studies. Talley (Reference Talley1995, Reference Talley1996, Reference Talley1999a, Reference Talley1999b), Jin et al. (Reference Jin, Kite-Powell and Talley2001), Talley et al. (Reference Talley, Jin and Kite-Powell2006, Reference Talley, Jin and Kite-Powell2008), Jin (Reference Jin2014), Wang and Yang (Reference Wang and Yang2018), Weng et al. (Reference Weng, Li, Chai and Yang2018), Weng and Li (Reference Weng and Li2019). Accident area, accident time, accident type and weather condition are other highly used variables. An accident cause variable is generally included in accident severity studies under three basic categories: human, vessel and environmental causes. Hull type and propulsion variables, however, are mostly used in studies examining a specific type of vessel. For example, Jin (Reference Jin2014) and Jin et al. (Reference Jin, Kite-Powell and Talley2001) focused solely on fishing vessels in their research on accident severity.
Conceptual framework for the analysis of harbour tugboat accident severity. References: Talley (Reference Talley1995, Reference Talley1996, Reference Talley1999a, Reference Talley1999b), Jin et al. (Reference Jin, Kite-Powell and Talley2001), Talley et al. (Reference Talley, Jin and Kite-Powell2006, Reference Talley, Jin and Kite-Powell2008), Jin (Reference Jin2014), Wang and Yang (Reference Wang and Yang2018), Weng et al. (Reference Weng, Li, Chai and Yang2018), Weng and Li (Reference Weng and Li2019).

Variables used in the present study were determined in the light of the related literature and utilised the EMCIP and IHS databases, as shown in Figure 2. Unlike other vessel accident severity studies, engine power, propeller number and propulsion type were included in this study because of the unique characteristics of tugboats and their use in a wide variety of tasks. On the other hand, tugboat length was excluded from the study due to the high correlation between tugboat length and tugboat size. In addition, tugboat flag was not included in the study because tugboats operate under a wide variety of flags. The accident cause variable could not be included in the study due to its absence from the utilised databases.
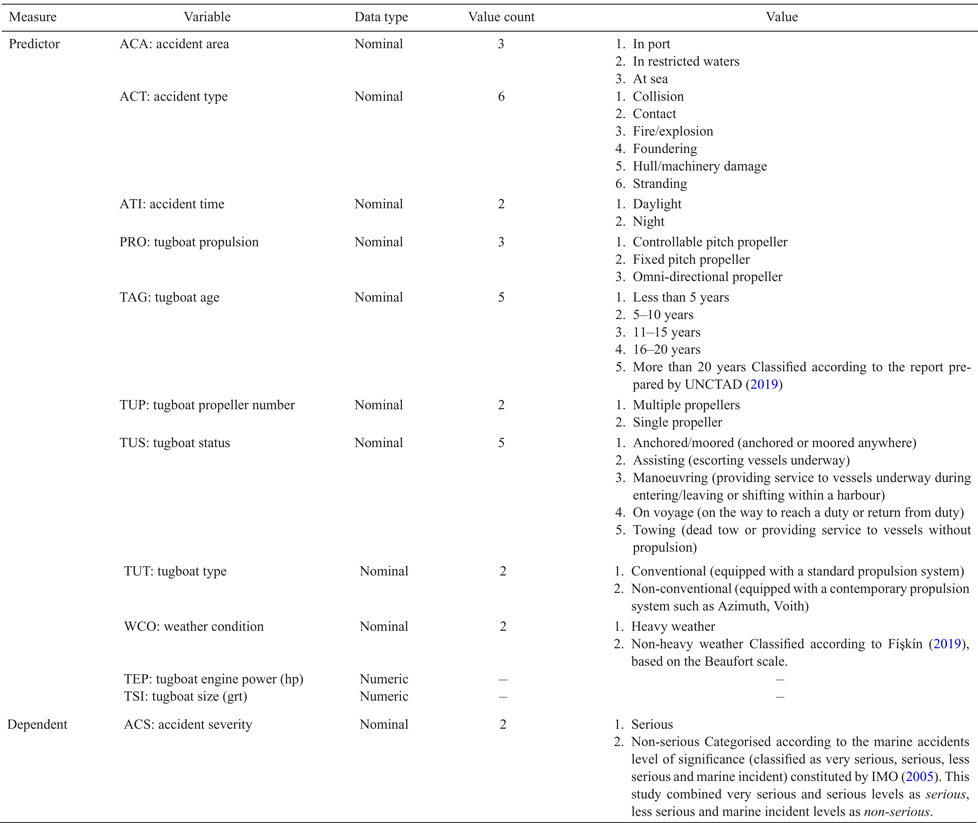
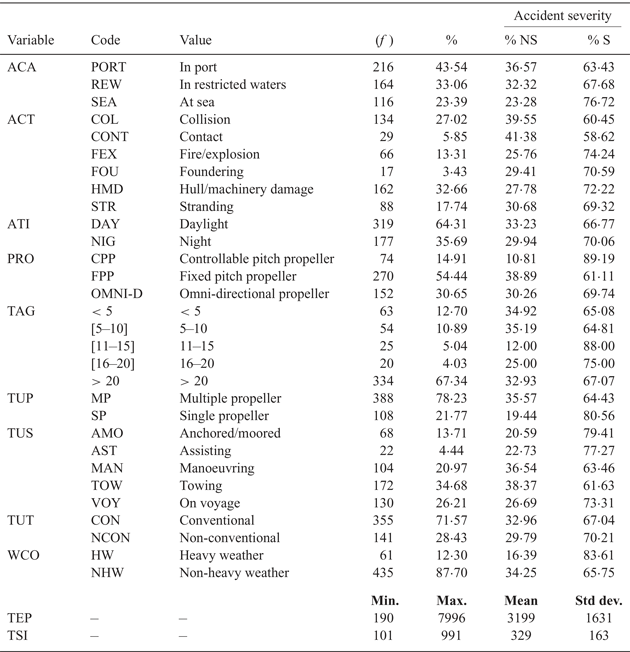
The study adopted an analytical method based on the dataset consisting of a total of 496 accident records for the period 2008–2019. All collected data were analysed using the SPSS modeller 18. In the research process, firstly, decision tree algorithms such as CHAID and classification and regression trees (CART) were utilised to find out the accident-related conditions in the factors of tugboat accidents. Then, binary logistical regression was applied to the dataset to analyse the variables contributing to accident severity. A total of 11 predictor variables were determined with the dependent variable of accident severity to reveal the important variables affecting the severity of tugboat accidents. The variables taken into account in the study are presented in Table 2.
Details of variables used in the study.

Data mining, which has many different techniques and algorithms, is a method to reveal unknown relations and patterns in a database, and this information can be used to generate models that provide predictions and decision-making solutions for situations in the future (Fernández et al., Reference Fernández, Mediano, García, Rodríguez and Marín2016). Decision tree (DT), artificial neural network and logistic regression (LR) are some of the most used data mining methods to solve prediction and classification problems. Within these methods, artificial neural networks especially have some weaknesses, such as over-training and black-box phenomenon (Chen, Reference Chen2011). For this reason, LR and DT algorithms were utilised to analyse accidents involving tugboats in this study. DT classification and LR play an important role in big data analyses with prediction and classification rules as they are simple and comprehensible methods (Chen, Reference Chen2011). In addition, the main advantage of these methods is easy visualisation. Decision rules similar to ratiocination are created from the results of analysis, and there is a simple and intuitive statement of how the decision is made (Fernández et al., Reference Fernández, Mediano, García, Rodríguez and Marín2016).
The two methods have some advantages against each other. DT algorithms have the power to analyse complex data and uncomplicatedly find out subsistent uncertainties of modelling (Steinfort et al., Reference Steinfort, Liew, Conron, Hutchinson and Irving2010). Another advantage of DT is its ability to define associations in data by revealing important interactions between variables. In this direction, the DT model provides a way to divide accidents efficiently into meaningful subgroups with decision-making benefits, as subgroups of accident severity can be identified. On the contrary, LR estimates the results in the entire sample, emphasising the main effects, not interactions between variables, so, while creating accident severity analyses, the whole dataset is used instead of being specific to any variable. Thus, the effect of explanatory variables on target variables can be examined separately and the marginal effect of explanatory variables can be determined. The advantage of LR is that variables with positive or negative effects on accident severity can be easily detected. However, the performance of the methods varies as they depend on the dataset (Weng et al., Reference Weng, Meng and Wang2013).
3.2. DT
Classification is the process of creating a model that defines data classes or concepts. The model is derived as a result of the analysis of a set of training data and is utilised to predict the class or label the unknown objects. Various forms can be used to represent the derived model, such as classification rules (i.e., if-then rules), DT or neural network.
A DT is a flowchart-like tree form that has root nodes, branches and leaf nodes. Each node indicates a test on an attribute value, each branch denotes the results of the test, and leaf nodes indicate class distribution. DT may be converted readily to classification rules (Han et al., Reference Han, Pei and Kamber2011). DT comprises a number of computational intelligence and statistical analysis-based methods for obtaining processable knowledge. As a type of data mining method, DT can be implemented to form models, be used in data processing and predictions, and describe patterns in data (Lin and Fan, Reference Lin and Fan2019). The main aim of these methods is to make available the information implicit in large amounts of data (De Oña et al., Reference De Oña, López and Abellán2013). There are many DT algorithms, such as C5.0, CART, CHAID, QUEST etc., to create classification tasks and establish decision rules. CART and CHAID, two frequently used DT algorithms (Lin and Fan, Reference Lin and Fan2019), were utilised as the research methodology in this study from among the many DT algorithms.
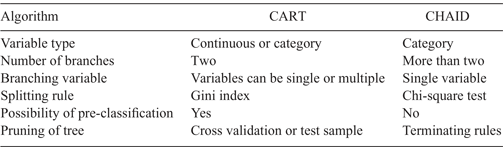
DT algorithms differ from one another principally in terms of the attribute criteria of the root and child nodes, and the number of split child nodes. Splitting criteria of DT contain Gini index information gain, chi-squared test etc. The comparison made by Lin and Fan (Reference Lin and Fan2019) between the working principles of DT algorithms is shown in Table 3.
Comparison of CHAID and CART.

3.2.1. CART
CART, developed by Breiman et al. (Reference Breiman, Freidman, Olshen and Stone1984), is one of the most popular and frequently utilised DT algorithms (De Oña et al., Reference De Oña, López and Abellán2013; Sapri et al., Reference Sapri, Nordin, Hasan, Yaacob and Nasir2017). The algorithm is a kind of recursive segmentation method, so it could be implemented for both classification and regression by creating a tree (Breiman et al., Reference Breiman, Freidman, Olshen and Stone1984; Cheng et al., Reference Cheng, Leu, Cheng, Wu and Lin2012). CART uses a binary segmentation and its splitting state is managed depending on the Gini index (Aksoy et al., Reference Aksoy, Badur and Mardikyan2010). In the splitting process, the data is divided into two subsets. These subsets are also divided to form the following test attribute. Thereafter, each subset is split again to form the following test attribute and the process continues in this way until the data becomes indivisible (Lin and Fan, Reference Lin and Fan2019). The methodology of CART comprises the following four basic parts (Lewis and Street, Reference Lewis and Street2000; Syaraswati et al., Reference Syaraswati, Slamet and Winarno2017).
i. Tree building: A tree is created by implementing a recursive splitting of nodes. Let k, k = 1, 2, … and m is class where m is the number of class. Equation (1) identifies the Gini index.
(1)where $$i(t)=1-\sum_{i=1}^m [P(k|t)]^2,$$$[P( k\vert t) ] $ is the relative frequency of class j in node t. The biggest goodness of split (ϕ (s, t)) determines the splitter, as follows,
(2)where p L is the left node ratio, it L is the left node heterogeneous function, p R is the right node ratio, and it R is the right node heterogeneous function.$$\phi (s,t)=i(t)-p_L it_L -p_R it_R$$
ii. Termination of the tree building: When each child node has only one observation, the process is stopped. There is the same distribution of antecedent variables in all observations within each child node. The maximum number of trees is created at this part.
iii. Tree pruning: Each tree is a candidate for the appropriately-fit final tree so as to produce a sequence of simpler trees.
iv. Optimal tree selection: At this part, the optimal tree is selected from among the alternatives.


The Gini index principally aims to separate the biggest number of categories in the dataset from other categories in different nodes. Gini with small value indicates that the category separation becomes more irregular. This refers that whether the category purity in the subset generated using the splitting point is higher, the possibility to distinguish within the categories is increased (Lin and Fan, Reference Lin and Fan2019).
3.2.2. CHAID
CHAID, introduced by Kass (Reference Kass1980), is a kind of machine learning algorithm that creates trees having multiple splits. The algorithm has features basically similar to other DT algorithms, however, it works by using chi-square test of independence (Mistikoglu et al., Reference Mistikoglu, Gerek, Erdis, Mumtaz Usmen, Cakan and Kazan2015). The dependent variable based on antecedent variables which is a single attribute of the population is analysed in CHAID. CHAID is a repetitive method investigating the antecedents separately. The antecedents are ordered according to their statistical significance in the classification process. If the method, for instance, determines that ship size is the best factor for indicating whether an accident has human or non-human source, the dataset is split according to the significant ship size group. When all variables are viewed, the process is terminated (Tzannatos and Kokotos, Reference Tzannatos and Kokotos2009). The CHAID algorithm consists of five main steps, as follows (Wen, Reference Wen2019):
i. Two categories that have minimum distribution difference are determined with regard to dependent variable Y for each antecedent variable X. The method formed for P value is defined by the type of dependent variable Y. If the dependent variable Y is continuous, the F test is used; if the variable is nominal, likelihood ratio test and Pearson chi-square test are used. If it is discrete or ordinal, only the likelihood ratio test is used.
ii. Two categories of X which have the maximum P values are determined and they are compared considering the pre-set merge level α merge. If it is less than α merge, generate the category of new series of X merging the two categories and return to step i. Otherwise continue with the next step.
iii. The P value which is calibrated by contingency table considering antecedent variable X and dependent variable Y is calculated using the Bonferroni method represented by Equation (3).
(3)where r is the merged category amount of the antecedent variable, and c is the initial category amount of the antecedent variable.$$B=\sum_{i=0}^{r-1}(-1)^i\frac{(r-i)^c}{r!(r-i)!}$$iv. The antecedent variable X which has the minimum calibrated P value is selected, and it is compared considering the pre-set split level α split. If it is less than α split, split the node by the category of X series. Otherwise do not split the node, which is the final node.
v. The DT continues to grow until meeting the termination rules.

3.3. LR
LR is used for analysing the dataset of one or more independent variables. The method provides prediction of a discrete output from a series of variables which can be continuous, discrete, binary, or a mixture of any of them (Weng and Yang, Reference Weng and Yang2015). The main aim of LR is to identify the relationship between the dependent variable and the predictor variables. Two types of technique can be applied as a LR method when the dependent variable is nominal: binary LR and multinomial LR. In binary LR, the binary dependent variable comprises two categories which are generally represented as 0 and 1. On the other hand, more than two categories of dependent variables are handled in multinomial LR (Sapri et al., Reference Sapri, Nordin, Hasan, Yaacob and Nasir2017; Wu et al., Reference Wu, Yip, Yan and Mao2020). In this study, two levels of accident severity (the dependent variable) were taken into consideration: serious or non-serious. In this respect, a binary LR method can be applied for predicting the probability of each outcome. The dependent variable y is denoted by only two values: y = 1 for the serious level and y = 0 for the non-serious level. Equation (4) represents the LR model formed in this study.
 $$P_{({\rm serious})}=\frac{e^{\alpha_0+\alpha_1x_{PRO}+\alpha_2x_{TUP}+\alpha_3x_{ACA}+\alpha_4x_{WCO}}}{1+e^{\alpha_0+\alpha_1x_{PRO}+\alpha_2x_{TUP}+\alpha_3x_{ACA}+\alpha_4x_{WCO}}}$$
where  $P_{\rm serious}$ is the probability of the serious accident, x PRO represents the tugboat propulsion, x TUP represents the number of propellers of the tugboat, x ACA represents the accident area, x WCO represents the weather condition, and αi, i = 0, 1, …, 4 are the coefficients. These variables are those that are significant with serious accidents as a result of LR analysis.
3.4. Performance evaluation indicators
In this study, three indicators (accuracy, sensitivity, specificity) were used to demonstrate the performance of the developed models. The indicators are represented by Equations (5)–(7):
 $$\begin{align} \hbox{Accuracy}&=\frac{tNS+tS}{tNS+tS+fNS+fS} \end{align}$$
 $$\begin{align} \hbox{Sensitivity}&=\frac{tNS}{tNS+fS}100\% \end{align}$$
 $$\begin{align} \hbox{Specificity}&=\frac{tS}{tS+fNS}100\% \end{align}$$
where tNS is true non-serious cases, tS is true serious cases, fNS is false non-serious cases and fS is false serious cases. Accuracy, denoted by Equation (5), is the proportion of samples correctly classified by the classifier. It provides information about the overall performance of the classifier. Sensitivity demonstrates the proportion of non-serious cases correctly predicted among all the observed non-serious cases. Specificity refers to the proportion of correctly predicted serious cases among all the observed serious cases, denoted by Equations (6) and (7).
In order to show the optimal model for the analysis of tugboat accident severity, the aforementioned performance evaluation indicators were applied. The best model according to the indicators was used for inference.
3.5. Extraction and validation of rules
The outputs of DT are expressed in a series of rules. The rules have the form of the type ‘X → Y’. X, a set of several antecedent variables, is the antecedent and Y, the dependent variable, is the consequent. Support of X indicates the ratio of the data set where X appears. For each rule, the following three parameters can be used to reveal the significant rules that provide knowledge (De Oña et al., Reference De Oña, López and Abellán2013):
Support (S): represents the support of the entire rule and shows how often each combination of antecedent and consequent occurs in a database.
Population (Po): denotes the support of the antecedent of the rule and depends on S and P (Po = S/P).
Probability (P): is the possibility of cases where the rule is accurate (i.e., P = S/Po expressed as percentage) and is identified by the percentage of cases that consequently occur, supposing the antecedent has taken place. It principally evaluates the strength of a rule.
4. RESULTS AND DISCUSSION
4.1. Implementation of DT to dataset
The initial step is to create a DT utilising the two algorithms (CHAID and CART) with the aim of classification of tugboat accident severity. Data consisting of 159 non-serious and 337 serious cases were used for construction of the DT and approximately two thirds (64% of total) of the data were devoted to the training process while the remaining data were used for the test. A total of nine nominal and two numeric predictor variables, as given in Tables 2 and 4, were employed with the binominal target variable of tugboat accident injury severity in an effort to discover the essential rules. SPSS modeller 18·0 software was employed for the computations.
Distribution of accident severity for nominal predictor variables.

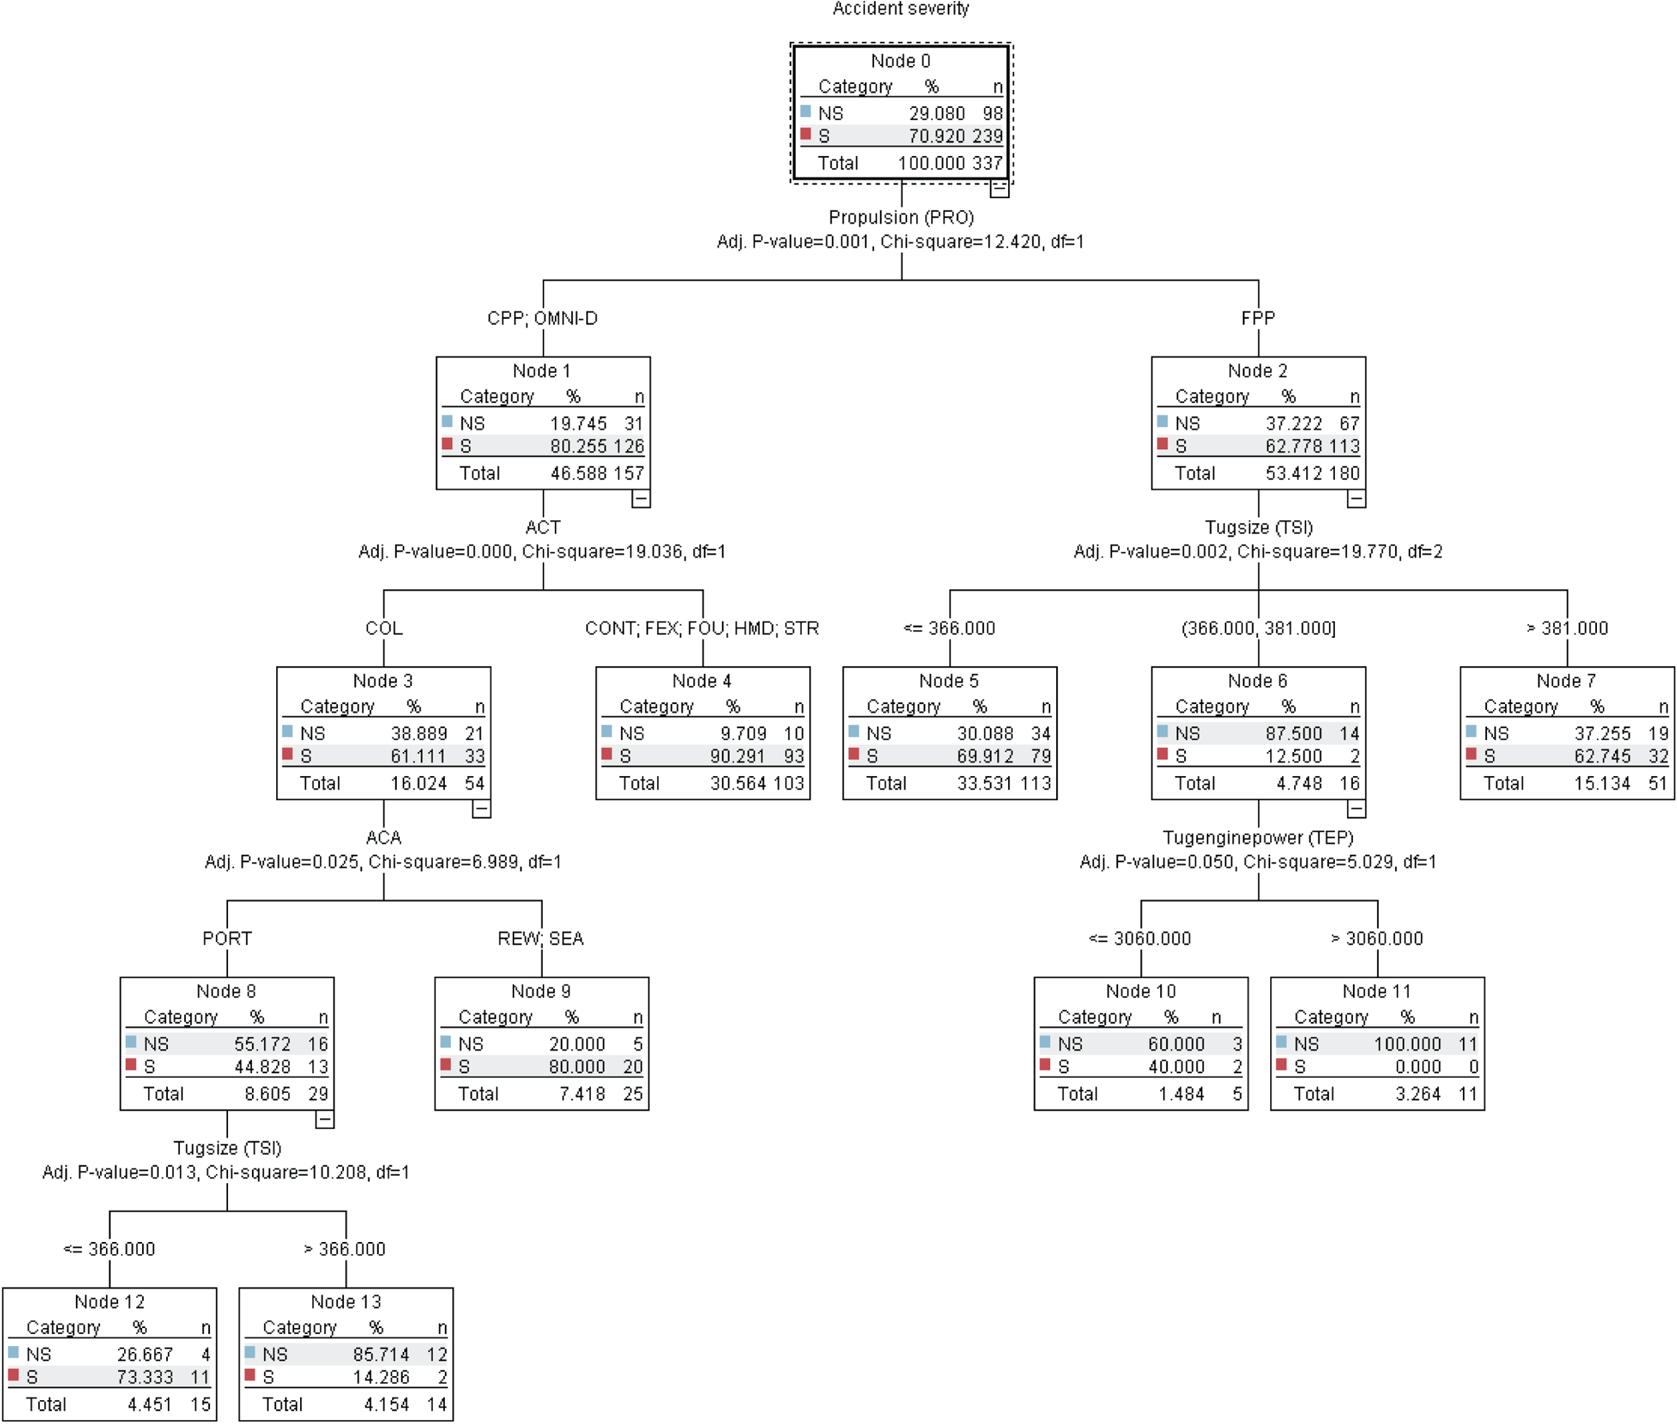
Figure 3 shows the DT structure using the CHAID algorithm. The CHAID method generated a tree with 13 nodes and eight terminal nodes in which serious and non-serious accident counts and percentages were provided. It can be noticed that the target variable in the root node is accident severity which generates the tree based on PRO that splits into two branch nodes: Node 1 contains tugboats equipped with controllable pitch propeller (CPP) or omni-directional propeller (OMNI-D) and Node 2 contains tugboats equipped with fixed pitch propeller (FPP).
DT built with CHAID.

CHAID splits Node 1 based on ACT and sends the COL to the left, generating Node 3; and directs the CONT, FEX, FOU, HMD and STR to the right, generating terminal Node 4. As indicated by terminal Node 4, if a tugboat equipped with CPP or OMNI-D has engaged in CONT, FEX, FOU, HMD or STR, this accident is most likely to be serious (90·2%). CHAID continues to split Node 3 based on ACA and sends the PORT to the left, generating Node 8; and sends the SEA and REW to the right, generating terminal Node 9. At terminal Node 9, the tree predicts that 80% of collision accidents involving tugboats equipped with CPP or OMNI-D, whether in open sea or restricted waters, are serious. On the other hand, if this type of accident occurs in a port area, it is revealed that the serious accident rate has decreased to 45% (Node 8). CHAID further splits Node 8 based on the variable TSI into terminal Nodes 12 and 13. At terminal Node 12, if the tugboat involved in a collision accident in a port area is 366 grt or less, the tree finds that the accident is more likely to be serious (73%). In contrast, collision accidents occurring in port areas have a very high probability of being non-serious (85·7%) for tugboats over 366 grt.
The rest of the rules are related to tugboats equipped with FPP (Node 2). CHAID splits Node 2 based on the variable of TSI into two terminal nodes (Node 5 and Node 7) and one internal node (Node 6). Comparison of terminal Nodes 5 and 7 shows that the serious accident rate for tugboats equipped with FPP drops from 70% to 63% when tugboat size increases from 366 grt or less to over 381 grt. Similarly, various studies examining the indicators of the severity of cruise ship accidents (Talley et al., Reference Talley, Jin and Kite-Powell2008), passenger ship accidents (Talley et al., Reference Talley, Jin and Kite-Powell2006) and fishing vessel accidents (Jin, Reference Jin2014) have found that ship damage severity is negatively associated with ship size. CHAID further splits Node 6 based on TEP and generates terminal Nodes 10 and 11. Although the number of tugboat accident samples is insufficient to reach a definitive finding from these nodes, it should be noted that increased horsepower provides a dramatic reduction in accident severity for the tugboats between 366 grt and 381 grt.
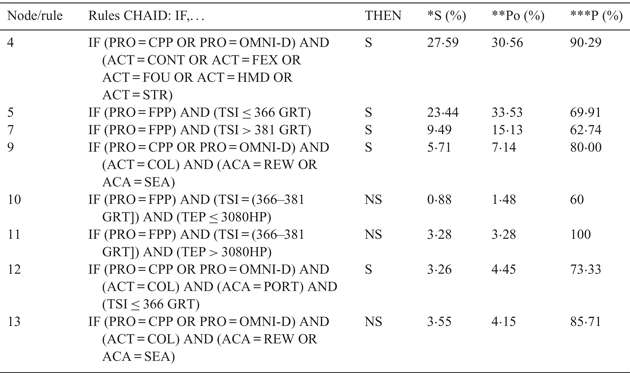
Table 5 shows a depiction of eight rules discovered in the DT generated by the CHAID algorithm that assure the minimum threshold values of the parameters support (S), population (Po) and probability (P) in the training and test datasets. Support ranges from 0·88% (rule 10) to 27·59% (rule 4). All rules contain at least 1·48% of the population and probability values are above 60%; 100% is the highest value (rule 11).
Description of the rules created by the CHAID algorithm.

Note: *S: Support; **Po: Population; ***P: Probability.
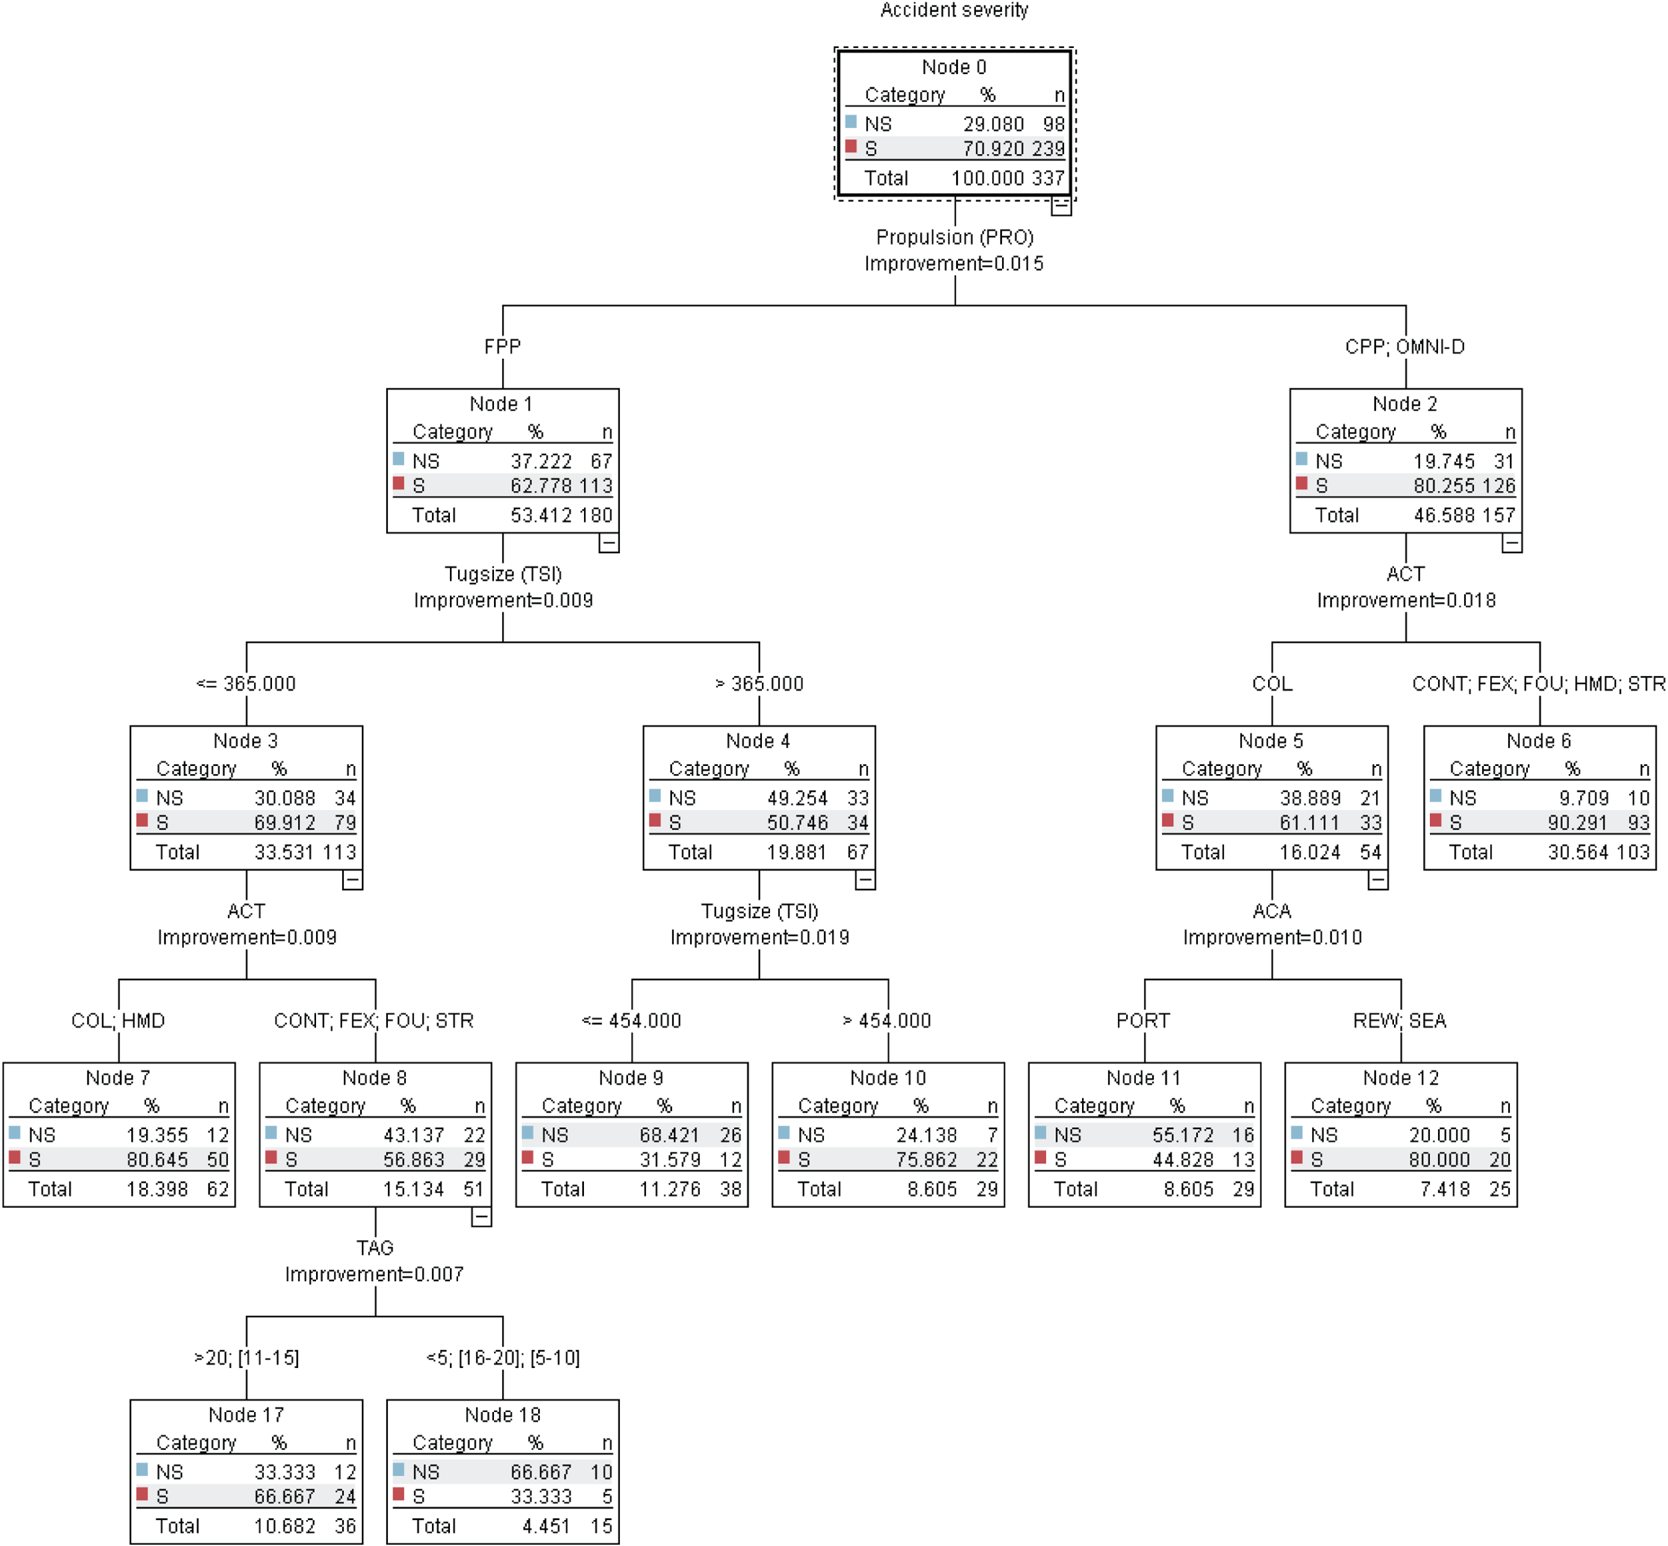
Figure 4 presents the DT created with the CART algorithm attributed to the training set. It shows 14 nodes, with eight terminal nodes. As in CHAID, the root variable of accident severity gives the first split attributed to the PRO. CART locates the tugboats equipped with FPP to the left, generating Node 1 and those equipped with CPP or OMNI-D to the right, generating Node 2. CART further splits Node 1 attributed to the TSI and directs the tugboats of 365 grt or less to the left, generating Node 3; and locates the tugboats over 381 grt to the right, generating Node 4. Then, Node 4 is again split according to tugboat size by the CART, giving two terminal nodes as Node 9 and Node 10. From rules 9 and 10, it can be seen that tugboats over 454 grt are more likely to have a serious accident than tugboats between 365 and 454 grt.
DT built with CART.

CART algorithm splits Node 3 based on ACT and sends COL and HMD to the left, generating terminal Node 7; and sending CONT, FEX, FOU and STR to the right, generating Node 8. At terminal Node 7, if the tugboat equipped with FPP and 365 grt or less has a collision or hull/machinery damage, this accident is most likely to be serious (80·6%). On the other hand, as seen in Node 5, a collision accident involving a tugboat equipped with CPP or OMNI-D is 61% likely to be serious. This result can be explained by the fact that, especially during push/pull operations, a tugboat equipped with CPP or OMNI-D has manoeuvrability advantages compared with a conventional tugboat equipped with FPP. Also, smaller tugboats equipped with FPP are at higher risk of girting/girding which increases the probability of a serious collision accident, for example, during pull/push activities.
Finally, CART splits Node 8 based on TAG and generates two terminal nodes as Node 17 and Node 18. Comparison of terminal Nodes 17 and 18 shows that tugboats aged over 20 and [11–15] years have more probability of being involved in a serious contact, fire/explosion, foundering or stranding accident than tugboats with the age of under 5, [5–10] and [15–20] years. In other words, increasing tugboat age causes more serious accidents. Similarly, Talley (Reference Talley1995, Reference Talley1996) and Talley et al. (Reference Talley, Jin and Kite-Powell2006) found a positive relationship between increasing structural failure and ship age.
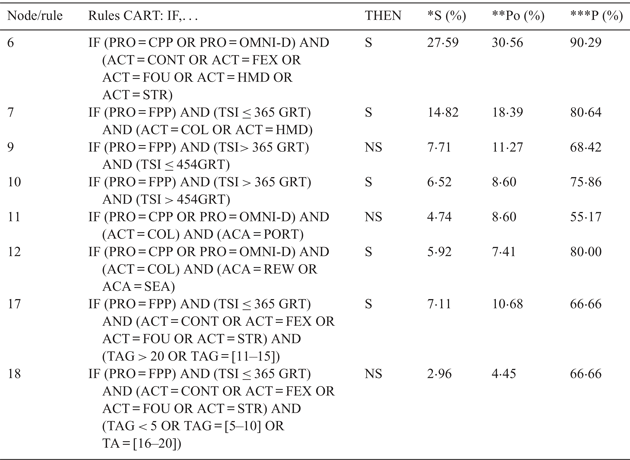
The right branch of the CART tree is completely identical with the first three levels of the left branch of the CHAID tree. As seen from the CART tree, if a tugboat equipped with CPP or OMNI-D has engaged in CONT, FEX, FOUT, HMD or STR, this rule gives the highest population (30·6%) and support (27·6%) with an 90·2% probability of an accident being serious (rule 6 in Table 6). At terminal 12, if the tugboat equipped with CPP or OMNI-D has a collision accident in open sea or restricted waters, this rule gives the third highest probability of serious accident with 80% (Rule 12 in Table 6). On the other hand, the probability of a serious collision accident in the port area decreases to about 45% in tugboats with the same characteristics (rule 11). This result is reasonable because tugboats in the sheltered port areas are less exposed to strong winds/waves and other adverse environmental effects that cause severe collision accidents.
Description of the rules created by the CART algorithm.

Note: *S: Support; **Po: Population; ***P: Probability.
4.2. Implementation of LR to dataset
A binary LR was applied to tugboat accident data in order to examine the marginal effects of explanatory variables on accident severity. As in CART and CHAID, all of the 11 variables were included in the LR model. The backward elimination method, in which the variables are examined for exclusion from the model in sequence on the basis of the significance level of the likelihood ratio, was then employed to select the variables for the LR model. For this study, the level of significance was determined as 0·1 and the least significant variable was removed at every level repeatedly until all the variables kept in the model met the significance criteria.
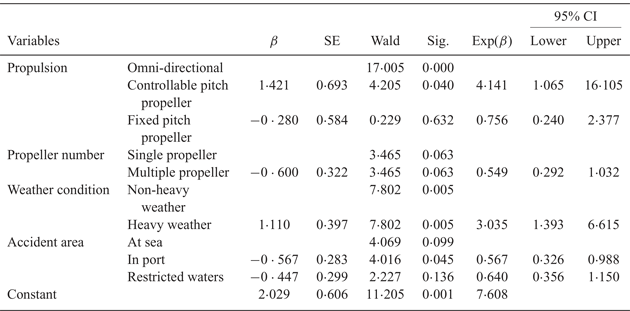
Table 7 shows the calculated variable coefficients and statistical results for the LR model. β coefficients are the characteristic indication for an effect coefficient, and Exp(β ) is the odds ratio. The odds is the ratio of the probability of occurrence of the event to the probability of non-occurrence (Bland and Altman, Reference Bland and Altman2000). An odds ratio of 1 indicates no effect; an odds ratio higher than 1 indicates that the variable in question increases risk; and an odds ratio less than 1 indicates that the variable reduces the risk (Szumilas, Reference Szumilas2010). In addition, Wald test results present the significance of every variable in the model; the higher the value, the more significant the variable (Chan, Reference Chan2004).
Estimates from the LR model.

Propulsion and weather conditions were discovered to be statistically significant at the level p < 0·05, while number of tugboat propellers and accident area were found to be significant at the level p < 0·1 (see Table 7). Propulsion ( $\hbox{Wald}=17{\cdot}005$, p = 0·00), which was the first splitter for both CHAID and CART, was also found to be one of the most significant predictors in the LR model. Tugboats with CPP are 4·14 times more likely to be involved in a serious accident than tugboats equipped with OMNI-D. On the other hand, it has been observed that tugboats equipped with FPP were found to be 32% less likely to be engaged in serious accidents compared with tugboats equipped with OMNI-D. One possible reason might be that because of their greater manoeuvrability tugboats equipped with CPP or OMNI-D are highly preferred for risky operations. However, being equipped with multiple propellers, which increase the manoeuvring capacity of tugboats, was found to decrease the serious accident risk dramatically. More clearly, tugboats equipped with a single propeller were found to have 82% higher probability of being involved in a serious accident compared with tugboats equipped with multiple propellers
 $( \hbox{OR}=0{\cdot}54) $.
The positive coefficient associated with the heavy weather condition  $( \hbox{OR}=3{\cdot}03) $ signifies that tugboat accidents that occurred in heavy weather are three times more likely to be serious. This result coincides with the studies examining container ship accidents (Talley, Reference Talley1996), fishing vessel accidents (Jin, Reference Jin2014), and ship accidents, irrespective of type, in the İstanbul Strait (Erol et al., Reference Erol, Demir, Çetişli and Eyüboğlu2018). These studies have revealed that the severity of marine accidents is greater in adverse weather conditions. Furthermore, according to our results, being on the open sea, which is more susceptible to adverse weather conditions, increases the probability of serious accidents. More specifically, the probability of serious accident in the open sea was found to be 79% higher than in port areas
 $( \hbox{OR}=0{\cdot}56) $ and 56% higher than in restricted waters
 $( \hbox{OR}=0{\cdot}64) $, such as river, channel etc. Similarly, Talley (Reference Talley1995, Reference Talley1996) and Weng et al. (Reference Weng, Li, Chai and Yang2018) suggested that the severity of marine accidents is lower in inland waters than open seas.
The equation for calculating the severity level of serious accidents involving tugboats is as follows. The numerical values are from the β estimates in Table 7.
 $$\begin{align}{\text{Serious accident severity} & = 2.029 + 1.421^{\ast} \text{Controllable pitch propeller} \\ & \quad - 0.280^{\ast} \text{Fixed pitch propeller} - 0.600^{\ast} \text{Multiple propeller} \\ &\quad+ 1.110^{^\ast} \text{Heavy weather}\\ &\quad - 0.567^{\ast} \text{In port} - 0.447^{\ast} \text{Restricted waters}}\end{align}$$
For example, if a tugboat equipped with multiple CPPs has an accident in a port area under heavy weather conditions, the serious accident severity level is 3·39 and  $e^{-3{\cdot }39}=0{\cdot}034$, which generates the
 $\hbox{probability}=1/( 1+0{\cdot}034) =0{\cdot}97$. This case will likely result in a serious accident, with 97% probability.
4.3. Importance of the variables
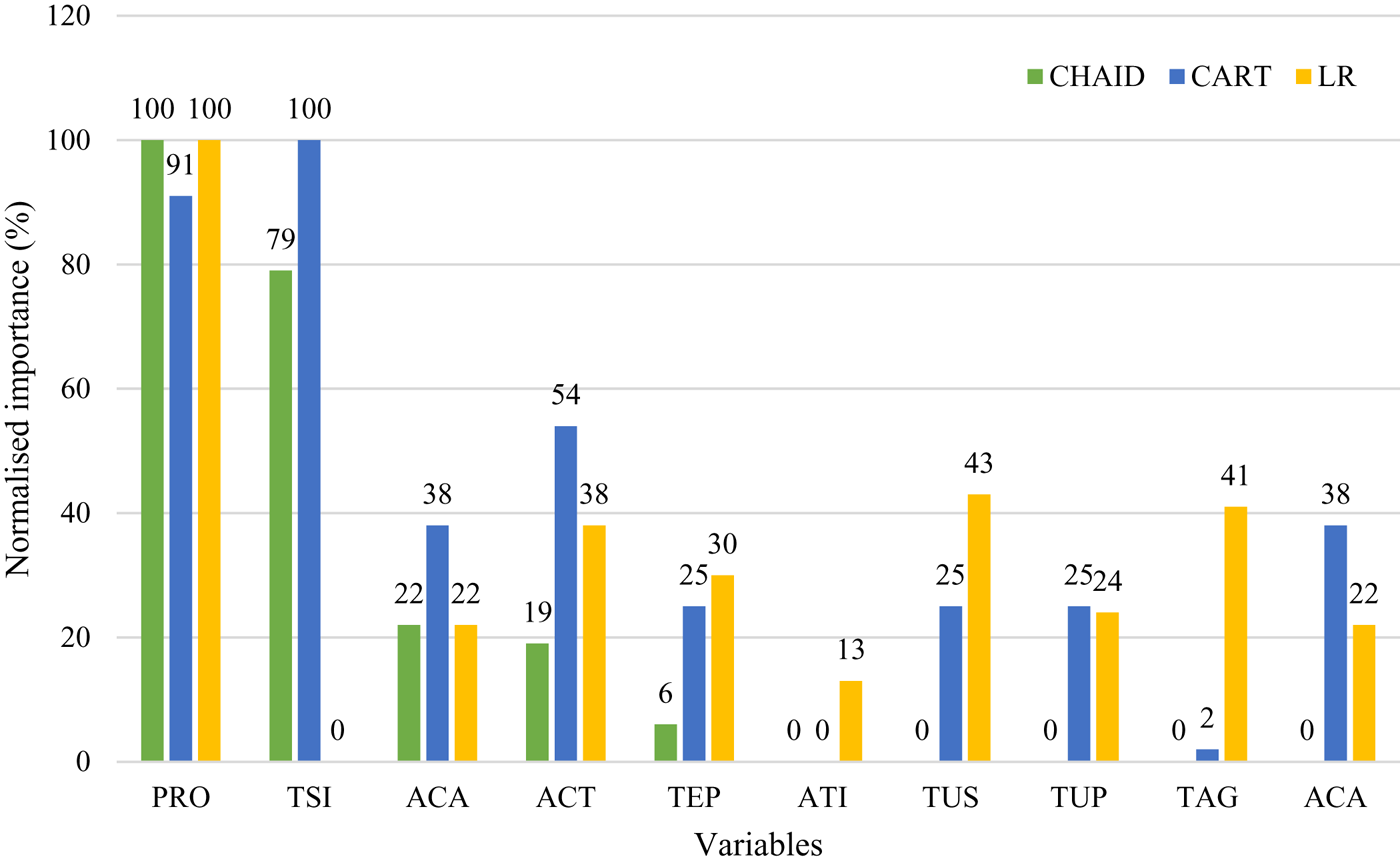
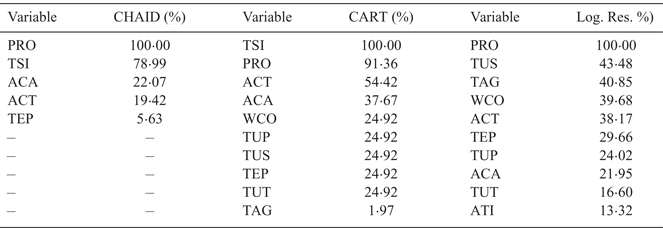
Table 8 and Figure 5 show the normalised importance of variables in the DT models and LR model. It was determined that five variables had the biggest effect on tugboat accident severity with the CHAID algorithm, with percentages ranging from 5·6% to 100%. A total of 10 variables with percentages ranging from 1·9% to 100% and from 13% to 100% were detected with the CART algorithm and by the LR model, respectively. PRO, ACA, ACT and TEP are common variables with different orders of importance. However, as seen from Figure 5, TSI is the most important predictor variable for CART and the second most important variable for CHAID, whereas this variable has zero predictive power for the LR model. Similarly, the ship size was emphasised in several previous studies (Jin, Reference Jin2014; Jin et al., Reference Jin, Kite-Powell, Talley and Talley2012; Talley, Reference Talley1995, Reference Talley1996, Reference Talley1999a) as one of the crucial variables in analyses of accident severity. ACT was found to be the third most important variable with CART (54%) while LR and CHAID gave a lesser value for the importance of this predictor at 38% and 19%, respectively. Several studies (Talley, Reference Talley1996; Darbra and Casal, Reference Darbra and Casal2004; Talley et al., Reference Talley, Jin and Kite-Powell2006; Jin, Reference Jin2014) asserted that accident type is a key variable in accident severity. It was also found that the WCO variable has 40% importance for LR and 25% importance for CART in predicting tugboat accident severity. This result is consistent with such studies as Jin (Reference Jin2014), Eleftheria et al. (Reference Eleftheria, Apostolos and Markos2016]) and Weng and Li (Reference Weng and Li2019), which found a significant correlation between weather condition and marine accident severity.
Normalised importance of the variables.

Normalised importance of variables.

4.4. Performance metric measurement
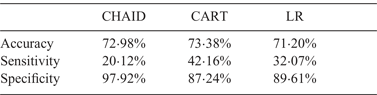
Table 9 shows the comparison of performance of the CHAID, CART and LR models based on the accuracy, sensitivity and specificity indicators. As can be seen from these results, these three models produce around 71–73% similar predictive accuracy. However, the CART algorithm gives slightly better prediction accuracy (73·38%). For the individual severity class, the models yield comparatively correct predictions for the severity level of serious accidents, while the models have relatively low classification competency for severity level of non-serious accidents. This can be clearly seen from the sensitivity and specificity results of the models. While specificity is found to be at around 87–98%, sensitivity is detected with the lowest percentage: 20% for CHAID and with the highest percentage 42% for CART model. Although CHAID has the poorest capability of classifying non-serious cases, it is the best at classifying serious accidents.
Performance comparison of the models.

5. CONCLUSION
Two powerful DT algorithms were utilised in this study to extract the factors contributing to severity of tugboat accidents. Furthermore, binary LR was also applied to the dataset in order to investigate the contribution of various variables to accident severity. The dataset obtained from the IHS Sea-web database and EMCIP records consists of a total of 496 accident records (159 non-serious and 337 serious) for the period 2008–2019. The results of the study demonstrated that tugboat propulsion is the most important and influential factor in tugboat accidents. Some key points of the results for each model are as follows:
The key points of the results gained through the CHAID analysis:
– The vast majority of collision accidents involving tugboats equipped with CPP or OMNI-D, whether in open sea or restricted waters, are serious. Exactly the same result was also generated by CART.
– If a tugboat equipped with CPP or OMNI-D experiences contact, fire/explosion, foundering, hull/machinery damage or stranding, this accident is most likely to be serious.
– Collision accidents occurring in port areas have a high probability of being non-serious for tugboats over 366 grt.
– For tugboats equipped with FPP, the serious accident rate decreases when tugboat size increases from under 366 grt to over 381 grt.
The key points of the results gained through the CART analysis:
– Tugboats over 454 grt are more likely to be involved in serious accidents than tugboats between 365 and 454 grt. This clearly shows that increasing tugboat size causes more serious accidents.
– If a tugboat equipped with FPP and 365 grt or less has a collision or hull/machinery damage, this accident is most likely to be serious.
– Tugboats of less than 366 grt, equipped with FPP, aged over 20 and [11–15 years have more probability of being involved in a serious accident than tugboats aged under five [5–10] and [15–20] years, especially in contact, fire/explosion, stranding and foundering accidents.
– Apart from the literature on accident and damage severity on different types of ships, tugboat size was not found to be a significant variable through the LR model. In the exact opposite to the LR results, tugboat size was found to be the most important predictor and the second most important predictor in CART and CHAID analysis, respectively. Especially, 365 grt was found to be a critical size for tugboats equipped with FPP, according to CART. Moreover, according to CHAID, tugboats under 366 grt equipped with FPP were found to have 20% more serious accidents compared with larger tugboats with identical specifications.
The key points of the results gained through the LR analysis:
– Tugboat propulsion and number of propellers, weather condition and accident area were determined to be statistically significant.
– Tugboat propulsion, which is the first splitter for DT, is also one of the most significant predictors in the LR model.
– Tugboats equipped with CPP and OMNI-D are more likely to be engaged in a serious accident than tugboats equipped with FPP. The reason for this may be that the former are assigned to riskier tasks due to their high manoeuvrability.
– The mean age of tugboats equipped with FPP, CPP and OMNI-D propellers was found to be 29, 31 and 25 years, respectively. Even if age is a decisive factor over the type of propulsion, a significant difference was not found between tugboat age and type of propulsion. Although the mean age of tugboats equipped with OMNI-D propeller was less than the others, the probability of having a serious accident was found to be higher among these tugboats due to the preference for assigning them to riskier tasks. Therefore, it was concluded that the most important factor affecting accident severity is the propulsion type, which is the crucial determinant of a tugboat's manoeuvrability.
– Tugboat accidents occurring in heavy weather are more likely to be serious. This clearly indicates that heavy weather is a critical risk factor for tugboats.
– The probability of serious accident on the open sea is higher than in port areas and restricted waters. Hence, tugboats navigating on the open sea are vulnerable to serious accidents. This is reasonable, due to the fact that there would be a shorter response time and a higher rescuing efficiency for tugboat accidents that occur in restricted waters and port areas.
– Nearly 68% of the accidents were found to involve tugboats aged over 20 years. However, tugboat age was not revealed to be a significant factor on accident severity in LR. In some rules in CART analysis, however, older age was seen as an important factor.
The prediction of tugboat accidents is a critical issue for the safety of navigation. Many recent studies have focused on accidents involving container ships, tankers, general cargo carriers, and passenger vessels, but the extracting of factors affecting the occurrence of tugboat accidents has not been examined. In this respect, it should be stated that this study has two main contributions to the relevant literature, as follows. This study fills the gap in the related fields by examining tugboat accidents utilising DT algorithms and the LR method. Additionally, the deduced results will be beneficial for tugboat operators and port authorities in enhancing their awareness of the factors affecting tugboat accidents.
Under-reporting of marine accidents leads to insufficient accident databases, which is a critical disadvantage for big data analysis. Databases containing tugboat accidents, especially, do not provide detailed data. Due to this limitation, data on accident cause is not included in the dataset. Therefore, unfortunately, the effect of the accident cause could not be analysed in this study. If the data on accident cause were collected, the authors would examine the effect of this data on the severity of tugboat accidents. On the other hand, other data mining methods such as association rule mining, Bayesian network etc. can be applied to this collected dataset in further studies. Finally, the outputs of this study can be a reference for management units in developing strategies for preventing tugboat accidents and could be also utilised in effective planning for actionable prevention programmes and practices.