Introduction
Quadrilateral pyroxenes are abundant and ubiquitous in nature. Their equilibria are the basis for petrological interpretations of mafic and ultramafic assemblages, and provide a thermometric constraint on the geological history of host rocks. As an example, two-pyroxene thermometry, based on the partitioning of Ca, Mg and Fe between coexisting quadrilateral clino- and orthopyroxenes, is an established and widely used petrologic tool (Lindsley Reference Lindsley1983; Lindsley and Andersen, Reference Lindsley and Andersen1983). Quadrilateral pyroxenes are solid solutions of the end-members diopside (CaMgSi2O6), enstatite (Mg2Si2O6), hedenbergite (CaFeSi2O6) and ferrosilite (Fe2Si2O6). Diopside and hedenbergite form a complete solid solution in the monoclinic C2/c structure, while a large miscibility gap is present between the Ca-rich and the Ca-poor part of the quadrilateral. This gap is larger in Mg- than in Fe-rich compositions. Enstatite and ferrosilite also form a complete solid solution, making, together with a limited substitution with diopside and hedenbergite, the Pbca orthopyroxene family. In common practice, we refer to clino- and orthopyroxenes as the C2/c and Pbca monoclinic and orthorhombic varieties, coexisting in several ultramafic rocks and meteorites. However, the picture would not be complete without consideration of the monoclinic P21/c pyroxene, named pigeonite. Pigeonite is found mainly in igneous rocks that cooled rapidly, as an Fe-rich, Ca-poor phase. Natural pigeonites contain ~0.2 Ca atoms per formula unit (apfu), more than other orthopyroxene, where the Ca content is <0.1 apfu.
Natural pigeonite is generally Fe-rich, but clinopyroxenes with Ca content at ~0.2 apfu can be synthesized for any bulk Fe content. However, the synthesis of Mg-rich pigeonite requires high-temperature/low-pressure conditions seldom found in nature (Boyd and Schairer, Reference Boyd and Schairer1964; Lindsley and Andersen, Reference Lindsley and Andersen1983; Tribaudino et al., Reference Tribaudino, Nestola, Cámara and Domeneghetti2002). Mg-rich pigeonite is found in meteorites, such as the achondrite family of ureilites, formed from cooling of an igneous assemblage at temperatures of ~1200–1300°C (Takeda, Reference Takeda1987; Tribaudino, Reference Tribaudino2006).
There is a strong structural connection between Pbca and P21/c pyroxenes, as the Pbca structure originates by twinning at the unit-cell scale of the P21/c phase. For this reason, the polyhedral bond distances in clino- and orthoenstatite are very similar (Ohashi, Reference Ohashi1984). However, the P21/c structure is more flexible than the Pbca structure and can host larger cations such as Ca in the M2 site. This explains the structural changes observed when Mg and Fe substitute for Ca. Calcium-rich pyroxenes, where the M2 site is mostly filled by Ca, have a C2/c space group; with decreasing Ca content, a transition to the P21/c structure occurs. The orthopyroxene structure is only formed in almost Ca-free pyroxenes. Recently, the high-pressure transition of orthopyroxene to a P21/c pyroxene has been reported (Zhang et al., Reference Zhang, Reynard, Montagnac and Bass2013, Reference Zhang, Reynard, Montagnac and Bass2014).
In natural pyroxenes, a wide miscibility gap between clinopyroxenes and orthopyroxenes hides the C2/c–P21/c–Pbca sequence, which can be studied in samples synthesized from subsolidus. In (Ca,Mg)MgSi2O6 pyroxenes extended solid solution is possible only at very high temperatures (>1450°C), and during quenching exsolution textures are formed easily (Tribaudino et al., Reference Tribaudino, Nestola, Cámara and Domeneghetti2002; Weinbruch et al., Reference Weinbruch, Styrsa and Müller2003), whereas in (Ca,Fe)FeSi2O6 and (Ca,Co)CoSi2O6 pyroxenes the synthesis can be performed successfully at a lower temperature, and provides homogenous crystals.
Structural changes at the transition between C2/c and P21/c have been described for (Ca,Fe)FeSi2O6 synthetic pyroxenes (Ohashi et al.,1975) whereas in (Ca,Mg)MgSi2O6 pyroxenes the transition could only be pinpointed by transmission electron microscopy (TEM) (Tribaudino, Reference Tribaudino2000). The same phase transition was studied in LiM 3+Si2O6 pyroxenes with M 3+ = M1 site = Al, Ga, V, Fe, Sc and In) in Redhammer and Roth (Reference Redhammer and Roth2004), and in LiFeGe2O6 pyroxene by Redhammer et al. (Reference Redhammer, Cámara, Alvaro, Nestola, Tippelt, Prinz, Simons, Roth and Amthauer2010). Results on synthetic samples provided a wealth of information on the general issue of the structural changes occurring as Ca is exchanged by a smaller cation, but, as yet, no effort has been made to apply the results to some natural cases.
Recently, a series of (Ca,Co)CoSi2O6 (hereafter Ca–Co) pyroxenes was synthesized, showing evidence of a phase transition at the composition of 0.4 apfu (Mantovani et al., Reference Mantovani, Tribaudino, Bertoni, Salviati and Bromiley2014); the C2/c Ca-rich samples of the series were studied by single-crystal refinement in Mantovani et al. (Reference Mantovani, Tribaudino, Mezzadri, Calestani and Bromiley2013). Cobalt, as Co2+, is a minor element in the composition of natural pyroxenes. However, it is interesting as it provides a synthetic model for natural pigeonite: the Co2+ ionic radius (0.745 Å), intermediate between that of Fe2+ (0.78 Å) and Mg2+(0.72 Å), is quite close to the average M1 cation radius of natural pigeonite.
In this paper the refinement of a P21/c pyroxene with composition (Ca0.2Co0.8)CoSi2O6 is reported, together with results of the refinement of pigeonite in two ureilites, with a high Mg content and an average ionic radius in the M2 site lower than in most P21/c pyroxenes. The aim is to integrate results on the (Ca,Co)CoSi2O6 pyroxenes with literature refinements on synthetic and natural pigeonite and to discuss the general issue of structural changes occurring through the transition between Ca-rich and Ca-poor pyroxenes.
Experimental
A synthetic pyroxene with composition (Ca0.2Co0.8)CoSi2O6, and two natural pigeonites picked from the ALHA77257 and RKPA80239 ureilites (from Allan Hills and Reckling Peak, Antarctica, respectively, loaned from NASA) were refined. The ureilitic pyroxenes were previously characterized by TEM and scanning electron microscopy with energy dispersive spectroscopy (SEM-EDS) analysis (Tribaudino, Reference Tribaudino2006).
Synthesis of the Co-bearing pyroxene
Our Ca–Co pyroxene was synthesized at a pressure of 3 GPa, as at lower pressure olivine and a silica phase are stable instead of pyroxene. After annealing at room temperature, starting material with bulk composition (Ca0.2Co0.8)CoSi2O6 was put in a 5 mm inner diameter, 10 mm long, Pt capsule with 20 wt.% distilled water to aid crystal growth, and welded shut. The experiment was run in a 0.5 inch graphite–talc–pyrex piston-cylinder assembly; the sample was first pressurized, heated at 1500°C for 30 min, cooled slowly from 1500 to 1350°C, and eventually annealed for 6 h at 1350°C. Temperature was measured with a Pt–Pt10%Rh thermocouple. Further experimental details are reported in Mantovani et al. (Reference Mantovani, Tribaudino, Mezzadri, Calestani and Bromiley2013). Single crystals of Co-pyroxene crystals, with sizes up to 75–100 µm, were obtained, from among which those with sharp optical extinction were selected for single-crystal X-ray diffraction. No glass was found after the synthesis. Powder X-ray diffraction and SEM-EDS characterization confirmed that pyroxene and quartz (due to the excess of SiO2 in the starting material) are the only phases.
TEM and SEM-EDS analysis
Scanning electron microscopy with EDS analysis was done on polished grains after embedding in epoxy, following the same analytical procedures as in Mantovani et al. (Reference Mantovani, Tribaudino, Mezzadri, Calestani and Bromiley2013). No deviation from the nominal stoichiometry was observed in the (Ca0.2Co0.8)CoSi2O6 pyroxene; the two ureilitic pigeonites were analysed in Tribaudino (Reference Tribaudino2006), and have compositions of Ca0.12Mg1.54Fe0.24Mn0.02Cr0.03Al0.03Si2.00 and Ca0.12Mg1.54Fe0.29Mn0.01Cr0.03Al0.03Si1.98 for ALHA77257 and RKPA80239, respectively.
Transmission electron microscopy characterization was reported in previous papers (Tribaudino, Reference Tribaudino2006; Mantovani et al., Reference Mantovani, Tribaudino, Bertoni, Salviati and Bromiley2014). The two ureilitic pyroxenes show stacking disorder along the a* axis, probably related to a shock imprinting, but no exsolution textures, such as spinodal decomposition or augite lamellae. Streaking is also observed along the a* axis in selected area electron diffraction patterns from the Co pigeonite, indicative of some stacking disorder, but again, there is no evidence of exsolution textures (Mantovani et al., Reference Mantovani, Tribaudino, Bertoni, Salviati and Bromiley2014).
Single-crystal X-ray diffraction
The crystals for single-crystal X-ray diffraction were chosen carefully, as they proved highly defective. Several grains, chosen for their sharp optical extinction, showed diffractometer peak enlargement and peak splitting.
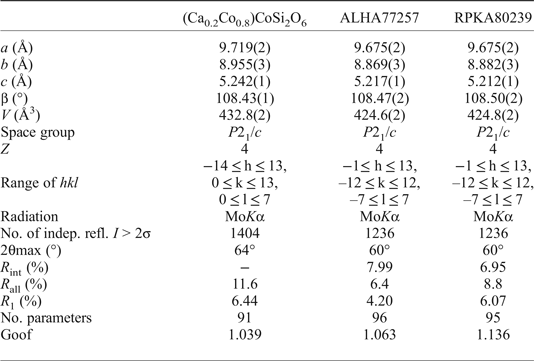
The single-crystal data collection was performed on the (Ca0.2Co0.8)CoSi2O6 pyroxene with a Bruker Smart device, equipped with an Apex II CCD detector using MoKα radiation. The full reflection sphere was measured up to 2θmax = 64°. Due to partial superimposition of the reflections induced by the presence of twinning, the data reduction was performed with the TWINABS program (Sheldrick, Reference Sheldrick2009). The refinement was then carried out by using the HKLF 5 command of SHELXL-97 (Sheldrick, Reference Sheldrick1997), allowing the proper determination of the intensity contribution to the common reflections after assignment of the scale factor to each twin individual. Consequently no R int is provided for this composition. For the two ureilitic pyroxenes a four circle diffractometer was used, and the same experimental conditions described for the refinement of the Y-791538 pigeonite in Tribaudino (Reference Tribaudino2006), i.e. θ–2θ scan, using graphite monochromatizer MoKα radiation (λ = 0.71073); a correction for absorption using the ψ-scan method was implemented, but did not improve the results and was therefore discarded. The intensity data were corrected for absorption by the SADABS program (Sheldrick, Reference Sheldrick1996), and the P21/c space group was confirmed by an analysis of the reflection extinctions. Weighted structural anisotropic refinements were performed using the SHELXL-97 program (Sheldrick, Reference Sheldrick1997), within the WinGX suite (Farrugia, Reference Farrugia1999). The refinement was performed in the P21/c structure starting from the coordinates of the synthetic Ca0.15Mg1.85Si2O6 pigeonite (Tribaudino et al., Reference Tribaudino, Pasqual, Molin and Secco2003). In the (Ca0.2Co0.8)CoSi2O6 pyroxene, the M2 site was filled by Ca and Co, whereas full site occupancy of Co and Si were assumed for the M1 and T sites. In the ureilitic pyroxenes, Ca was fixed in the M2 site, Al and Cr in the M1 site, with the occupancy obtained from EDS analysis. The occupancies of Fe and Mg were refined in the M2 and M1 structural sites, within constraints of the determined chemical composition. Lastly, Mn was partitioned between the M1 and M2 sites as in Pasqual et al. (Reference Pasqual, Molin and Tribaudino2000).
Anisotropic refinement was allowed, with all positive definite atomic displacement parameters (ADPs). Difference-Fourier maps showed no residuals higher than 1e –/Å3 for any of the samples.
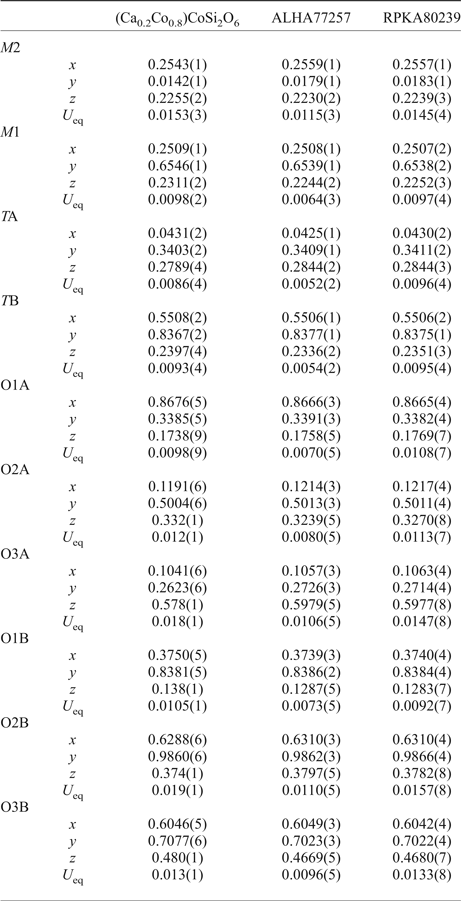
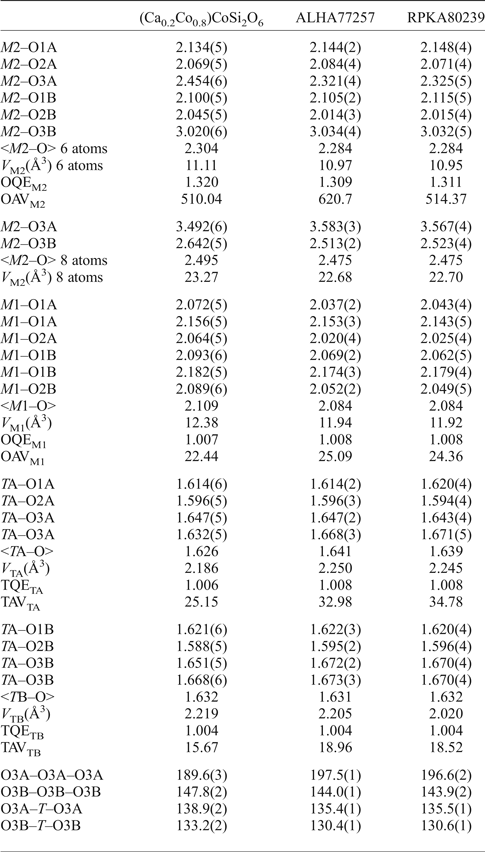
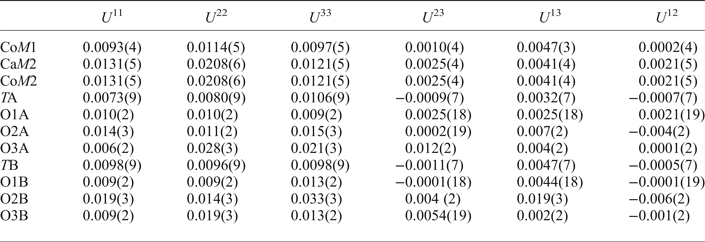
Cell parameters and main structural results, fractional coordinates and displacement parameters, selected bond length and angles are reported in Tables 1, 2, 3 and 4.
Cell parameters and main structural results for pigeonite samples.

Weighted full-matrix least square anisotropic refinements were completed using SHELXL-97 w = 1/[σ2 (F o2) + (a*P)2 + (b*P) ] where P = (F o2 + 2F c2)/3 (Sheldrick, Reference Sheldrick1997).
Fractional coordinates and displacement parameters of pigeonite samples

Selected bond length (Å) and angles (°) for pigeonite samples.
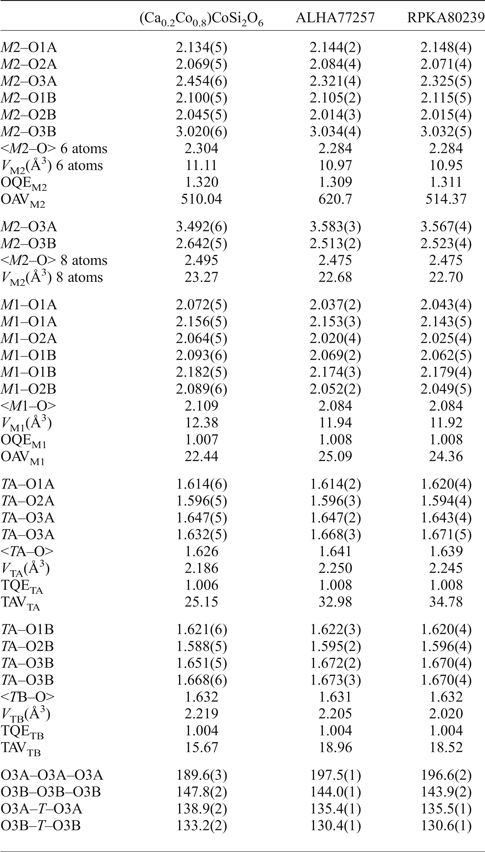
TQE, TAV, OQE and OAV are quadratic elongation (dimensionless) and angle variance (°2) for tetrahedra and octahedra (Robinson et al., Reference Robinson, Gibbs and Ribbe1971). The values for the kinking angles O3–O3–O3 and O3–T–O3 linkage are calculated with VESTA (Momma and Izumi, Reference Momma and Izumi2008).
Anisotropic displacement parameters for the single crystal (Ca0.2Co0.8)CoSi2O6.

Results
Average structure
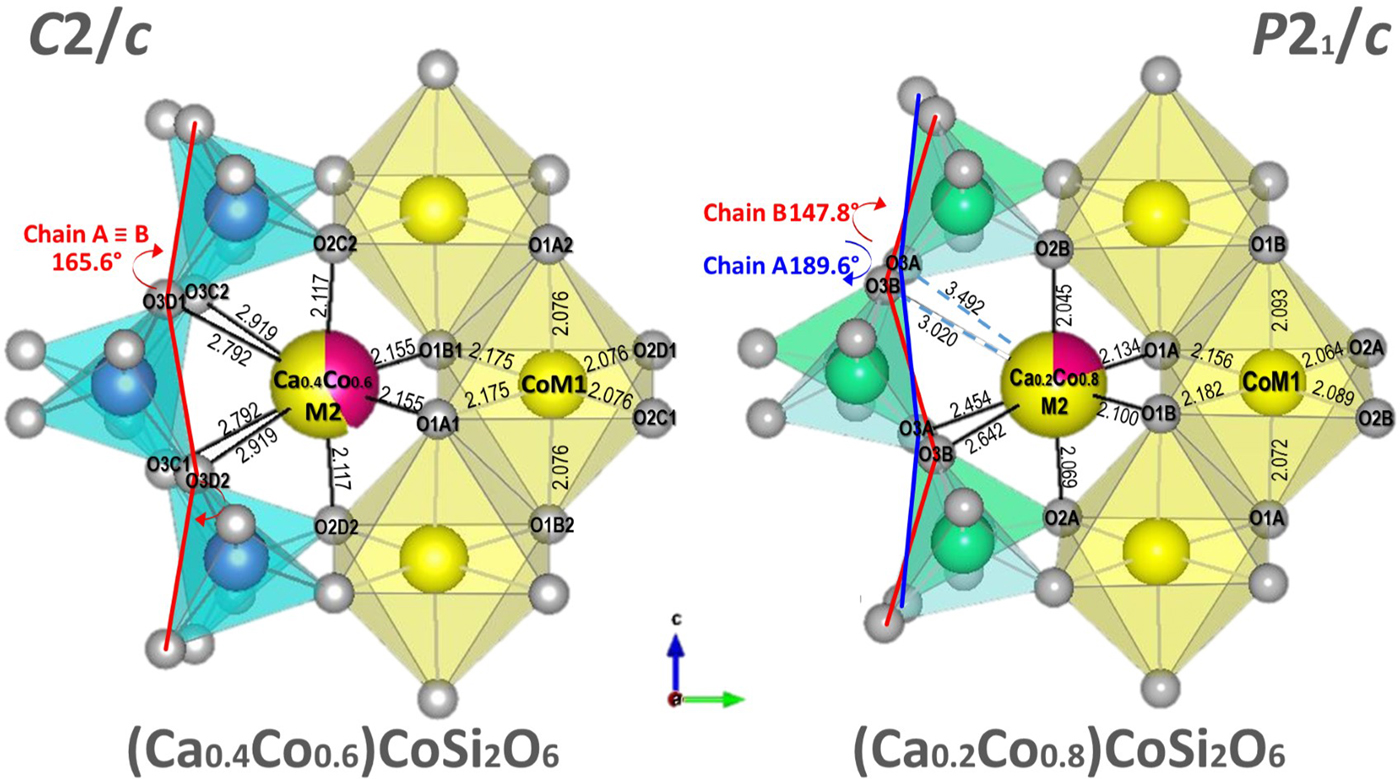
The average structure of the Ca0.2Co1.8Si2O6 pyroxene is discussed here together with that of other Ca–Co pyroxenes. The trend observed in the simplified system provides insight into the subsequent discussion of natural pigeonites (Figs 1 and 2)
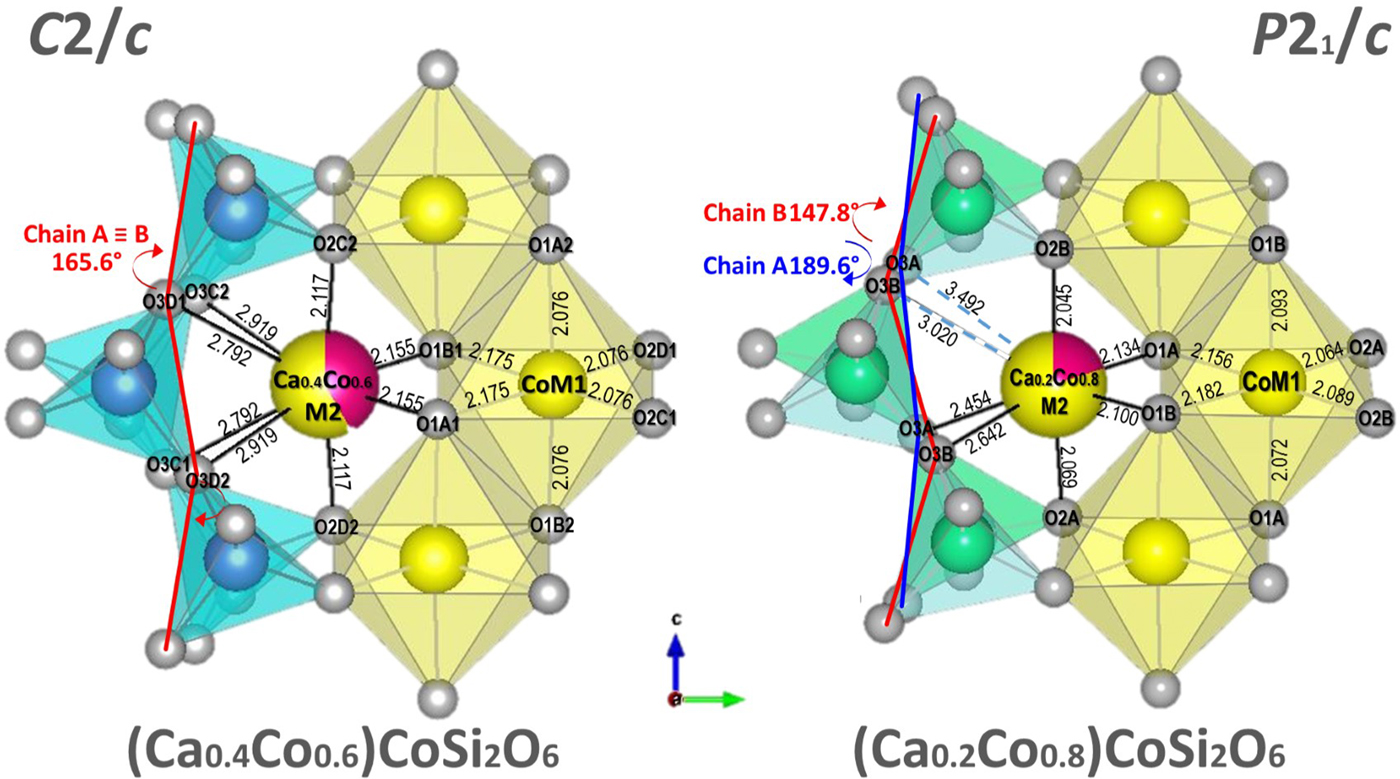
Comparison of the structures of C2/c (Ca0.4Co0.6)CoSi2O6 and P21/c (Ca0.2Co0.8)CoSi2O6 (Mantovani et al., Reference Mantovani, Tribaudino, Mezzadri, Calestani and Bromiley2013, this work). Both structures are projected onto (100). Bond lengths and kinking angles are shown.
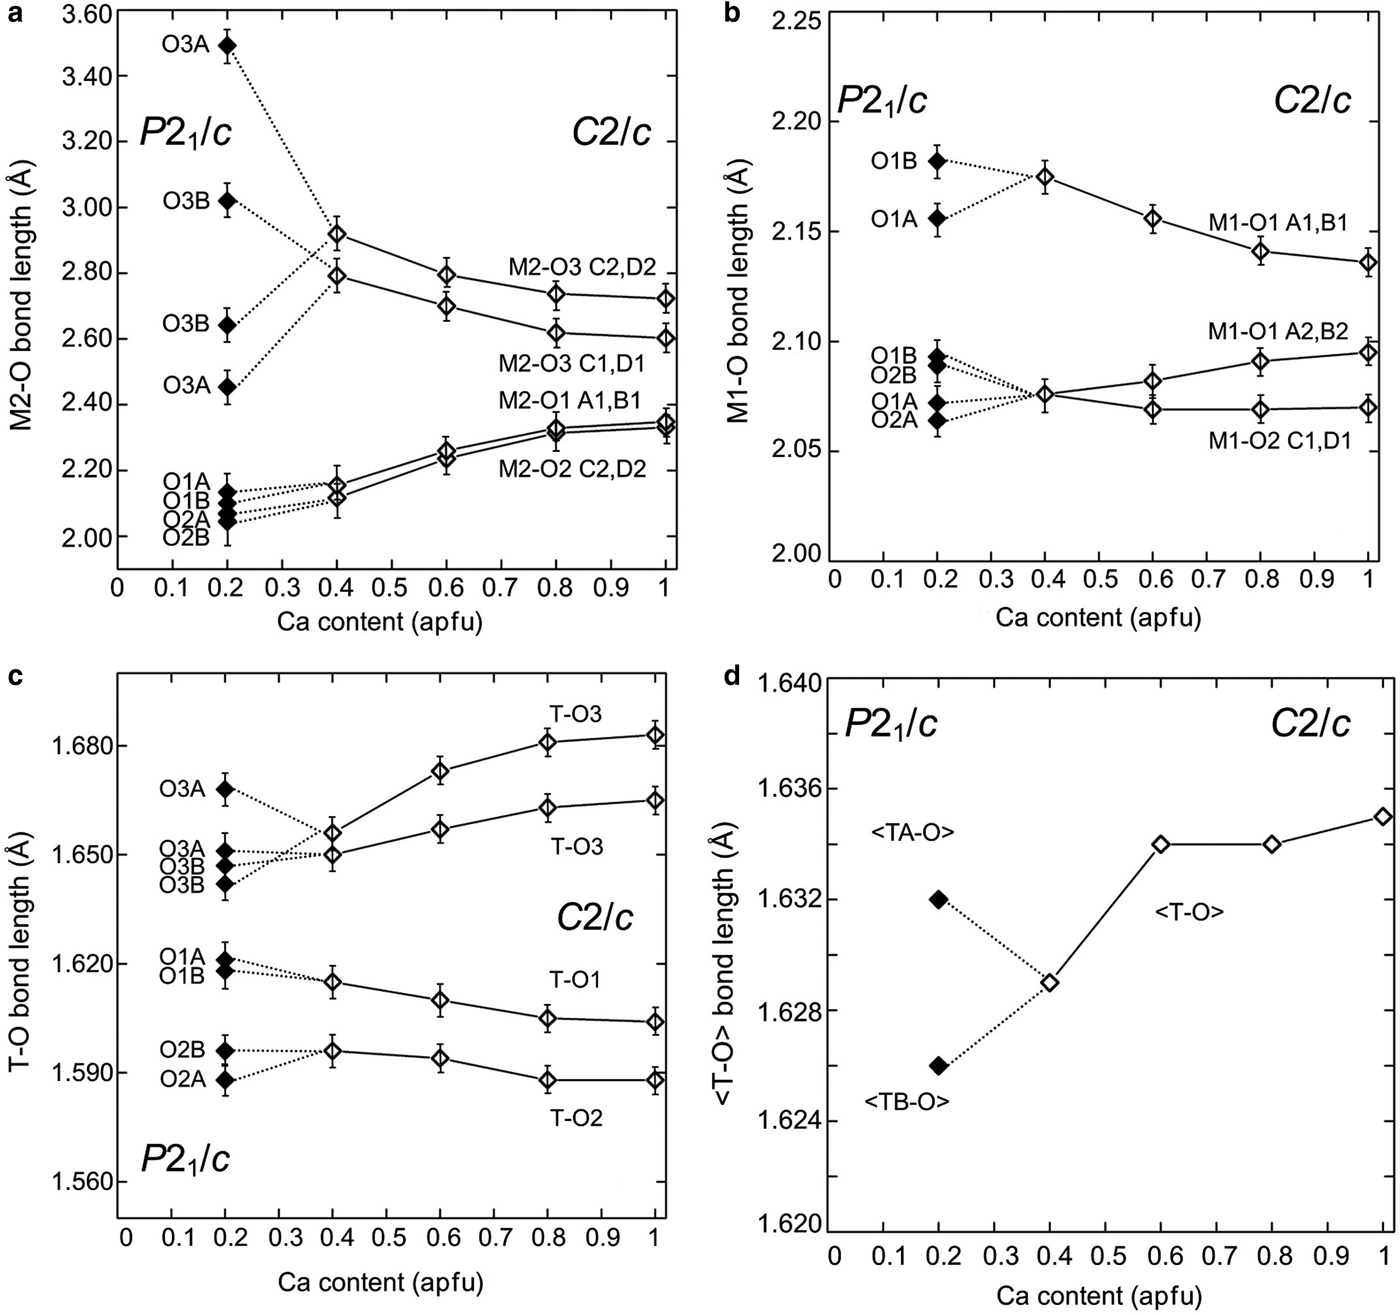
(a) M2–O; (b) M1–O; (c) individual; and (d) average T–O bond lengths of Ca–Co pyroxenes vs. Ca content. Data for Ca–Co: Mantovani et al. (Reference Mantovani, Tribaudino, Mezzadri, Calestani and Bromiley2013) and this work.
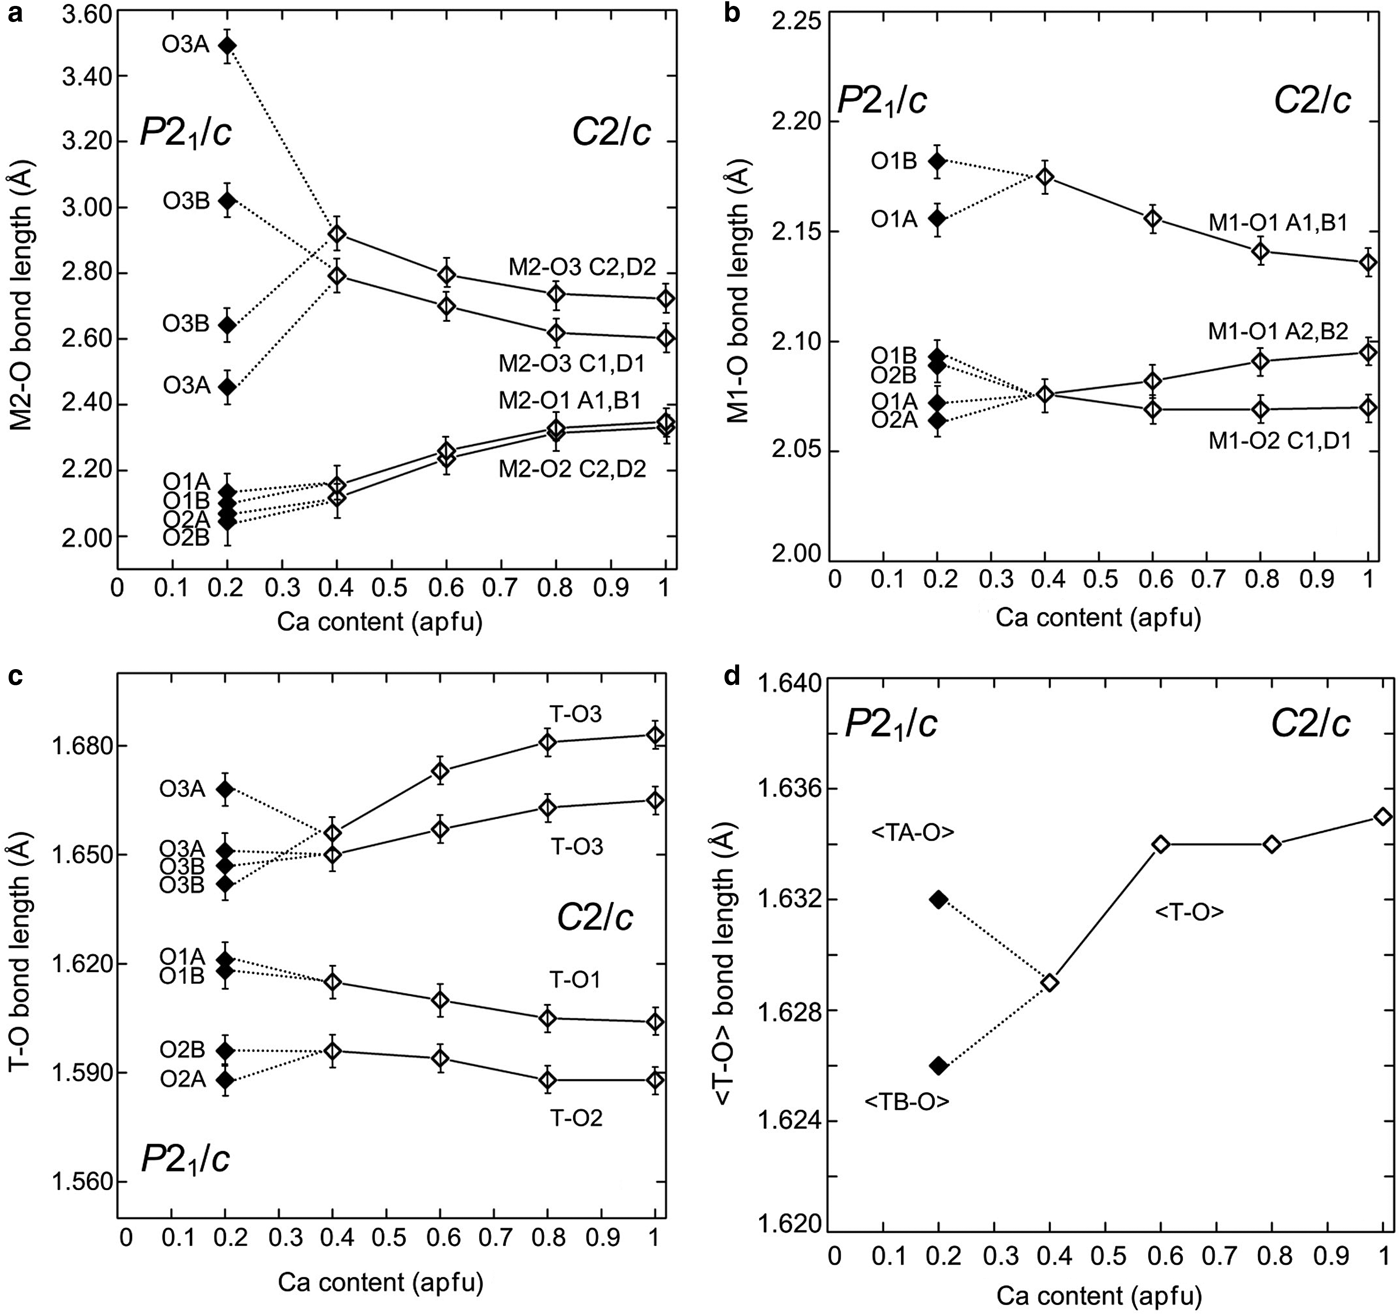
Among the refined Ca–Co pyroxenes, Ca0.2Co1.8Si2O6 is the only one exhibiting P21/c symmetry, and has the lower Ca content. Between (Ca0.4Co0.6)CoSi2O6 and (Ca0.2Co0.8)CoSi2O6 there is a phase transition from C2/c to P21/c, with loss of lattice centring due to differential kinking of the formerly unique tetrahedral chains. One of these, the B chain, undergoes further kinking, whereas the other, the A chain, is released, and rotates in the opposite direction. The result is that the A chain is elongated, and kinked opposite to the B chain (S rotation) (Fig. 1). The chain rotation at the transition is dramatic: in Co pyroxenes the progressive substitution of 0.6 Co atoms for Ca in M2 between CaCoSi2O6 and (Ca0.4Co0.6)CoSi2O6, decreases the kinking angle by only 3°, whereas a further substitution of 0.2 Co between (Ca0.4Co0.6)CoSi2O6 and (Ca0.2Co0.8)CoSi2O6 rotates the A and B chains by 25° and 17°, respectively. These values are similar for Ca–Fe and Ca–Mg pyroxenes and are related to the phase transition at a critical average ionic radius in the M2 site. M2–O3 bond distances are affected consequently.
In contrast, tetrahedral chain rotation has a minor influence on the M2–O1 and M2–O2 bond distances, which deviate from the trend observed in C2/c Co-pyroxenes only by a minor split in formerly equivalent distances. In (Ca0.2Co0.8)CoSi2O6, the difference between the split distances in the P21/c structures, as measured from the splitting of the C2/c M2–O3C2,D2 and M2–O3C1D1 couples, is 0.85 and 0.56 Å, whereas the split of the M2–O2 and M2–O1 is just 0.02 and 0.03 Å, respectively (Figs 2 and 3).
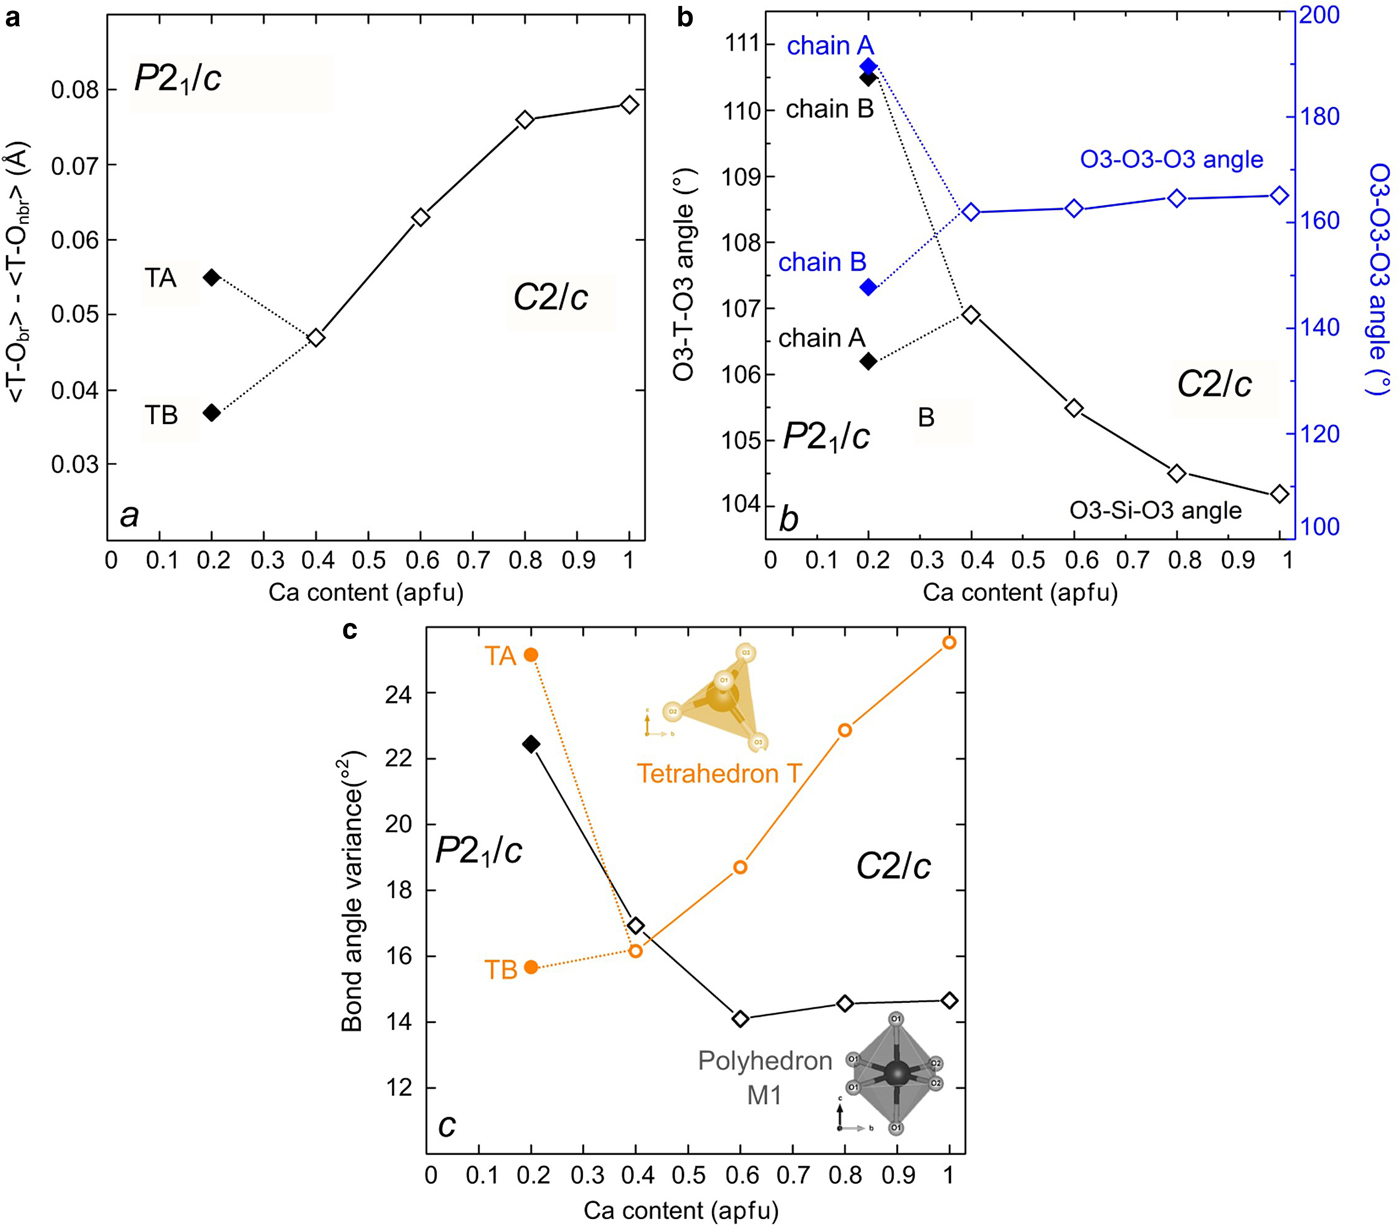
Tetrahedral structural parameters in Ca–Co pyroxenes: (a) difference between average bond length T–O bridging and non-bridging oxygen; (b) T–O–T and O3–O3–O3 angle; (c) bond angle variance of the M1 octahedron and the T tetrahedron in Ca–Co pyroxenes. Data for Ca–Co: Mantovani et al. (Reference Mantovani, Tribaudino, Mezzadri, Calestani and Bromiley2013) and this work.
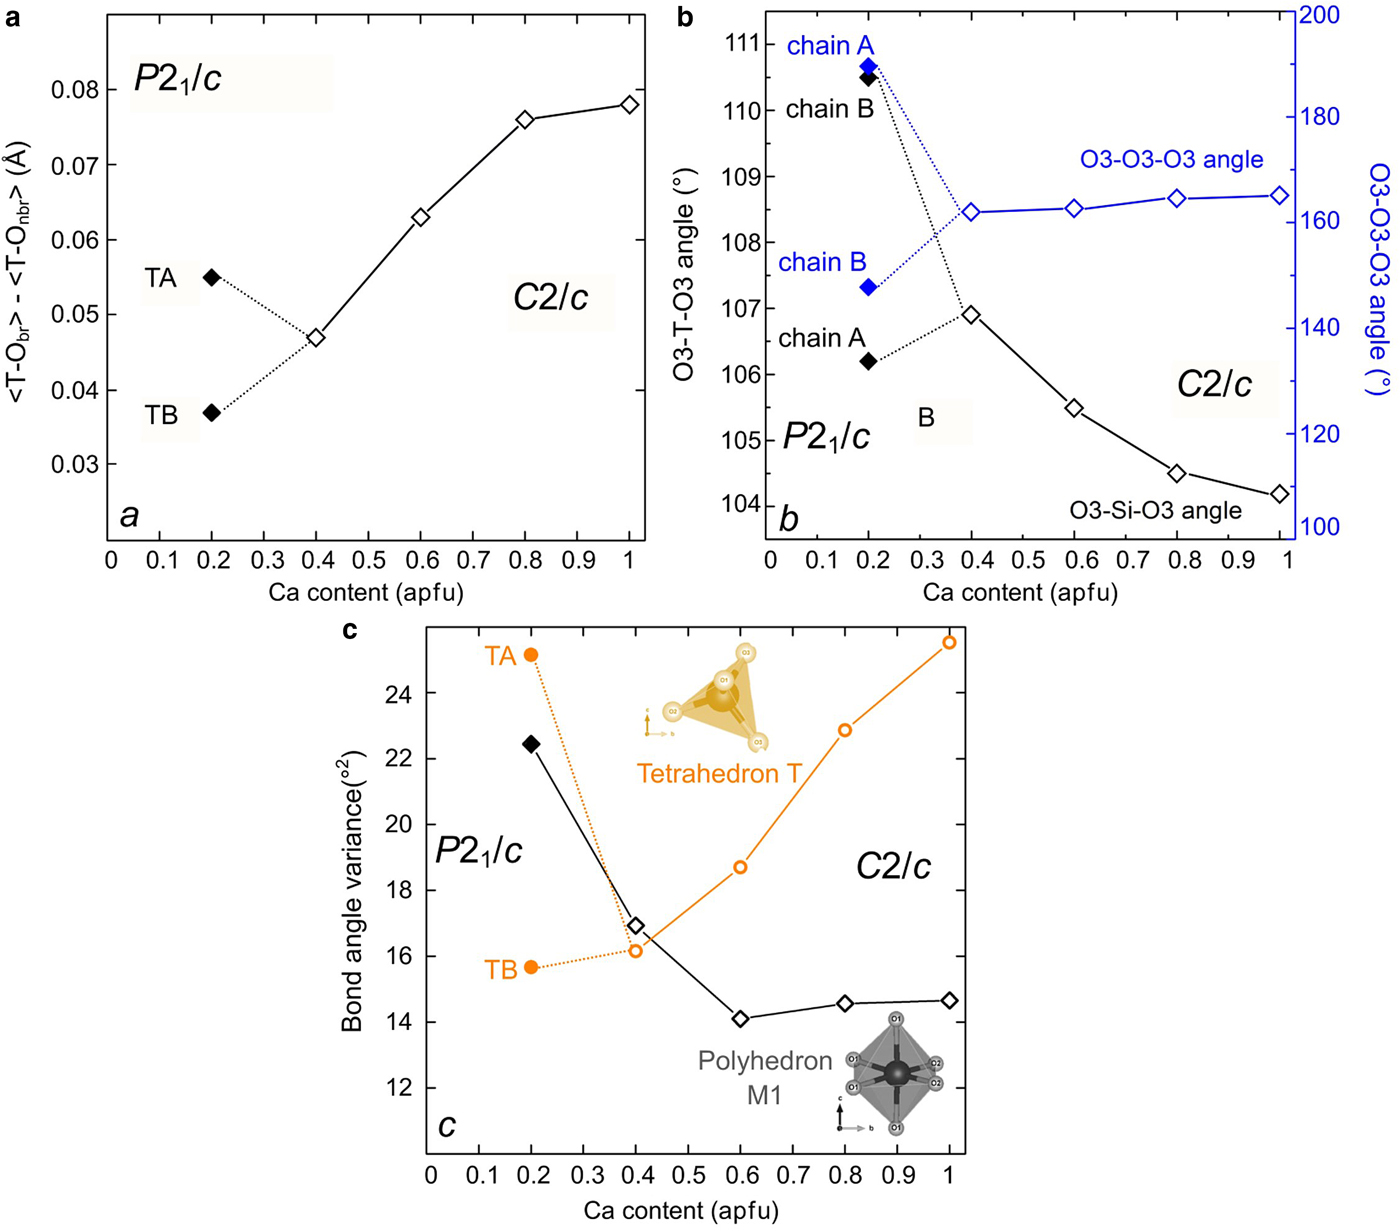
In the M1 polyhedron the bond distances in the part of the join poorer in Ca with P21/c symmetry are consistent with those of C2/c richer in Ca (Fig. 2). Again, limited splitting in the M1–O octahedral distances occurs, between 0.02 and 0.03 Å (Fig. 3b). On average, the M1–O bond distances change very little along the series, in agreement with the common presence of Co in the M1 site.
The transition also affects the tetrahedral configurations. T–O1, T–O2 and the two T–O3 bond distances, unique in C2/c, split in the P21/c symmetry, with different values in each of the tetrahedral chains (Fig. 2). The tetrahedra in the A and B chains have significantly different configurations: the average bond distances are longer in the B chain of the tetrahedra (Fig. 2), and the difference between bond lengths for bridging and non-bridging oxygens is also larger (Fig. 3a). In the C2/c structure the difference between the average T–O of the two shorter non-bridging and the two T–O longer bridging distances decreases as the longer M2–O3 distances increases. In the P21/c pyroxene the difference between average T–O bridging and non-bridging in the B chain increases, compared to the last C2/c (Ca0.4Co0.6)CoSi2O6, whereas in the A chain it decreases somewhat (Fig. 3a). In P21/c, a higher bond-angle variance is found in the A tetrahedron, whereas the distortion in the B tetrahedron follows the C2/c pyroxene trend (Fig. 3c). The larger distortion of the A chain is related to the lower value of the O3A–Si–O3A angle with respect to the ideal tetrahedron (106.2° vs. 109.5°); while the O3B–Si–O3B is closer to the ideal value (110.5°). This is an effect of the higher value of the kinking angle in the A chain (Fig. 2b). The A chain, which is significantly more elongated than the B chain, should be longer, but for symmetry, the Si2O6 unit repeat along the c axis must be the same in both chains. This is achieved by intra-tetrahedral deformation: the distance between the O3–O3 atoms in the A tetrahedron is smaller (2.630 vs. 2.728 Å in the A and B chains respectively), and the O3A–Si–O3A angle is smaller than the corresponding O3B–Si–O3B (Fig. 3b).
Local structure
Larger ADPs are found in P21/c pigeonite with respect to Ca-free clino and orthopyroxenes (Ohashi et al., Reference Ohashi, Burnham and Finger1975, Ohashi and Finger, Reference Ohashi and Finger1976, Tribaudino et al., Reference Tribaudino, Pasqual, Molin and Secco2003). The large displacement parameters are related to the local deformation inherent in the substitution of Ca for a smaller cation, which promotes a local configuration for Ca sites. A split configuration for the M2 cations and some oxygen has been refined in P21/c pyroxenes Ca0.15Mg1.85Si2O6 and Ca0.23Mg1.77Si2O6 (Tribaudino and Nestola, Reference Tribaudino and Nestola2002).
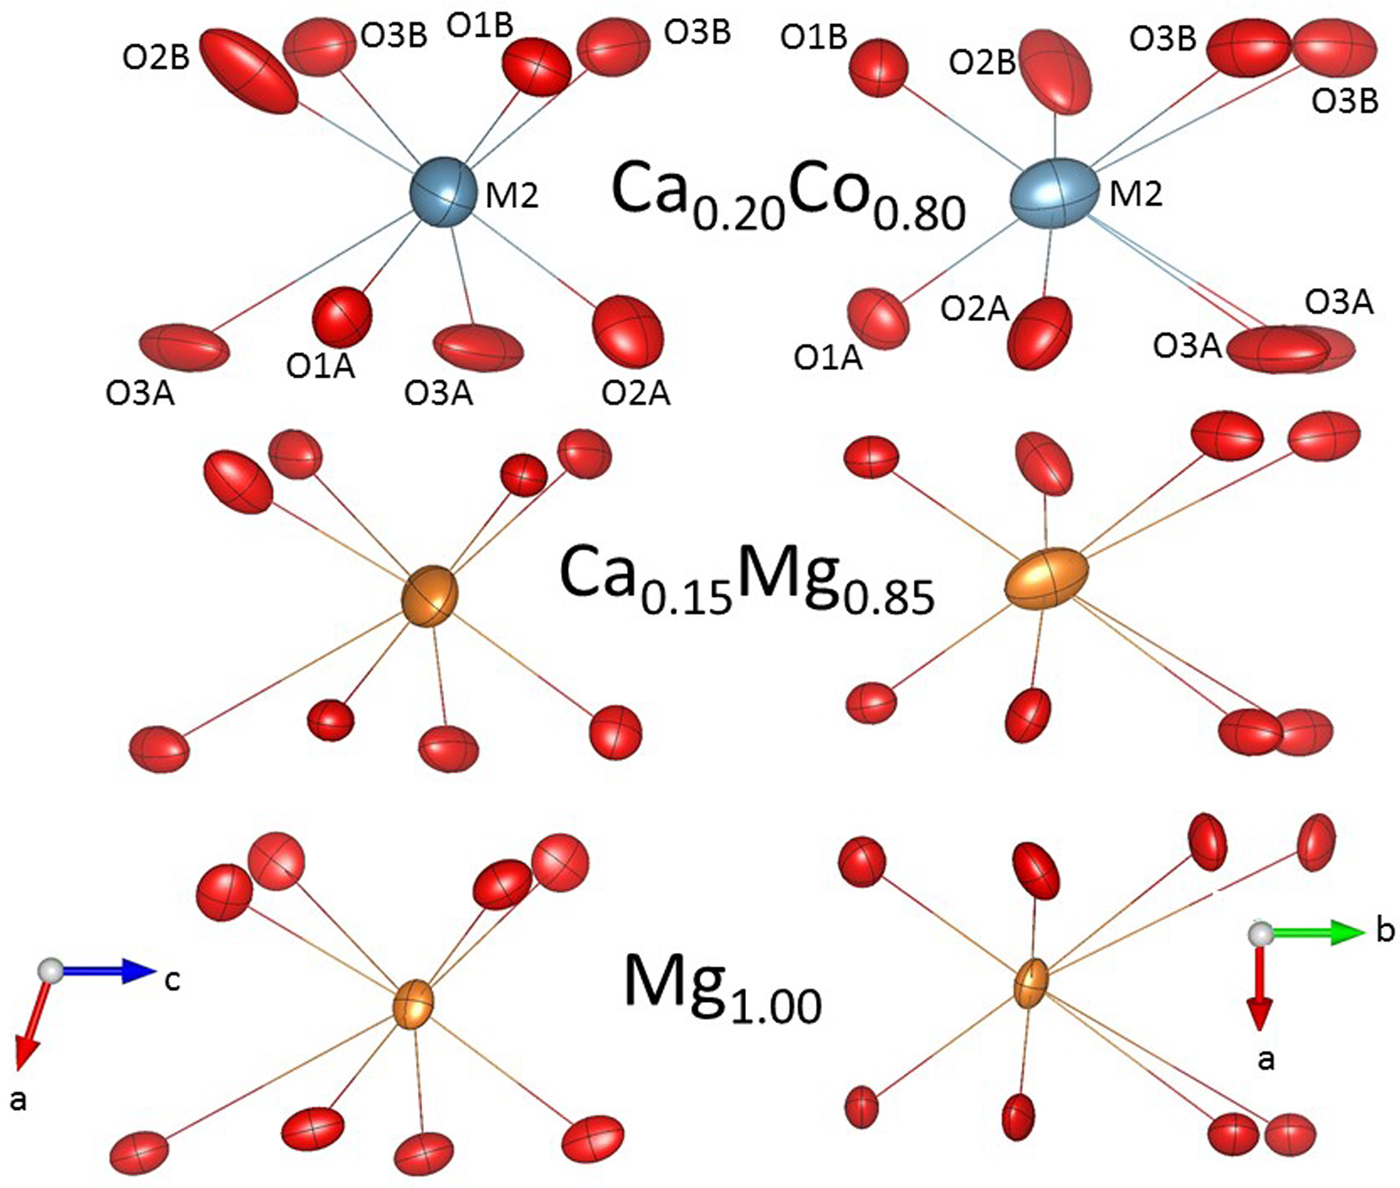
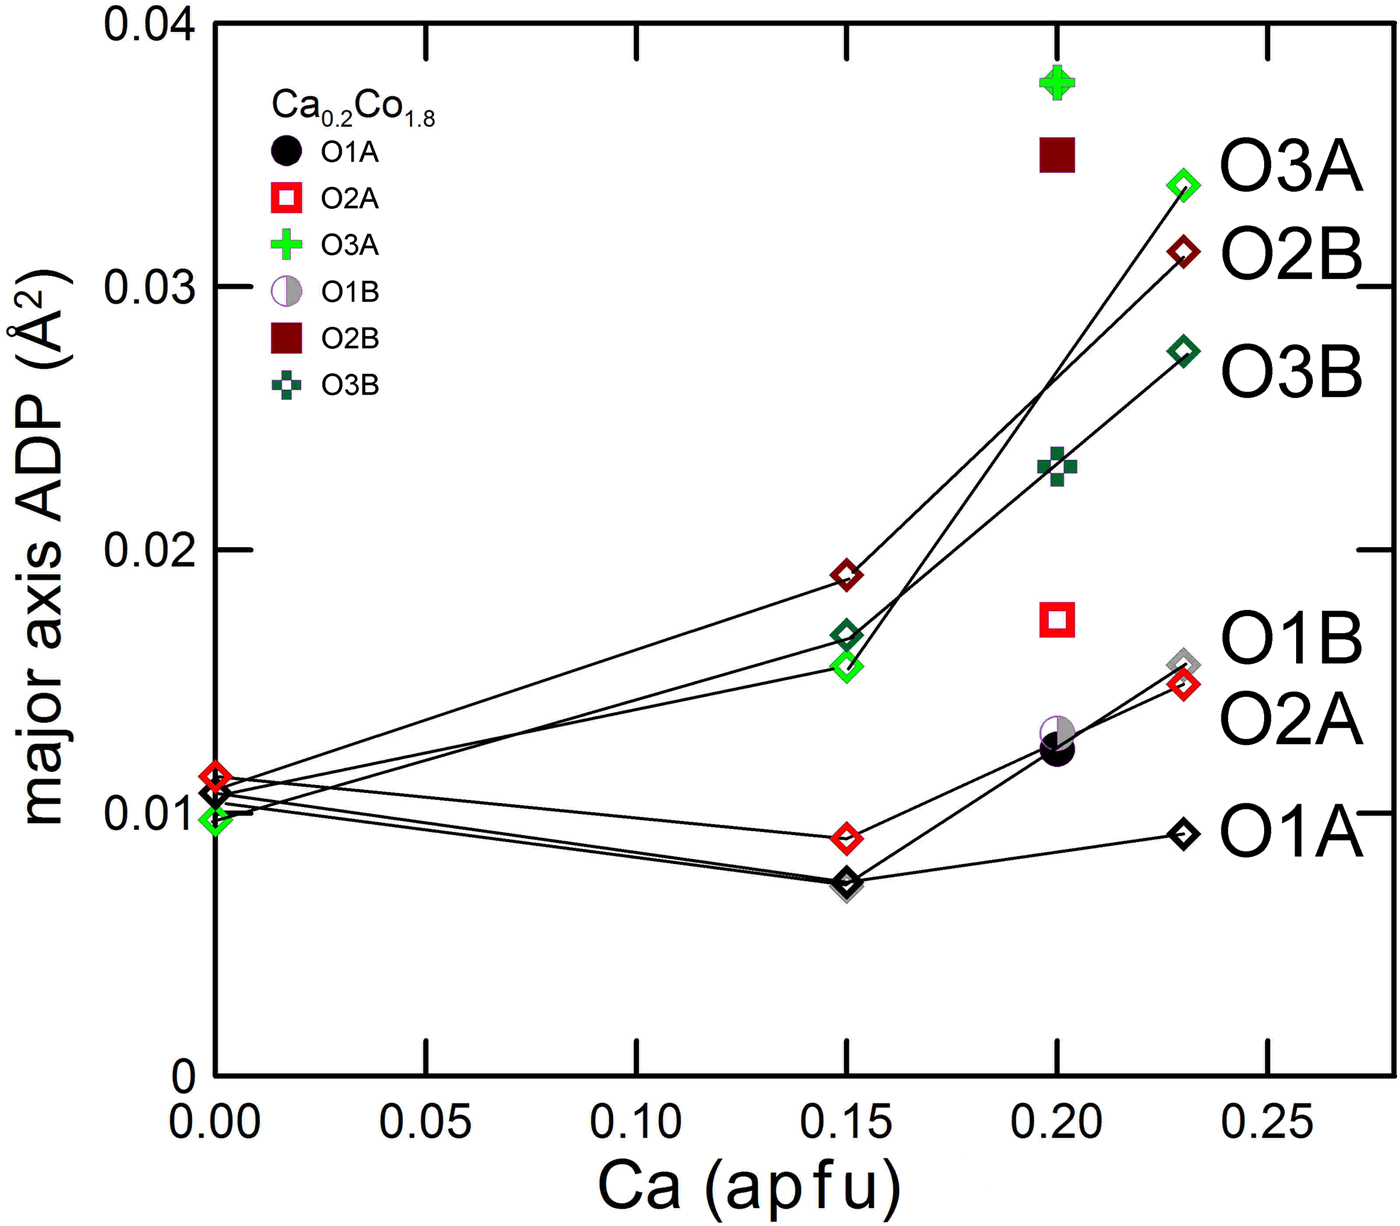
In Ca0.2Co1.8Si2O6 a split refinement failed to find consistent minima for the split configuration, with unrealistic short Ca–O 1.9 Å bond distances. We interpret this as the result of lower crystal quality, which biased the resolution, but also for the higher scattering power of Co than Mg, which masks the scattering contribution of Ca. However, there is evidence of local configurations in the Co pyroxene, comparing the size and orientation of the displacement parameters with those in clinoenstatite and in Ca0.15Mg1.85Si2O6 (Fig. 4 and Table 4). The size of the displacement parameters is larger in the Ca–Co pyroxene, but the orientation of the ADPs in Ca–Co pyroxene is similar to that of the Ca bearing Ca0.15Mg1.85Si2O6, and different to clinoenstatite. In Ca bearing P21/c pyroxenes the orientation of the M2 and O3 ADPs is almost parallel to the diad axis (i.e. normal to the c axis projection), whereas that of the O2B is along the M2–O2 bond. In clinoenstatite the orientation of the oxygen ADPs is normal to the M2–O bonding, and the longer axes of the ADPs of the M2 lie in the (010) plane.
Displacement parameters in Ca0.20Co1.80Si2O6, Ca0.15Mg1.85Si2O6 and Mg2Si2O6 P21/c pyroxenes (this work; Tribaudino et al., Reference Tribaudino, Nestola, Cámara and Domeneghetti2002; and Pannhorst, Reference Pannhorst1984).

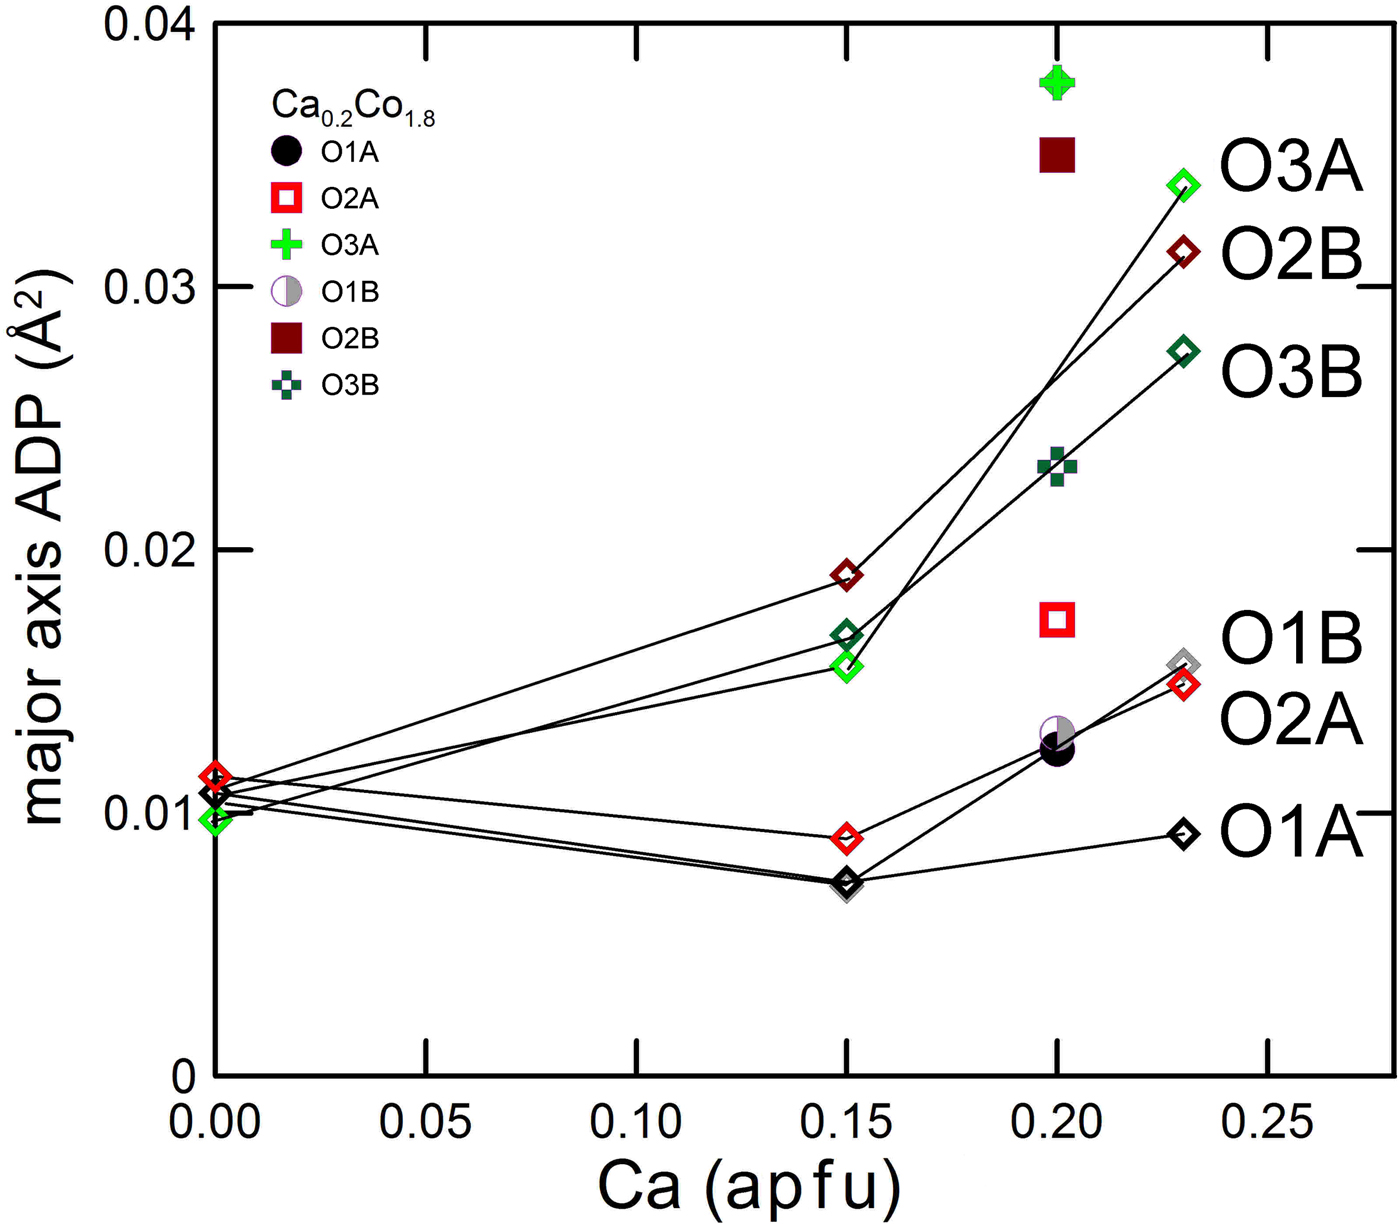
In Fig 5 we show the size of the major axis of the displacement parameters of oxygen as a function of Ca content. In clinoenstatite the oxygen atoms all have the same length, which may be interpreted as solely due to thermal vibration. With increasing departure from the end-member the displacement ellipsoid of oxygen becomes larger, and to an extent different for the different oxygen atoms. The O2B, O3A and O3B show a larger increase with Ca content. A split configuration for these oxygen atoms is then suggested. For the O3 oxygen the larger ADPs are related to the coexistence of Ca rich and Ca poor local environments, as O3 is most involved in the transformation from Ca-rich and Ca-poor pyroxenes. The local Ca environment has a tendency to retain the C2/c local symmetry, and it is not surprising that the O3 oxygen show the highest local disorder. O2 is an under-bonded oxygen in pyroxenes (Cameron and Papike, Reference Cameron and Papike1981), and also shows, with Ca substitution, higher displacement throughout the C2/c series (Ohashi et al., Reference Ohashi, Burnham and Finger1975; Mantovani et al., Reference Mantovani, Tribaudino, Mezzadri, Calestani and Bromiley2013). Among the O2A and B sites, it is O2B is which shows a higher change in bond distances across the transition.
Major axis of the atomic displacement parameter ellipsoid for oxygen in Ca–Mg pyroxenes (open diamonds) and in Ca0.2Co1.8Si2O6. The three oxygen atoms with higher displacement are in the order O3A, O2B and O3B, in Ca0.2Co1.8Si2O6 and Ca0.23Mg1.77Si2O6.
Discussion
Structural changes in natural and synthetic pigeonite: the role of the ionic radius
The exchange of Mg, Co and Fe for Ca in the M2 site of quadrilateral and Co pyroxenes shares several common features: (1) there is a P21/c– C2/c phase transition driven by differential kinking of the tetrahedral chains, ascribed to the decreasing size of the M2 cation; (2) in the C2/c symmetry the cell volume is mostly dependent on the size of the M2 cation, whereas at the transition an excess negative volume is found (Mantovani et al., Reference Mantovani, Tribaudino, Bertoni, Salviati and Bromiley2014); (3) the volume of the M1 polyhedron, which is occupied only by Co, Mg and Fe, is almost unchanged with Ca content; and (4) there are other minor common structural features: a decreased difference between the tetrahedral distances, a split in the M2 polyhedron in M2 and M2’ two subsites and a very similar cell deformation (Ohashi et al., Reference Ohashi, Burnham and Finger1975; Tribaudino et al., Reference Tribaudino, Benna and Bruno1989; Mantovani et al., Reference Mantovani, Tribaudino, Mezzadri, Calestani and Bromiley2013, Reference Mantovani, Tribaudino, Bertoni, Salviati and Bromiley2014).
These changes are related to variation of the cation radius in a polyhedron where the M2–O bonding is mostly ionic in character (Cameron et al., Reference Cameron, Sueno, Prewitt and Papike1973; Cameron and Papike, Reference Cameron and Papike1981).
In Zn pyroxenes along the CaZnSi2O6–Zn2Si2O6 series the above listed changes do not occur, regardless of the very similar cation size of Zn and Co: the C2/c –P21/c transition is not observed, the cell volume does not depend on the M2 cation size and the M1 polyhedral volume changes significantly with composition. Only the M2–M2’ split is found, but Zn lies in a position different to that occupied by Fe, Mg and Co. This is a consequence of the preference of Zn in the M2 site for covalent bonding, in contrast to the largely ionic behaviour of Mg, Fe and Co in the M2 site (Gori et al., Reference Gori, Tribaudino, Mantovani, Delmonte, Mezzadri, Gilioli and Calestani2015).
The above observations can be extended to the analysis of natural pigeonites. The main problem in the application of the results of synthetic samples to natural ones is the poor constraint that we have on chemical composition, due to extended solid solutions. In natural pigeonite a mixed occupancy in the M2 and M1 sites is found, with an M2 site filled by Ca, Na, Mg, Fe and Mn, and the M1 by Mg, Fe, Ti, Al and Cr (Pasqual et al., Reference Pasqual, Molin and Tribaudino2000).
To cope with the problem of mixed occupancy we compared crystals with different compositions by calculating the average ionic radius in the M2 site. The M2 polyhedron is rather flexible, and it can deform to host a cation in eight-fold or six-fold coordination, depending on the ionic radius. As discussed by Downs (Reference Downs2003), when the M2 site is occupied by Ca, its coordination is eight-fold, but it becomes six-fold coordinated if Mg, Fe or Co are present. In the eight-fold coordination the M2 cation lies along the diad axis, in the C2/c symmetry, whereas in the six-fold it is off the axis, prompting for a P21/c symmetry. Downs (Reference Downs2003) showed that this off-the-axis transformation reduces M2–Si repulsion. In natural or synthetic pyroxenes with mixed M2 occupancy, the exchange of a smaller for a larger cation switches the M2 cation to a six-fold coordination, which is not supported by a C-centred lattice. The transition to the P21/c structure was pinpointed at an M2 cation radius between 0.86 and 0.89 Å (Arlt and Angel, Reference Arlt and Angel2000; Alvaro et al., Reference Alvaro, Nestola, Boffa Ballaran, Cámara, Domeneghetti and Tazzoli2010; Mantovani et al., Reference Mantovani, Tribaudino, Bertoni, Salviati and Bromiley2014).
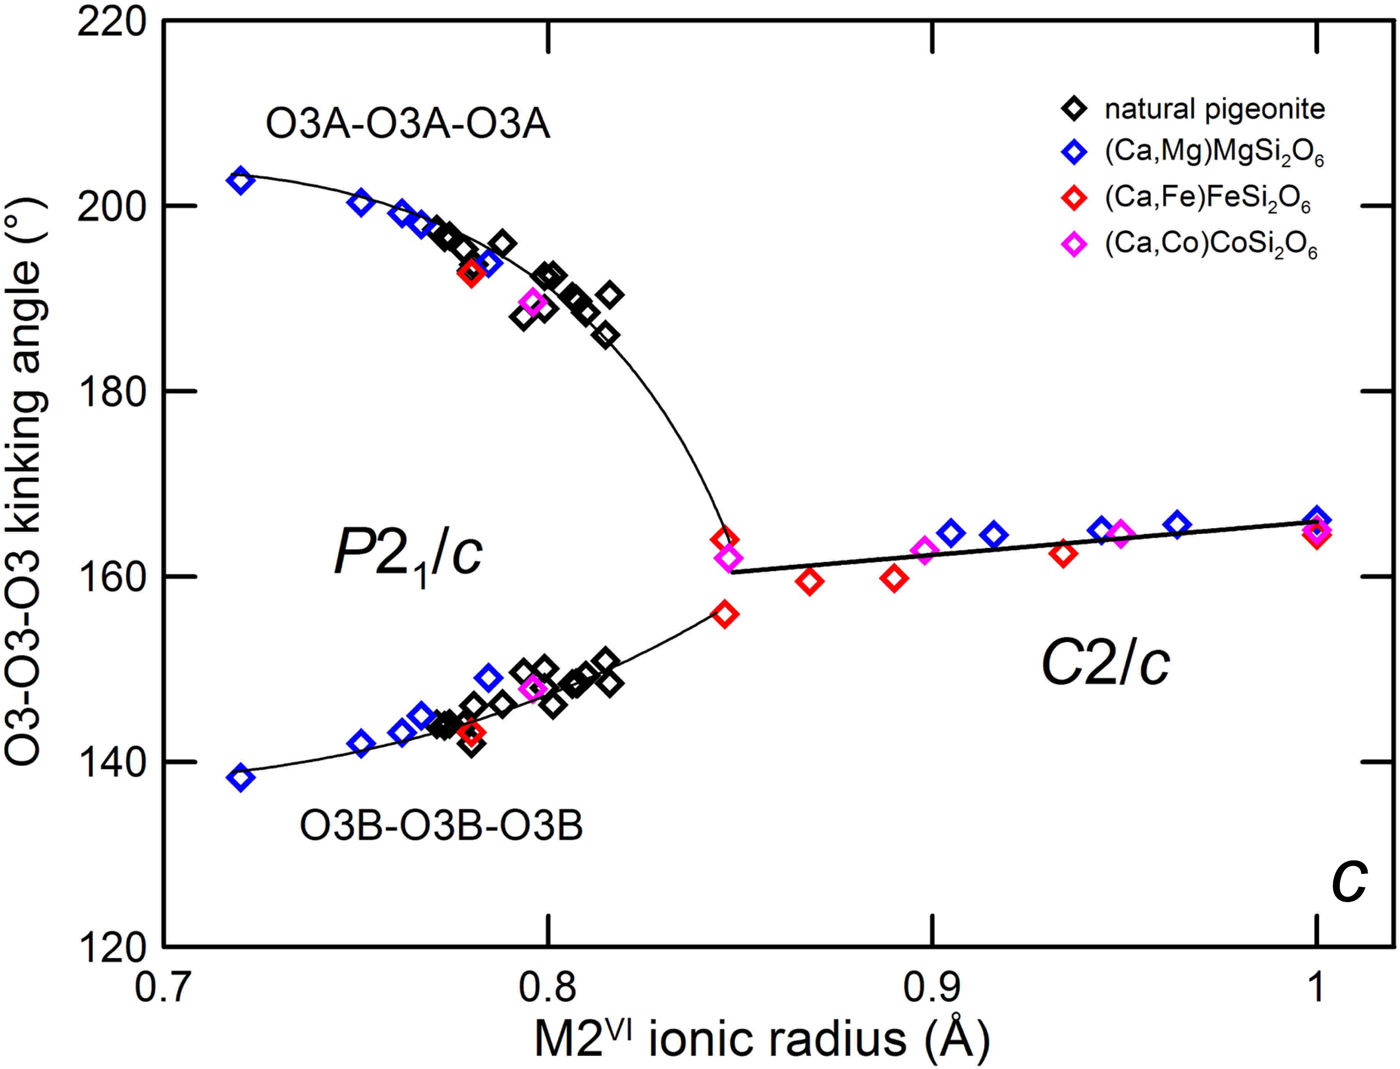
A selection of refinements on natural pigeonite was used to discuss the relations between natural and synthetic pyroxenes, discarding those where exsolved augite coexists with the pigeonite (e.g. sample BTS302 in Tribaudino et al., Reference Tribaudino, Pasqual, Molin and Secco2003). For this purpose, the two newly refined ureilitic pyroxenes were added to the database of natural pigeonite. The average M2 cation radius was calculated from the published site occupancies, and related to the O3–O3–O3 kinking angle (Fig. 6). The kinking angle is most unaffected by the M1 polyhedron as the O3 atoms are only linked to the M2 site and to the tetrahedral chain.
O3–O3–O3 kinking angle of synthetic Ca–Mg, Ca–Fe and Ca–Co pyroxenes and natural pigeonites vs. average M2 ionic radius. Data from: Ca–Mg: Ohashi and Finger (Reference Ohashi and Finger1976), Bruno et al. (Reference Bruno, Carbonin and Molin1982), Tribaudino et al. (Reference Tribaudino, Benna and Bruno1989), Tribaudino and Nestola (Reference Tribaudino and Nestola2002) and Tribaudino et al. (Reference Tribaudino, Mantovani, Bersani and Lottici2012); Ca–Fe: Burnham (Reference Burnham1967) and Ohashi et al. (Reference Ohashi, Burnham and Finger1975); Ca–Co: Mantovani et al. (Reference Mantovani, Tribaudino, Mezzadri, Calestani and Bromiley2013) and this work; natural pigeonite: Morimoto and Güven (Reference Morimoto and Güven1970), Clark et al.. (Reference Clark, Ross and Appleman1971), Takeda (Reference Takeda1972), Brown et al. (Reference Brown, Prewitt, Papike and Sueno1972), Ohashi and Finger (Reference Ohashi and Finger1973), Belokoneva et al. (Reference Belokoneva, Khisina, Petushkova and Belov1981), Pasqual et al. (Reference Pasqual, Molin and Tribaudino2000), Cámara et al. (Reference Cámara, Carpenter, Domeneghetti and Tazzoli2003) (also disordered pyroxenes), Tribaudino (Reference Tribaudino2006) and Frey et al. (Reference Frey, Weidner, Pedersen, Boysen, Burghammer and Hoelzel2010).
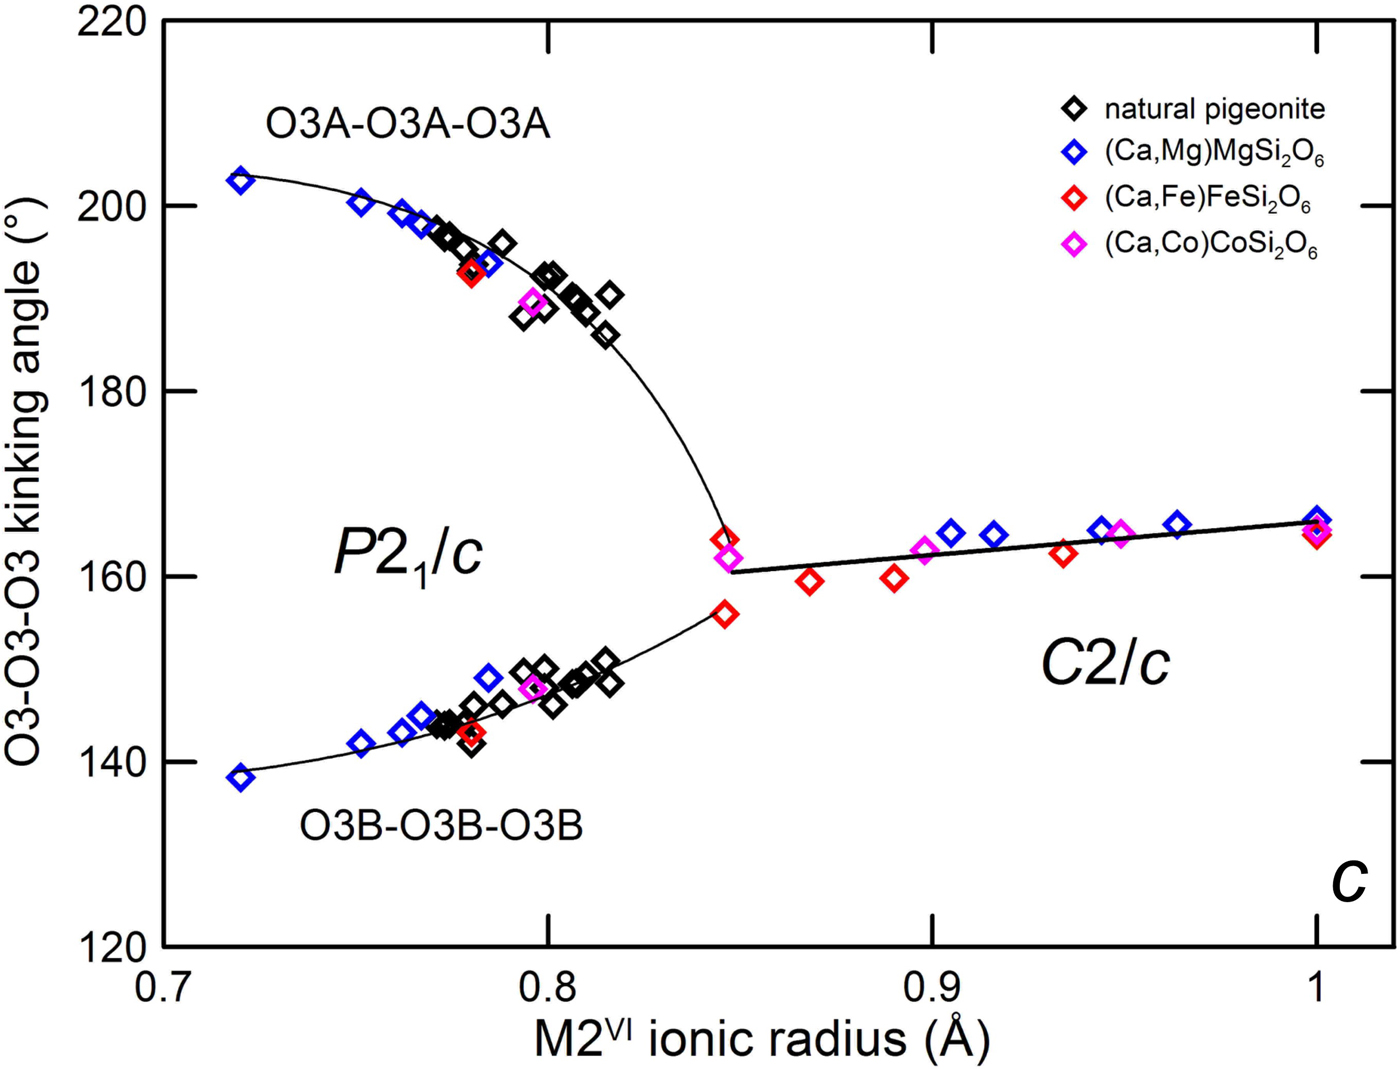
From the O3–O3–O3 kinking angle an indication of a transition at ~0.85 Å is apparent. The transition can be well determined by crystal structure analysis of homogeneous crystals in Ca–Co and Ca–Fe at ~0.85 Å (Ohashi et al., Reference Ohashi, Burnham and Finger1975; Mantovani et al., Reference Mantovani, Tribaudino, Mezzadri, Calestani and Bromiley2013).
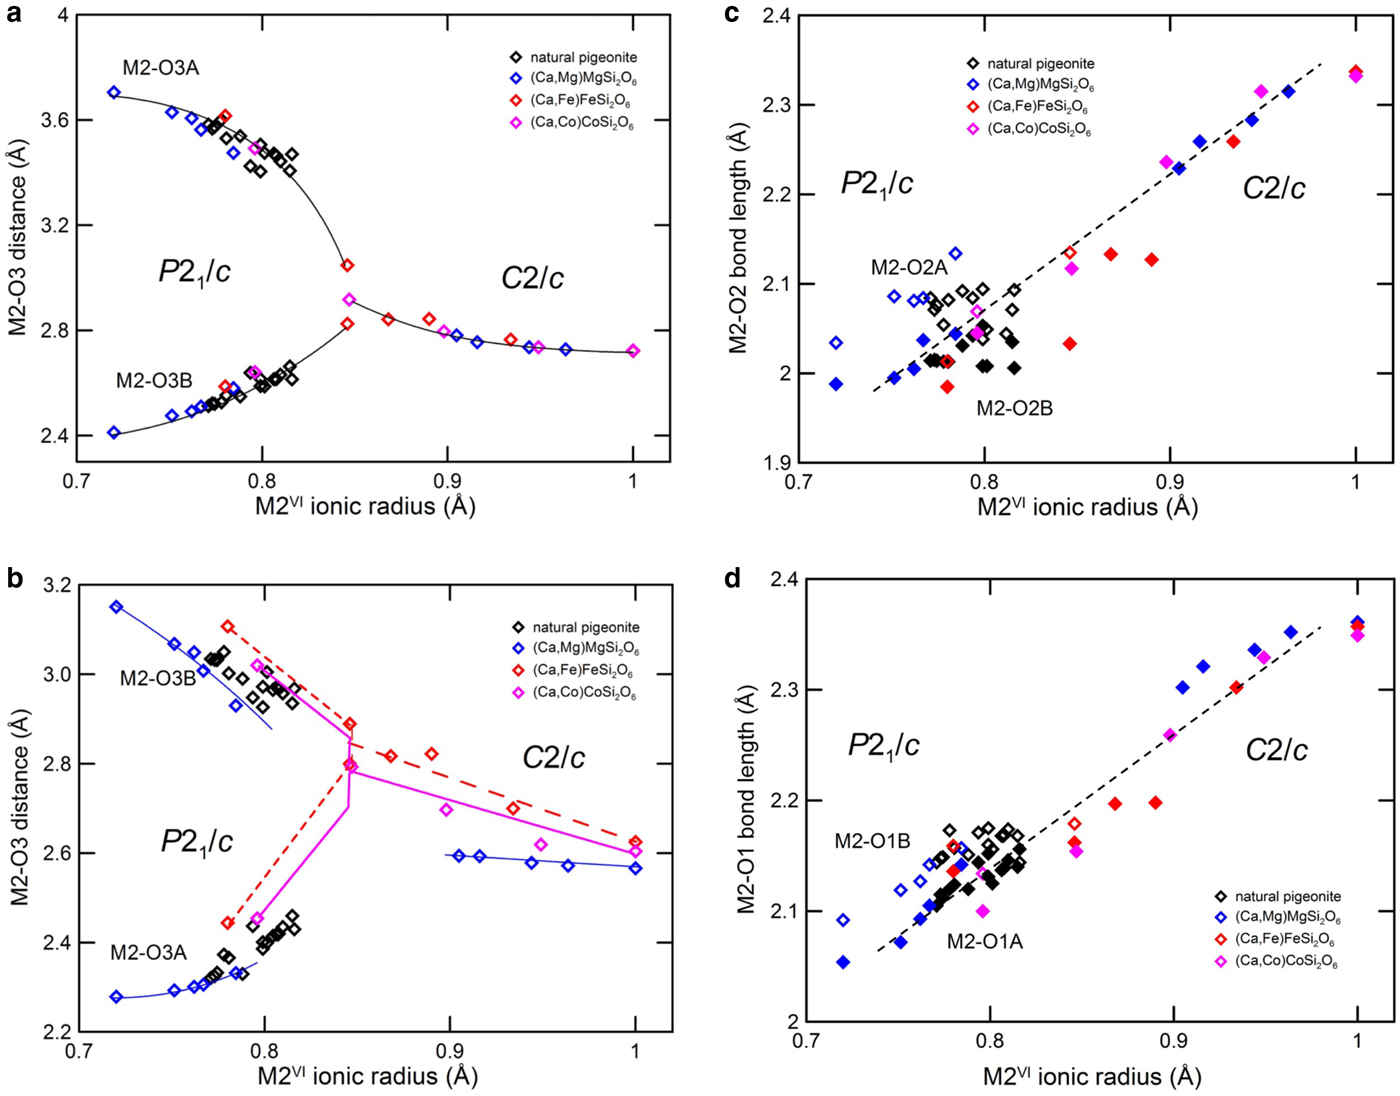
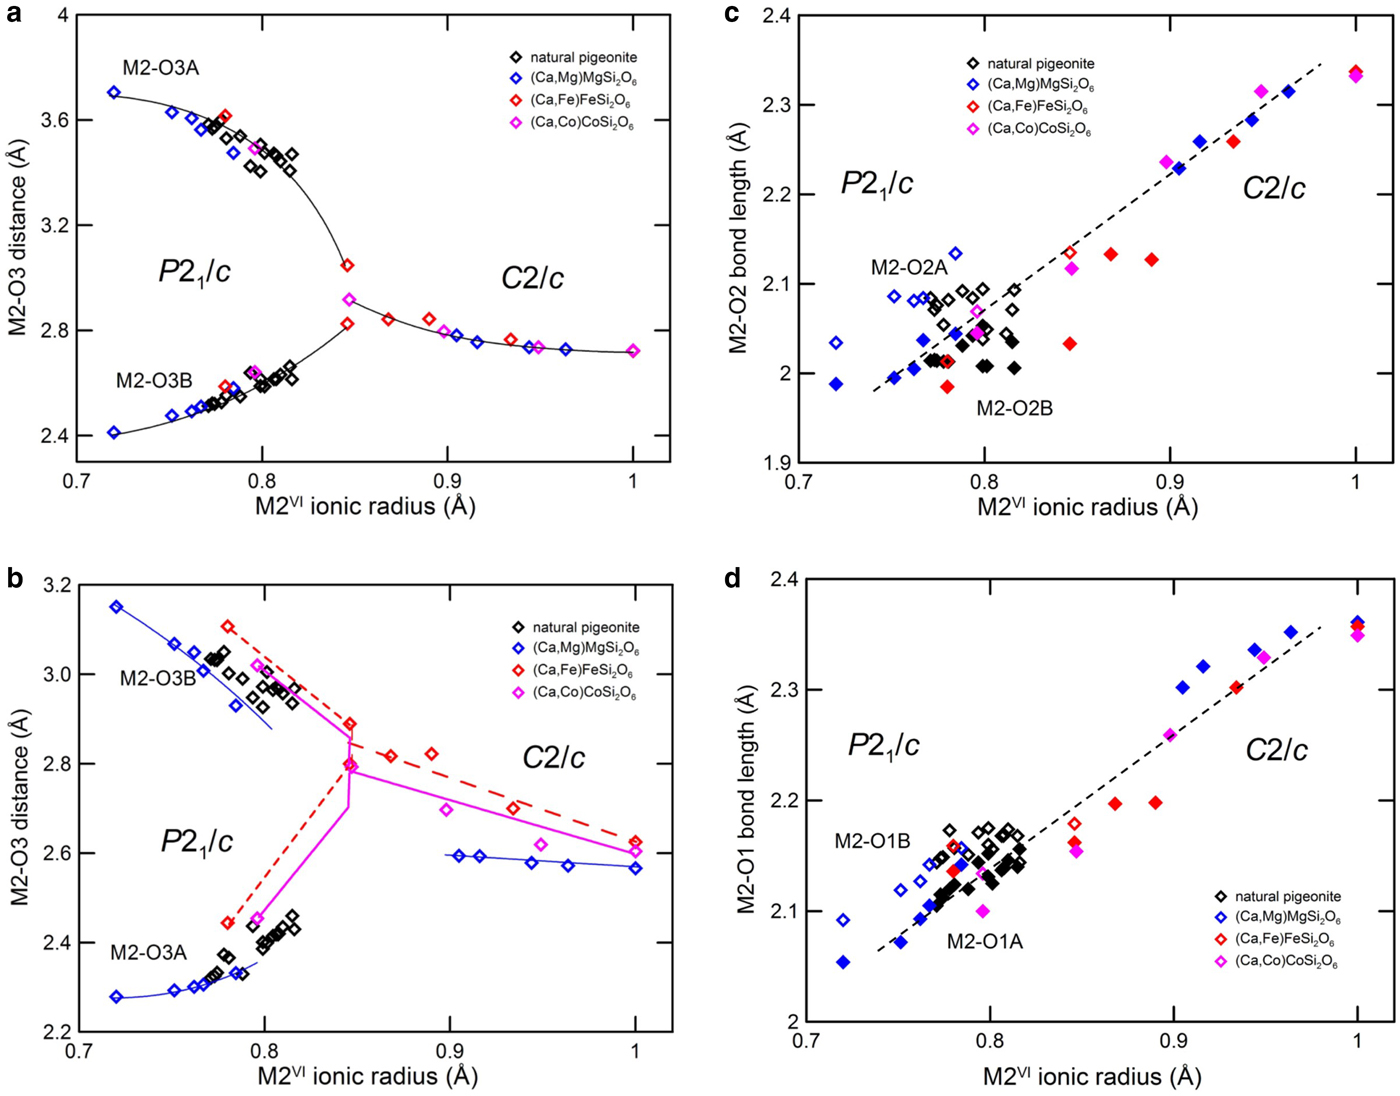
A trend dictated only by the ionic radius of the M2 cation is found also in the other M2–O bond distances, with the exception of the shorter M2–O3 distances, which are affected also by the cation in the M1 site (Fig. 7).
M2–O3. (a) Longer and (b) shorter distance, (c) M2–O2, (d) M2–O1 bond distance of synthetic Ca–Mg, Ca–Fe and Ca–Co pyroxenes and of natural pigeonites vs. average M2 ionic radius. Data as in Fig. 6.
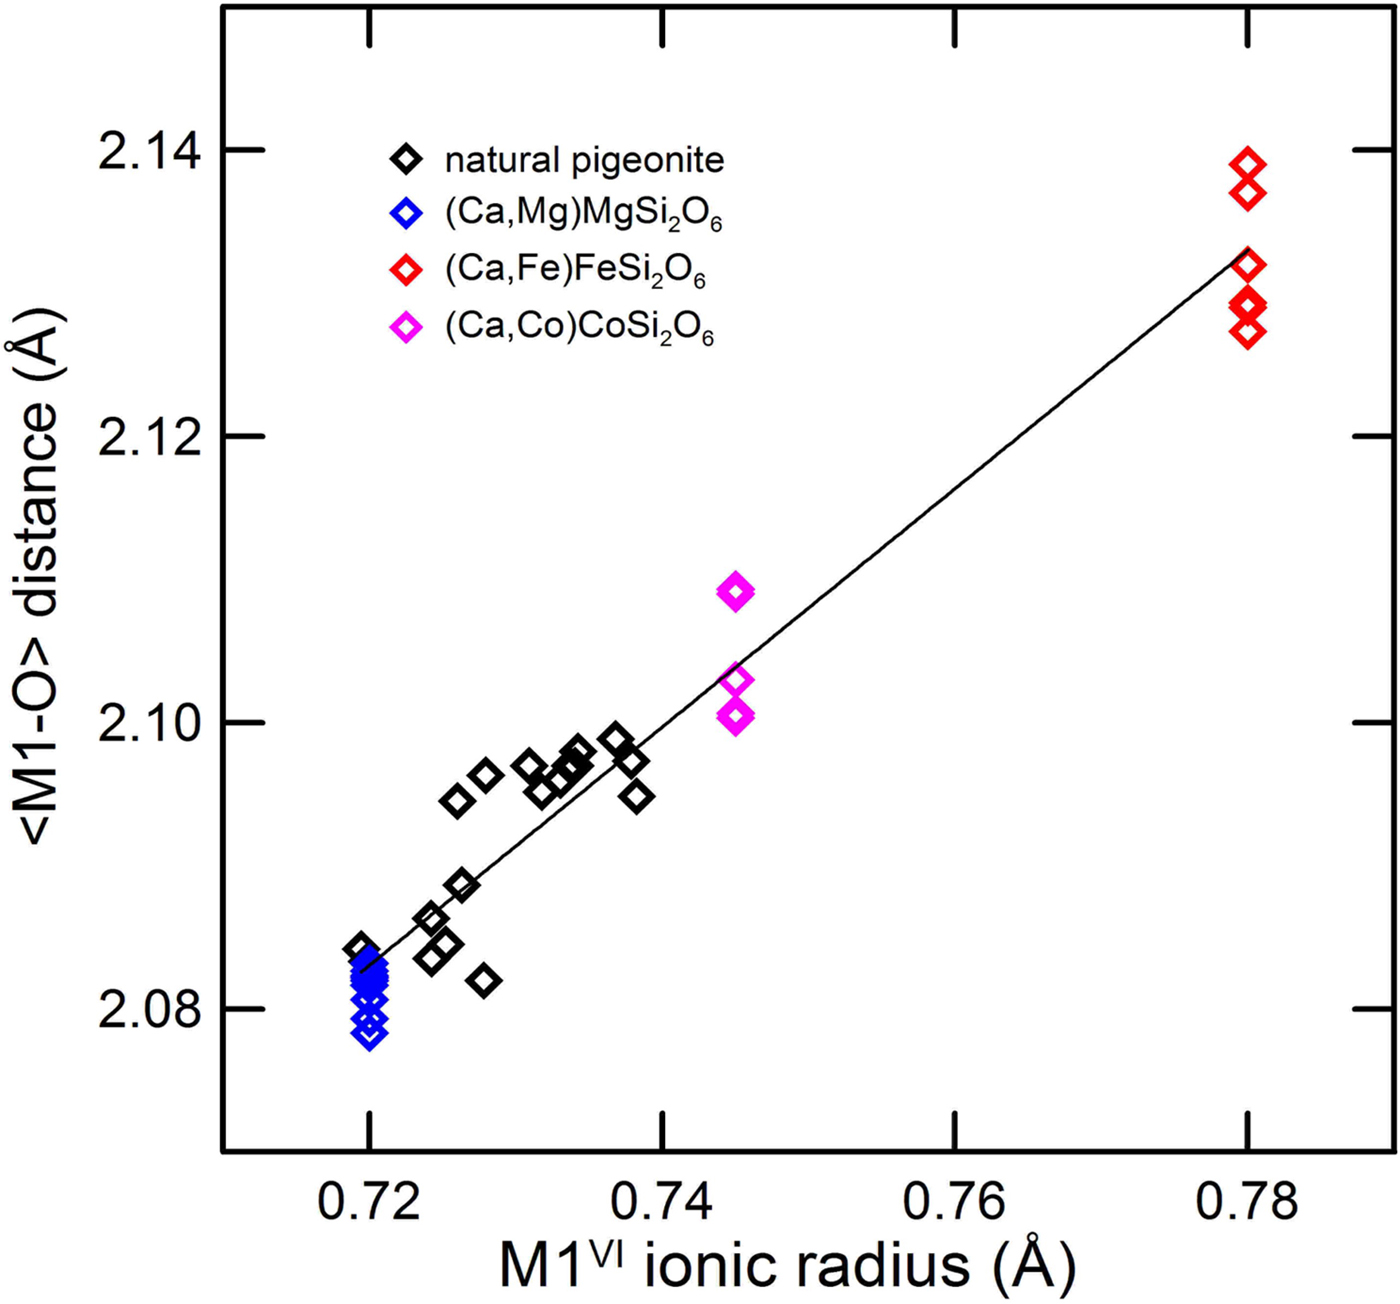
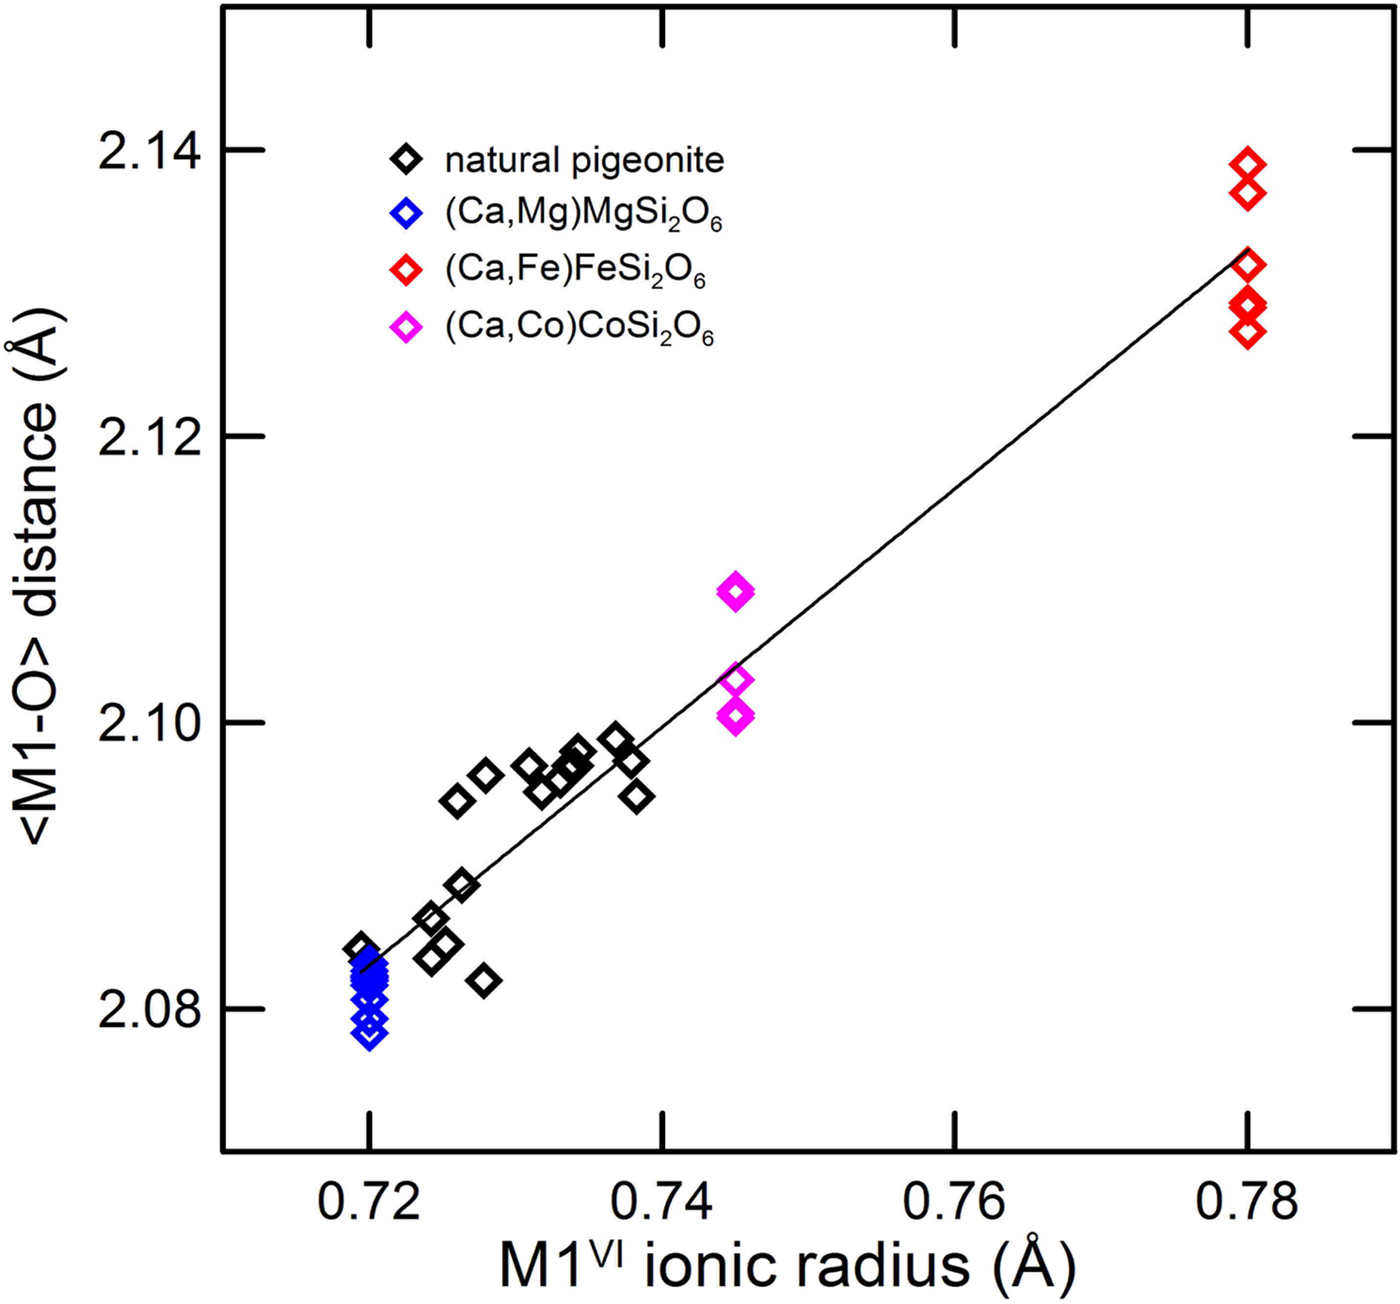
In the M1 polyhedron the average ionic radius of the M1 site and the M1–O average distances are linearly related (Fig. 8). Differences in the M1–O average bond lengths due to the different cation substitutions in the M2 site are present, as a steric effect (Ghose et al., Reference Ghose, Wan and Okamura1987), but are trivial with respect to the contribution of the cation size.
Average M1–O bond distance of synthetic Ca–Mg, Ca–Fe and Ca–Co pyroxenes and natural pigeonites vs. average M2 ionic radius. Data as in Fig. 6.
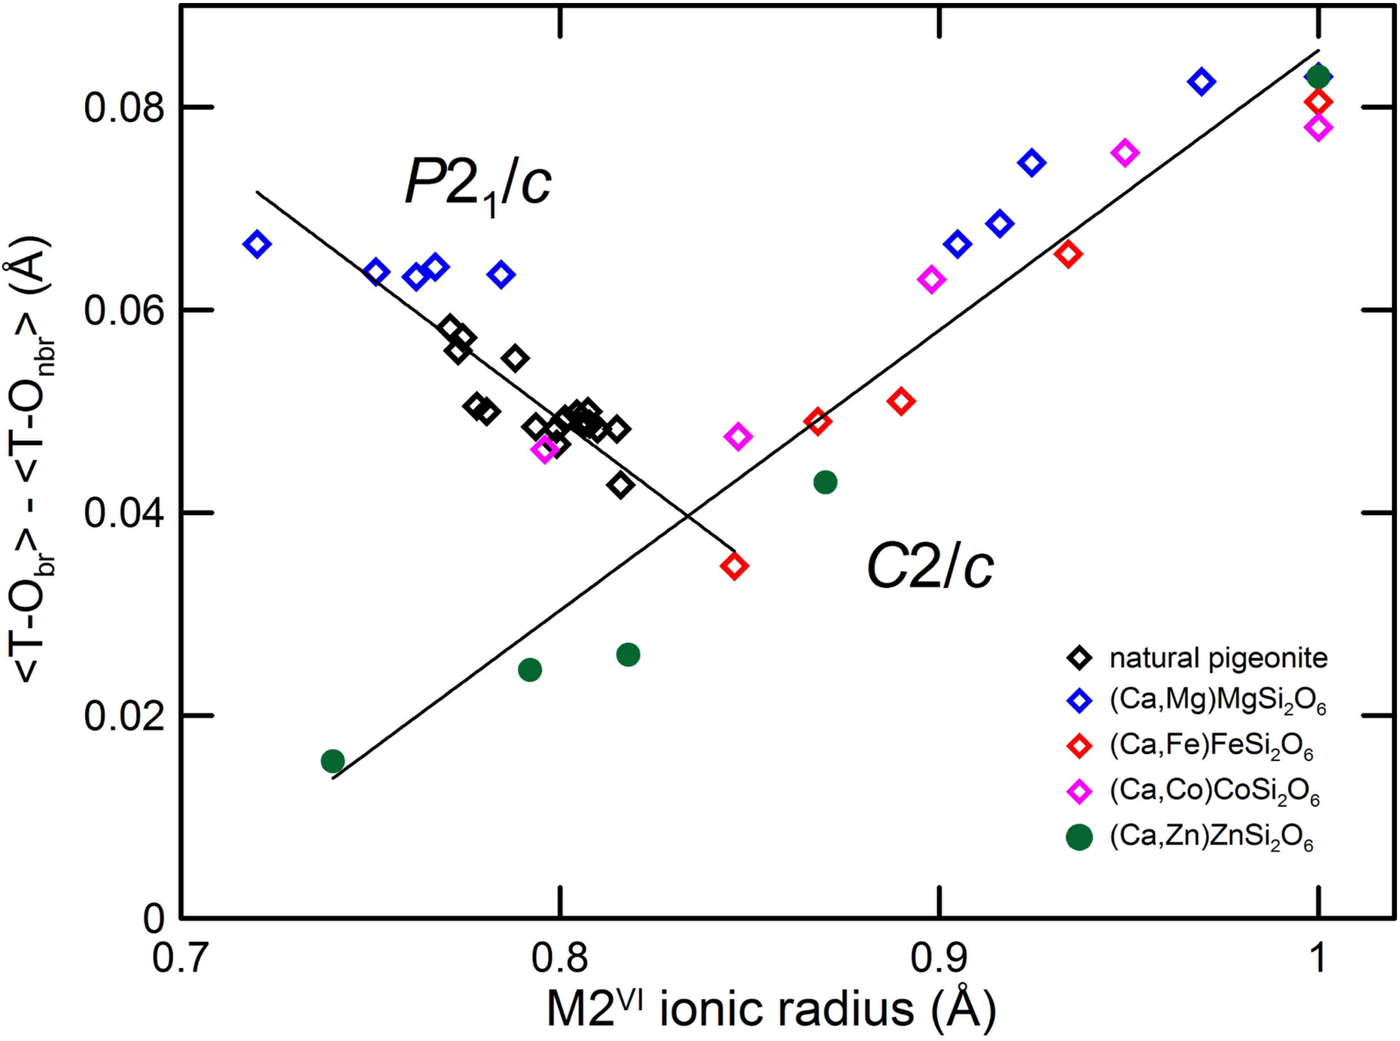
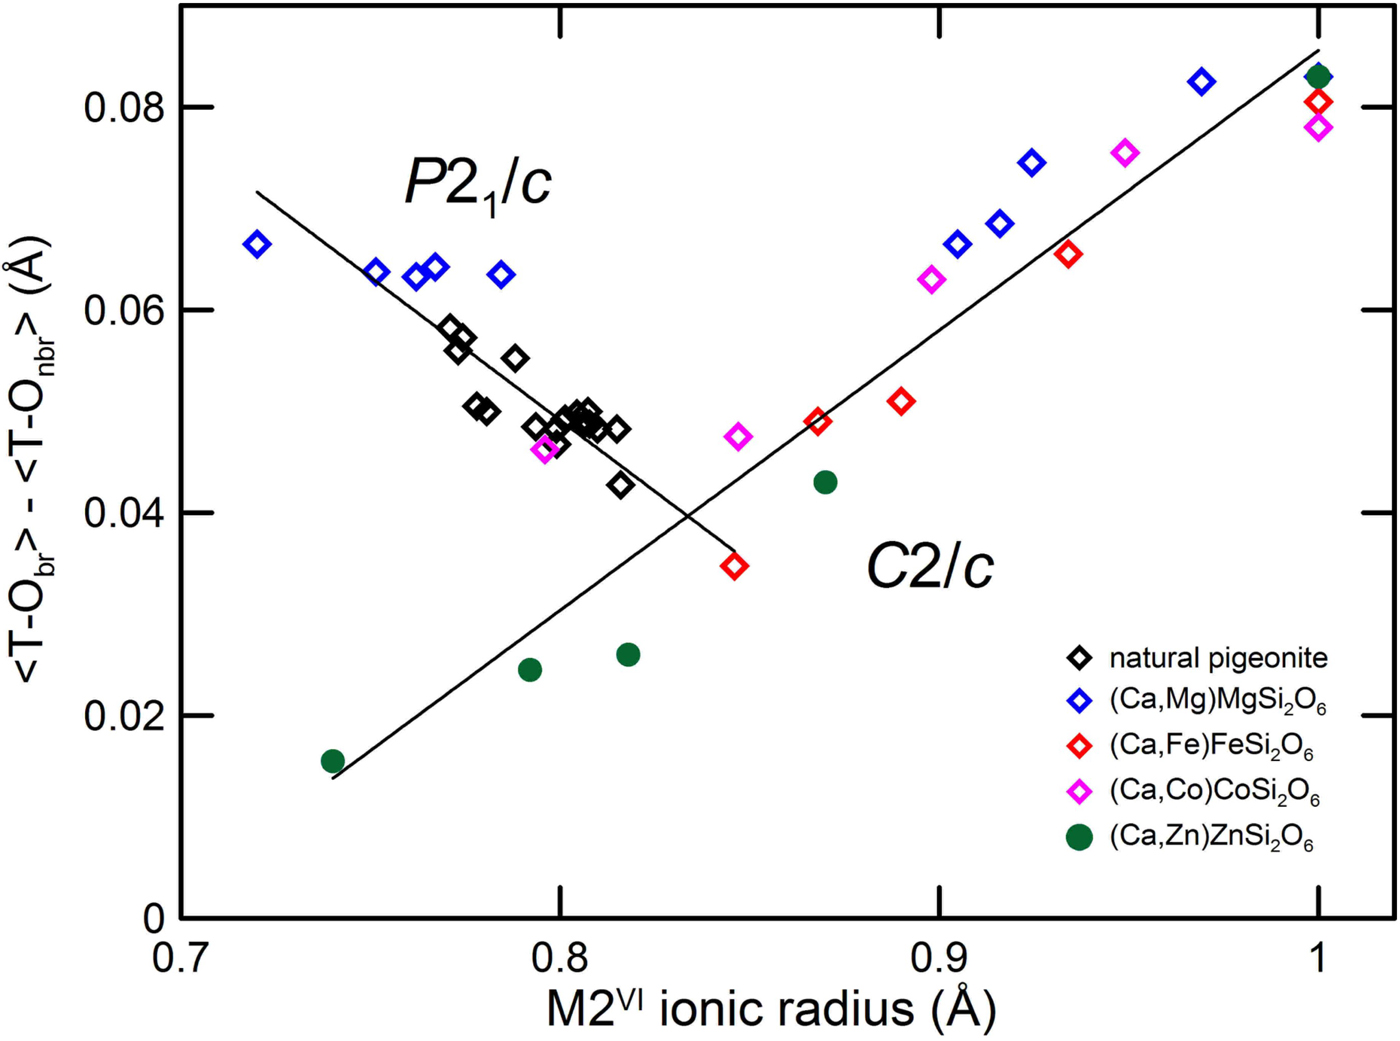
In contrast, the tetrahedral distances show a marked effect with the transition. In the C2/c pyroxenes the difference between the T–O3 bridging and non-bridging T–O1, T–O2 distances shows a linear decrease with the M2 ionic radius. As the difference between <T–Obr> and <T–Onbr> oxygen decreases to the value of 0.03 Å, a turnover is observed, with the transition to the P21/c symmetry. In the P21/c symmetry, the difference between the four bridging and non-bridging distances increases. The C2/c trend is instead observed in Ca-poor Zn-pyroxenes, where the phase transition is not observed (Fig. 9).
Difference between average bond length T–O bridging and non-bridging of synthetic Ca–Mg, Ca–Fe, Ca–Co and Ca–Zn pyroxenes and natural pigeonites vs. average M2 ionic radius. Data as in Fig. 6 including Gori et al. (Reference Gori, Tribaudino, Mantovani, Delmonte, Mezzadri, Gilioli and Calestani2015) for Ca–Zn pyroxenes.
The P21/c–C2/c phase transition with composition, temperature and pressure
In the previous paragraph we showed that in synthetic and natural pigeonite the kinking O3–O3–O3 angle is related to the ionic radius of different chemical species occupying the M2 site, with little inference on what is present in the M1 site (Fig. 6). As the opposite kinking of the tetrahedral chains is the driving force for the phase transition to the P21/c structure (Alvaro et al., Reference Alvaro, Nestola, Boffa Ballaran, Cámara, Domeneghetti and Tazzoli2010) we may take the difference in the kinking angle between the two symmetry independent chains in the P21/c structure as an order parameter of the phase transition. This is comparable to the well-known tilting behaviour in perovskites, which display Φ octahedral angle tilting as an order parameter (Lufaso and Woodward, Reference Lufaso and Woodward2004).
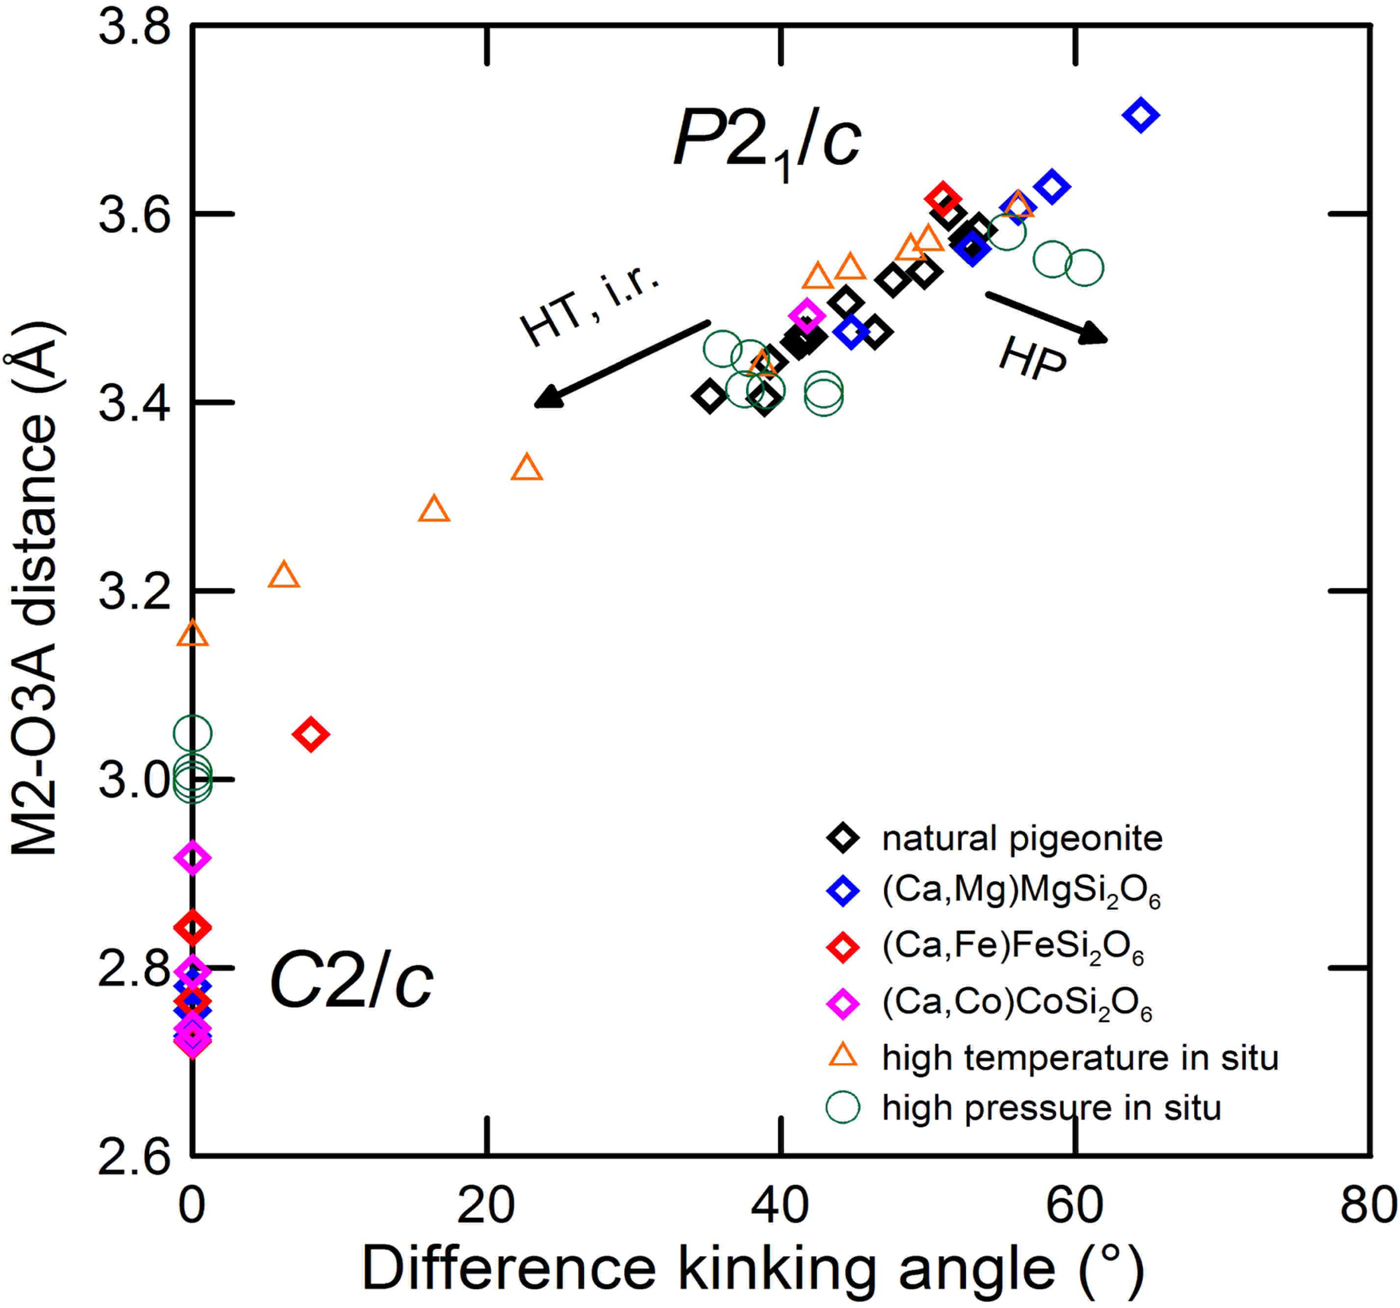
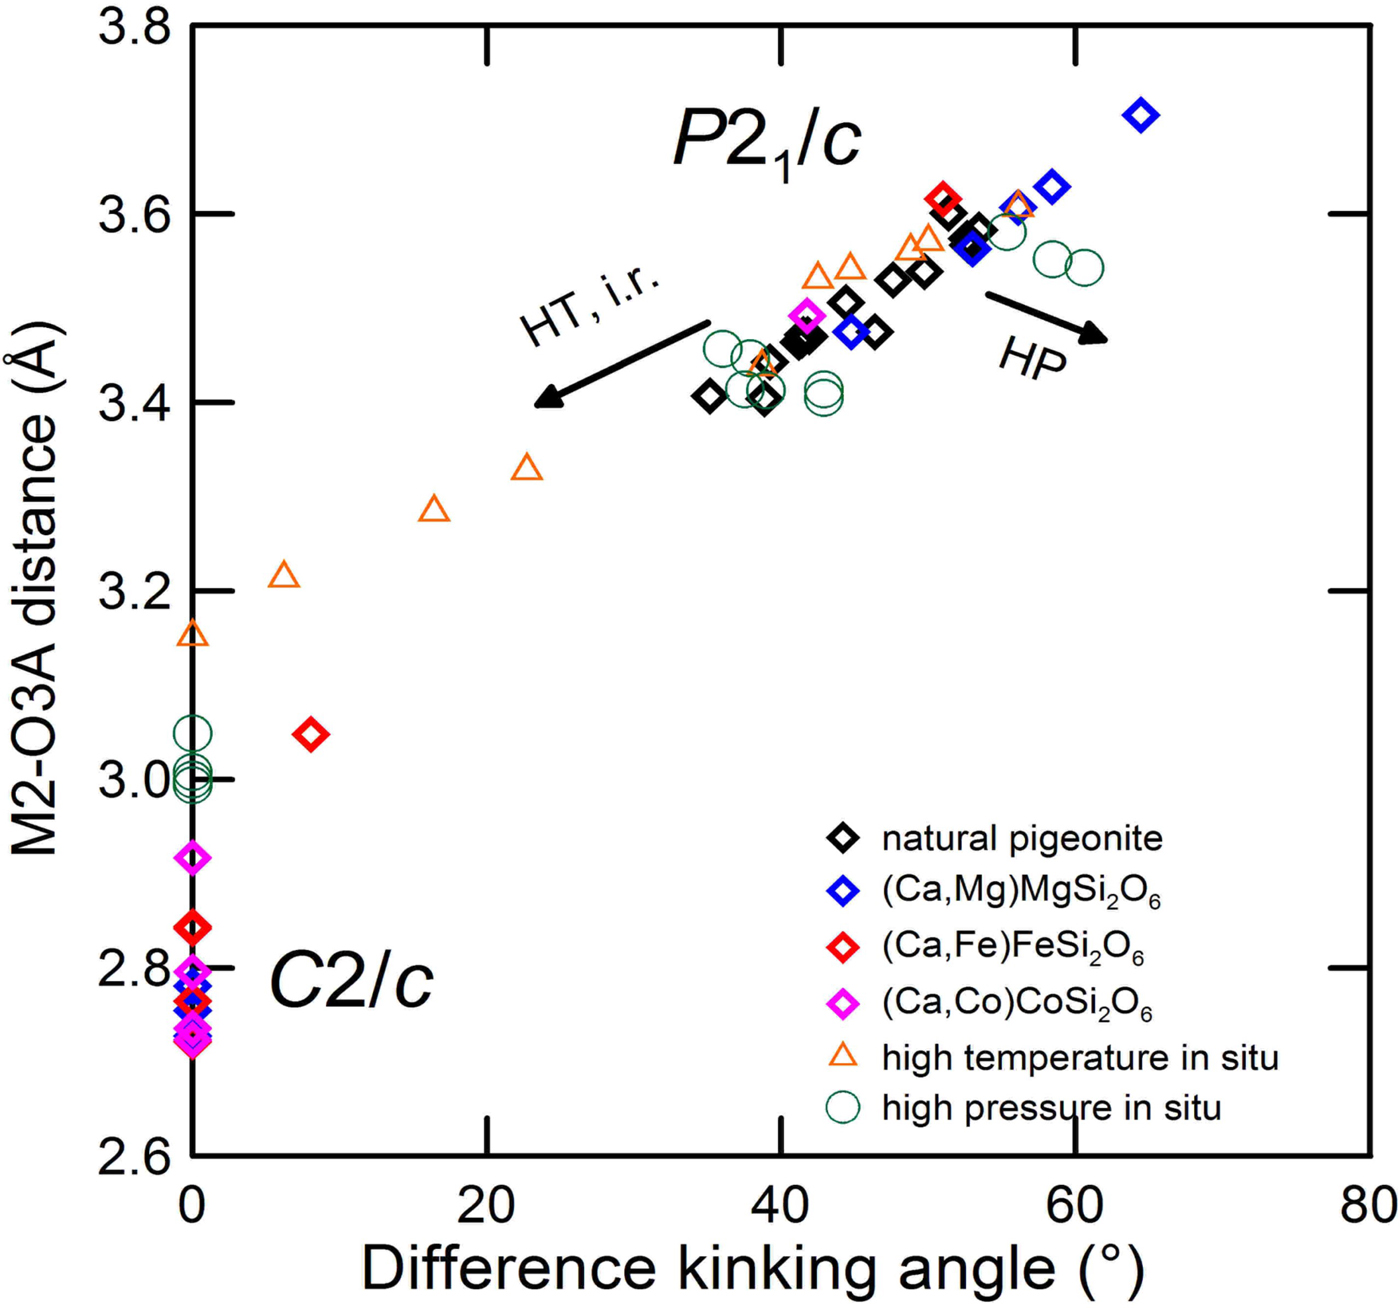
The difference O3–O3–O3 kinking angle probes the transition irrespective of the physical process driving the structural change: the mechanism is the same, i.e. a change in the kinking angles and a rearrangement of the tetrahedral chains, regardless of whether we consider increasing temperature, decreasing pressure or increasing ionic radius. However, approaching the transition the difference in kinking angles increases with pressure and decreases with temperature: as shown in Fig. 7 the pre-transition behaviour of the tetrahedral chains in the P21/c phase at high pressure is opposite to that at high temperature. Also, the intensity of the h+k = odd reflections, present in the P21/c but not in the C2/c symmetry, increases with pressure, i.e. approaching the phase transition (Nestola et al., Reference Nestola, Tribaudino and Boffa Ballaran2004; Alvaro et al., Reference Alvaro, Nestola, Boffa Ballaran, Cámara, Domeneghetti and Tazzoli2010).
The different behaviour at high pressure and high temperature is apparent in Fig. 10, where the difference in the O3–O3–O3 kinking angles is plotted vs. the longest M2–O3A distance, which is out of coordination in P21/c pyroxenes. At high-pressure, the difference in tetrahedral chains increases, but the longest bond distance decreases, whereas at high temperature both decrease. Compositional changes follow a path very close to that at high temperature, indicating a similar structural trend between the high temperature and compositional driven transitions.
Longest M2–O3A distance vs. difference in the O3–O3–O3 kinking angles for synthetic pyroxenes, natural pigeonites, at room and high pressure-temperature conditions. Data from: room conditions, see Fig. 5; high pressure: Nestola et al. (Reference Nestola, Tribaudino and Boffa Ballaran2004) and Alvaro et al.. (Reference Alvaro, Nestola, Boffa Ballaran, Cámara, Domeneghetti and Tazzoli2010); high temperature: Tribaudino et al. (Reference Tribaudino, Nestola, Cámara and Domeneghetti2002) and Cámara et al. (Reference Cámara, Carpenter, Domeneghetti and Tazzoli2003).
The P21/c–C2/c phase transition: the role of strain
The related HT and compositional behaviour provides a clue to explain the difference between the single-crystal X-ray observations that the critical ionic radius of the M2 cation for the transition in Ca–Co and Ca–Fe pyroxenes is ~0.85 Å (Ohashi et al., Reference Ohashi, Burnham and Finger1975; Mantovani et al., Reference Mantovani, Tribaudino, Mezzadri, Calestani and Bromiley2013, Reference Mantovani, Tribaudino, Bertoni, Salviati and Bromiley2014), and TEM observations which indicate that the transition occurs at 0.89 Å in Ca–Mg pyroxenes (Tribaudino, Reference Tribaudino2000; Arlt and Angel, 2001; Alvaro, Reference Alvaro, Nestola, Boffa Ballaran, Cámara, Domeneghetti and Tazzoli2010). The difference is surprising, as the structural trend with the O3–O3–O3 and ionic radius is very similar, regardless of whether Ca is exchanged by Fe, Co or Mg (Fig. 6).
Transmission electron microscopy investigations have shown that intermediate Ca–Mg pyroxenes, due to the higher temperature of the solvus, show a mottled texture formed during cooling. The textures are preliminary to spinodal decomposition, and are indicative of local clustering. As an effect, the crystals are highly strained. The effect of this strain was explored by Tribaudino et al. (Reference Tribaudino, Nestola, Cámara and Domeneghetti2002) in a single-crystal investigation of the P21/c–C2/c transition at high temperature in Ca0.15Mg1.85Si2O6. The formation of strain modulations in a formerly homogeneous Ca0.15Mg1.85Si2O6 crystal during heating in an in situ experiment at 1200°C increased the transition temperature by more than 200°C with respect to that in the unstrained crystal. However, it should be noted that the evolution of the unit-cell parameters is almost the same in strained and unstrained samples. In view of the similarity between high-temperature and composition driven transitions, the high-temperature behaviour helps to interpret the compositional transition. The stabilization of the P21/c structure at higher temperature in strained crystals parallels that in the Ca–Mg pyroxenes to higher Ca content at room temperature. As such, the ~0.85 Å value can be considered the strain-free transition ionic radius for the transition as a function of composition.
The P21/c–C2/c phase transition and phase equilibria in pigeonite.
Calcium poor P21/c pigeonite is a high-temperature phase, which inverts during cooling to an augite-orthopyroxene assemblage, and it is generally reported as being more iron rich than other pyroxenes. In ternary equilibria between monoclinic Ca-rich, Ca-poor and orthorhombic quadrilateral pyroxenes, the Ca-poor monoclinic pyroxene phase invariably has a lower Mg content (Lindsley and Andersen, Reference Lindsley and Andersen1983).
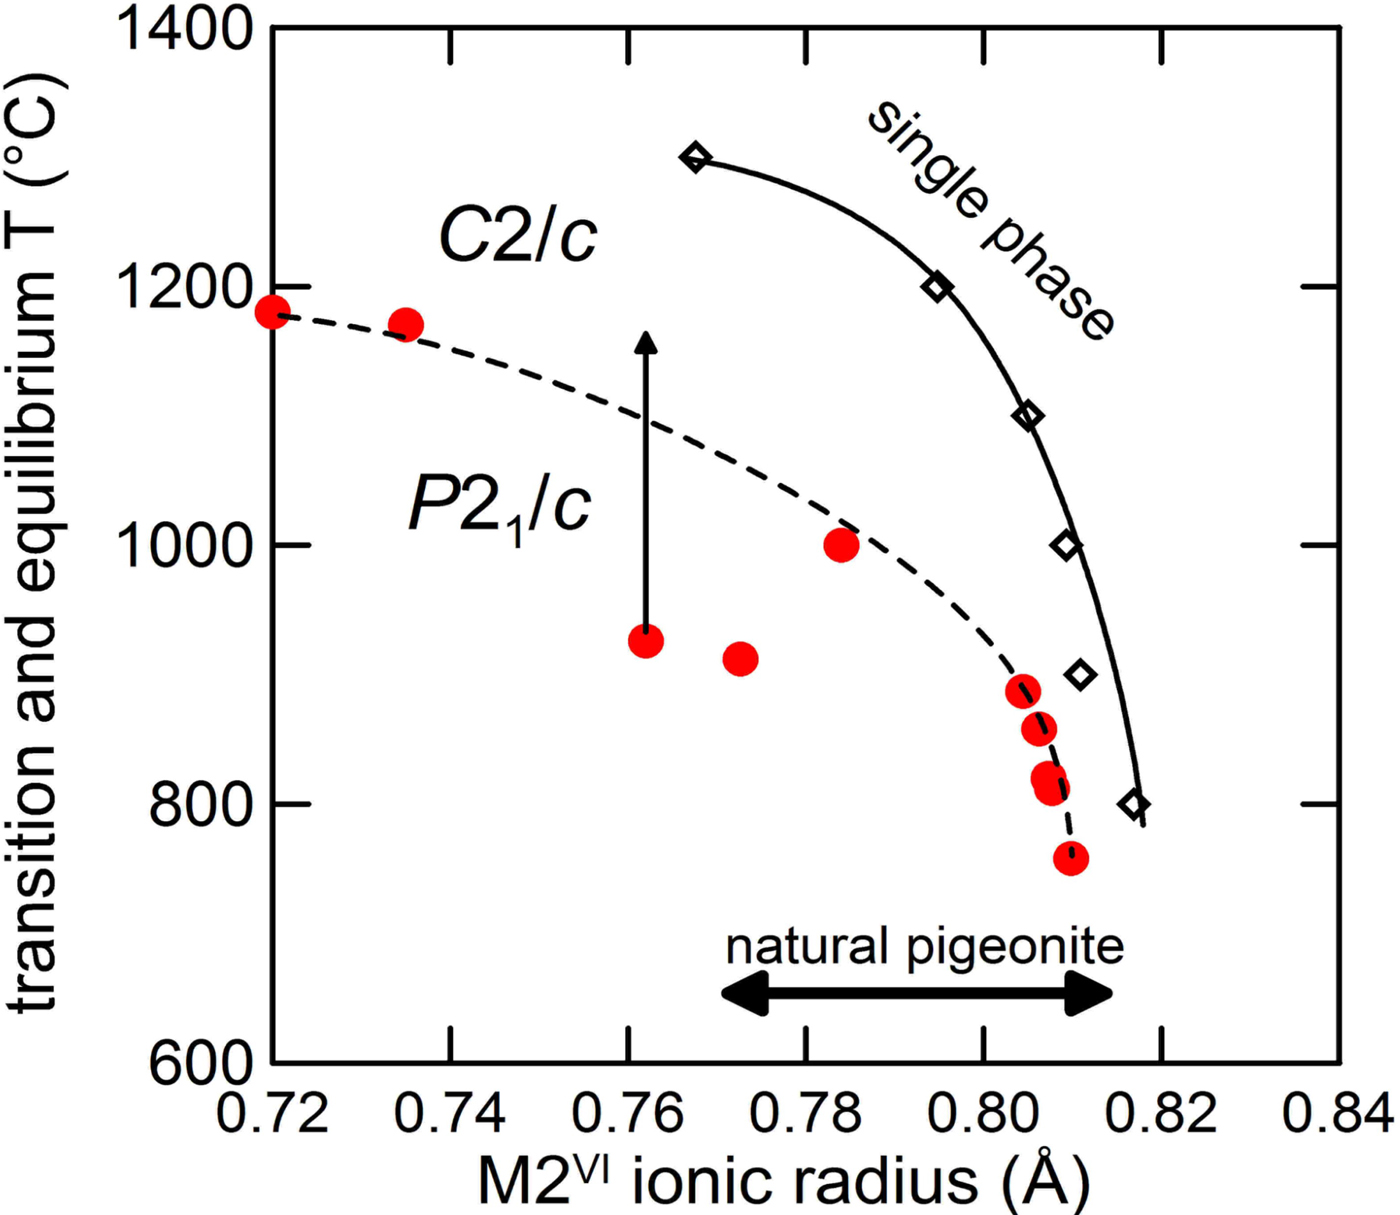
In Fig. 11 we plot the M2 ionic radii of the Ca-poor phase coexisting with Ca-rich clinopyroxene and orthopyroxene at room pressure with the temperature for the ternary equilibria (Lindsley, Reference Lindsley1983). As temperature increases, the maximum Mg solubility increases too, while the Ca content at the equilibrium does not change significantly, being ~0.2 Ca apfu. The average ionic radius was calculated from the crystal chemical composition, assuming that all Ca goes in the M2 site. Fe and Mg were partitioned between the M1 and M2 sites at the equilibrium temperature from the thermometric calibration by Pasqual et al. (Reference Pasqual, Molin and Tribaudino2000).
M2 ionic radii of the Ca-poor phase coexisting with Ca-rich clinopyroxene and orthopyroxene at room pressure (solid line), C2/c–P21/c transition temperature (dashed line) and range of natural pigeonite vs. ionic radius. Red dots indicate the transition temperatures. Data from (lower to higher ionic radius): Shimobayashi and Kitamura (Reference Shimobayashi and Kitamura1991) two samples; Tribaudino et al. (Reference Tribaudino, Nestola, Cámara and Domeneghetti2002), one sample arrowed; Alvaro et al. (Reference Alvaro, Cámara, Domeneghetti, Nestola and Tazzoli2011) two samples; and Camara et al. (Reference Cámara, Carpenter, Domeneghetti and Tazzoli2003) five samples. The arrow in Tribaudino et al. (Reference Tribaudino, Nestola, Cámara and Domeneghetti2002) indicates the transition range between strained and unstrained crystals.
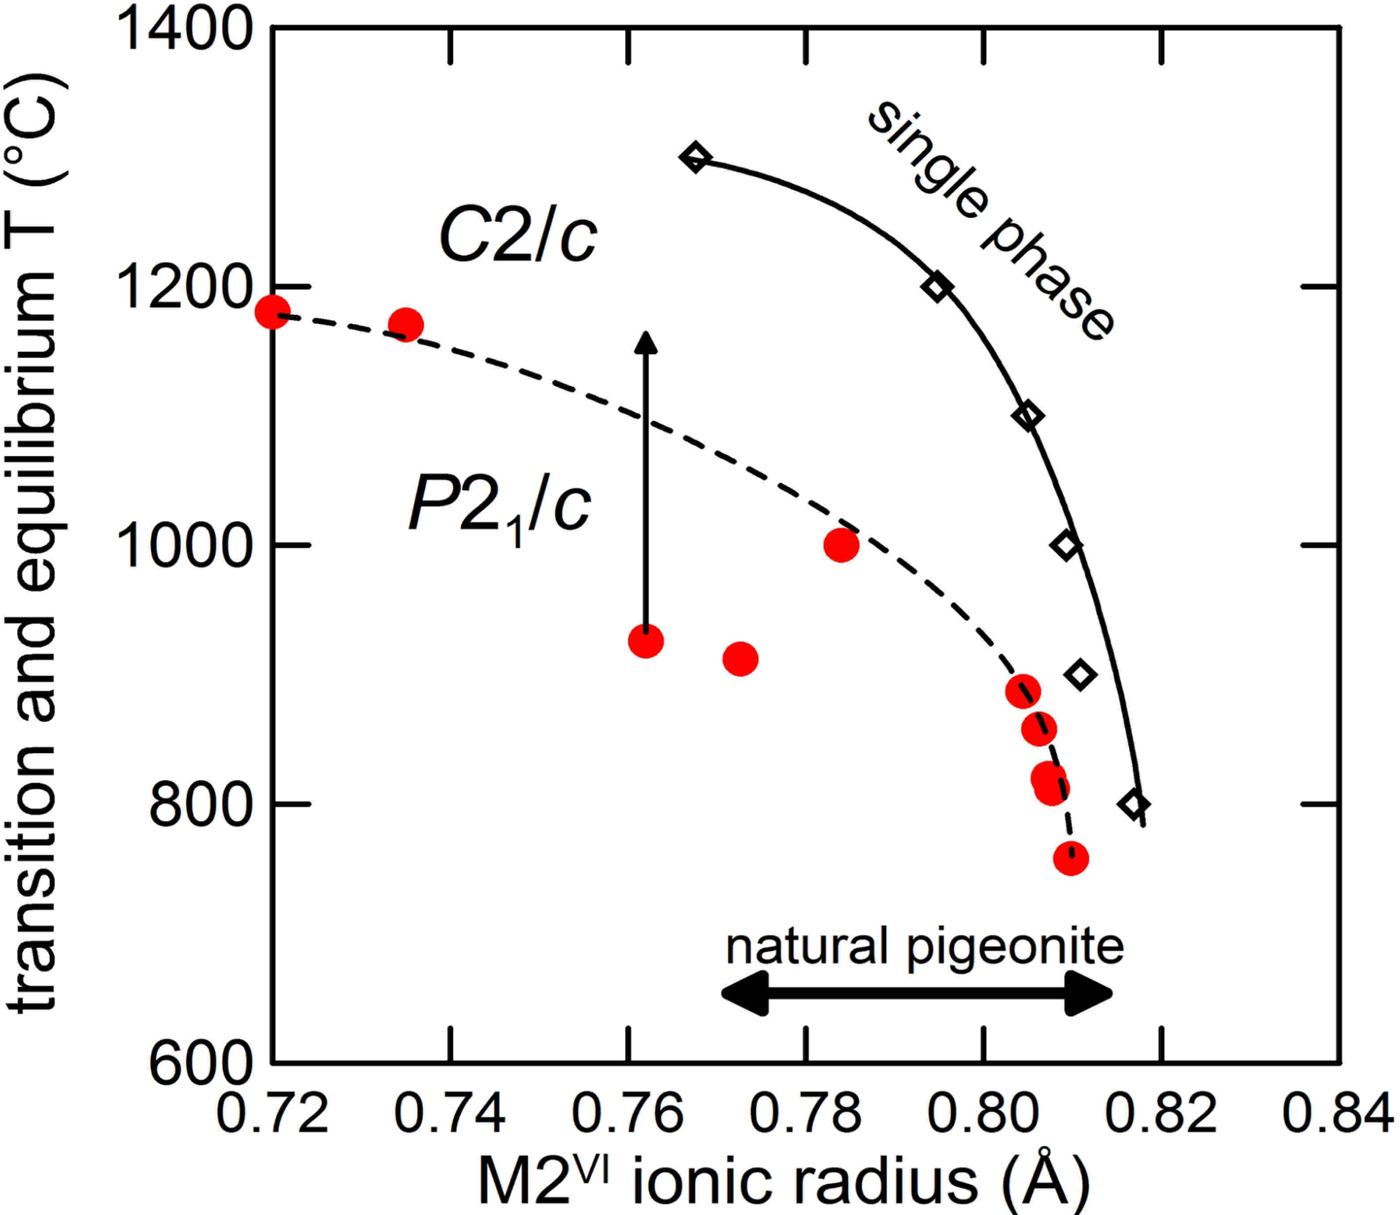
In the plot in Fig. 11 only pigeonite above the M2 ionic radius-T stability curve is stable as a single phase; at the same temperature a single-phase pigeonite with smaller average ionic radius is not stable, and a two-pyroxene assemblage is found instead.
In the same plot the transition temperature for a series of TEM-characterized single crystals of varying composition is reported. Coupling of Fe-Mg disorder with the displacive process of the transition also changes the transition temperature, and is probably the reason for the non-linear trend in the phase transition temperatures shown in Fig. 11. Above the dashed line a HT-C2/c structure exists. It appears that the limiting equilibrium conditions for the pigeonite stability fall within the HT-C2/c field, i.e. pigeonite coexisting in equilibrium with clinopyroxene and orthopyroxene has, when it is formed, a HT-C2/c structure. Thus the equilibrium occurrence of pigeonite is related to the achievement of an HT-C2/c structure. This explains the high-temperature nature of pigeonite, and, as Fe lowers the transition temperature, their likeliness as an Fe-richer phase, at least in assemblages with crystallization temperature below 1200°C. Actually, Mg-rich pigeonite in ureilites is related to their higher crystallization temperature, which is well beyond 1200°C (Berkley et al., Reference Berkley, Taylor, Keil and Prinz1980).
Incidentally, this agrees with previous observations that the structure of C2/c Ca-rich pyroxenes at high temperature approaches that of the HT-C2/c in Ca-poor pyroxene (Cameron and Papike, Reference Cameron and Papike1981, Benna et al., Reference Benna, Tribaudino, Zanini and Bruno1990), making solid solution in C2/c at high temperature easier.
Acknowledgements
The helpful comments from reviewers Günther Redhammer and Pete Leverett are gratefully acknowledged. The NASA antarctic repository is thanked for the loan of samples ALHA77257 and RKPA80239.