Children in China are better fed, taller and heavier than they were in the past. That is a welcome development. But, an increasing number of children are overweight and even obese, especially in the affluent cities of east China. As many as a quarter of 7- to 18-year-old urban boys were found to be overweight or obese in a 2005 national survey of schoolchildren's health.Footnote 1 Leading Chinese nutritional researchers have labelled the “alarming increase” in the prevalence of overweight and obesity in China an “epidemic” and “public health crisis.”Footnote 2 However, the increased prevalence of overweight and obese children in China serves to highlight the persistence of high levels of poor nutrition. Up to a third of school-age children and youths are underweight, a level that has barely changed during more than three decades of rapid economic growth. Poor nutrition continues to result in low weight-for-age and the stunting (low height-for-age) of many Chinese children, with profound long-term consequences for health and economic productivity.
The rapid rise in the number of overweight and obese people in China has captured the headlines.Footnote 3 The more disturbing issue for a state that has espoused the aspiration of making China a “relatively well-off” (xiaokang 小康) society is the increase in the disparities in nutritional status. This article draws on data from national surveys of China's school-age children conducted between 1979 and 2005. These data show not only a marked increase in the mean weight of children and their average body mass, but also an increase in the relative proportion of children in the upper part of the weight distribution, which varies widely between the provinces. In other words, the dispersion in mean weight has increased as revealed in the rise in the coefficient of variation, a simple measure of inequality.Footnote 4 The maximum weight for each age group has increased faster still. In between, those who are of normal weight have become fewer.
These changes in nutritional status can be attributed to various factors, including the uneven share in the benefits of economic reform. Higher incomes and the huge change in China's socio-economic environment have combined to create what many see as an “obesogenic environment” – that is, there is greater consumption of energy-dense foods, fewer opportunities for physical leisure and a general trend towards an increasingly sedentary lifestyle.Footnote 5 The consequences of increased weight are higher morbidity and a wider spread of preventable diet-related diseases, which will lead to increases in private and public health expenditure.Footnote 6 Meanwhile, economic development has failed some of the most vulnerable children in central and western provinces where nutrition availability is less and often inadequate, access to education is constrained in various ways, and life expectancy at birth is lower than in east China.Footnote 7 The nutritional disparities discussed in this article are but part of a kaleidoscope of disparities found in contemporary China. I argue that the stark regional differences in nutritional status across China and the increasing inequality in nutritional status over time are primarily driven by differences in household income and associated lifestyle changes, such as increased food consumption and a more sedentary life.
The next section outlines the background to the emerging problem of overweight and obesity in China, which is shared by both developed and developing countries. The third section discusses the data and summarizes the national trends. This is followed by an analysis of provincial and regional variations in body weight and mass. The final section identifies potential factors driving the shift in nutritional status and summarizes the findings and implications for public health.
Background to Nutritional Variance in China
Centuries of widespread hunger and frequent famines mean that the recent improvements in food security are most welcome in China. A little over half a century ago, China experienced the worse famine in history, at least in aggregate loss of life.Footnote 8 Chronic undernutrition was the norm at the start of the economic reform in the late 1970s when the per capita availability of grain was about the same as on the eve of the Great Leap Forward (1958–60).Footnote 9 The nutritional shift among the Chinese is therefore astonishing, from a state of chronic undernutrition and a population that was lean, to the present state of abundant or overnutrition for many, with an increasing share of the population becoming overweight and obese. An editorial in the British Medical Journal asserted that, “one fifth of the one billion overweight or obese people in the world are Chinese.”Footnote 10 The estimate was derived from the 2002 nutrition and health survey that found that 14.7 per cent of the Chinese population (a total of 184 million people) were overweight (meaning that they have a body mass index (BMI) of 25–29.9), and that 2.6 per cent (a total of 31 million) were obese (defined as having a BMI greater than 30). These figures combine to make an estimated overweight and obese population of 215 million, based on World Health Organization (WHO) standards. But there are researchers who have criticized such extrapolations from surveys.Footnote 11 Although the figures are lower than for the United States, where one in three is obese, China is predicted to catch up rapidly.Footnote 12 Numerous studies report the increase in weight among the Chinese, even in rural areas. For example, a recent study of 16,344 Shandong rural residents found that 35 per cent were overweight and 15 per cent obese.Footnote 13
China is not alone among developing countries. The number of overweight and obese people has been increasing across the world, in rich and poor nations alike, according to the WHO.Footnote 14 The progress in escaping hunger over the past century has come “not without a major cost – in both health and economic terms – of global obesity.”Footnote 15 The primary driver of the change is the socio-economic environment rather than individual behaviour.Footnote 16 The transition to Western, urbanized lifestyles in China, India and elsewhere has resulted in higher calorie intake and lower levels of physical activity. In urban China, average daily energy needs have declined by 400–800 kilocalories, “so weight gain and obesity are inevitable for most of the population.”Footnote 17 Excess weight is an indicator of increased potential morbidity rather than of an actual illness. It raises the likelihood of preventable chronic diseases, such as cardiovascular diseases (CVDs) and type-2 diabetes. Non-communicable diseases in China account for more than two-thirds of all deaths, with CVDs the most common cause of death.Footnote 18 Type-2 diabetes affected 92 million people (7 per cent) in 2008, a number which is expected to double over the next decade.Footnote 19 The increase in CVDs and diabetes has huge economic implications. CVDs have been estimated to consume 4 per cent of China's GDP, a figure which will double by 2025 unless there is intervention, while diabetic patients are 3.5 times more costly to treat than non-diabetic patients.Footnote 20 Obesity and nutrition-related non-communicable diseases are “the largest health-related costs” China and India will have to contend with in the next 15 years.Footnote 21 One of the means to contain the escalation of future health costs is to control the increase in excessive weight gain and obesity among children. Fat children are more likely to become fat and illness-prone adults, thus obesity in childhood is a predictor of many illnesses in later life.Footnote 22
The most widely used measure for body fat is the BMI indicator, which is calculated by dividing weight in kilograms by height in metres (kg/m2). As a measure of body weight adjusted for height, BMI correlates highly with the percentage of body fat and is largely independent of height. It is easy and inexpensive to calculate, and is “an acceptable proxy for thinness and fatness, and has been directly related to health risks and death rates in many populations.”Footnote 23 The WHO international standard specifies that the normal BMI for adults is between 18.5 kg/m2 and 25 kg/m2 (15th–85th percentile), an overweight BMI is 25–29.9 kg/m2 (85th–95th percentile) and obese is greater than 30 kg/m2 (above the 95th percentile). For children, the BMI cut-off points are lower and differ according to age.Footnote 24 (Hereafter, the BMI units will be dropped.) However, the WHO international scheme underestimates the percentage of body fat in Asian populations relative to Europeans. Asian populations show higher risk factors for diabetes and CVDs at a BMI less than 25. In 2004, the WHO expert consultation group recommended the lower BMI cut-off points for Asian populations of 23, 27.5, 32.5 and 37.5.Footnote 25 The Working Group on Obesity in China (WGOC) set the cut-off points for being overweight and obese at a BMI of 24 and 28, respectively, for Chinese males and females older than 18 years, and produced adjusted sex-age-specific cut-off points for children.Footnote 26
In this article, height, weight and BMI are used to analyse the changes in the nutritional status and well-being of people in China. Weight in kilograms and BMI are measures of the current nutritional status of a person. These can change quickly, for example from transient nutritional shocks such as illness. Height in centimetres is a historical measure of the net nutrition of a person during their growth from in utero to adulthood, or to the time of measurement for a child. It is a complex trade-off between a person's gene endowment and available nutrition after allowing for body metabolism, disease and physical activity.Footnote 27 Other things being constant, the mean height of a population is a robust measure of both the availability and distribution in a society of nutrition resources; it is highly correlated with secular trends in income and economic disparities, as well as with morbidity and mortality.Footnote 28 Severe nutritional shocks or persistent chronic under nutrition on a regional or societal scale will lead to a decline in the mean height of a population or subgroup. Conversely, when average nutrition improves, the mean height will rise. This pattern makes height a useful proxy for human welfare in the past for periods where conventional economic data for income are lacking, including studies of China and Taiwan.Footnote 29 Height, weight and BMI therefore allow us to examine trends in the distribution of nutrition over time and between population subgroups in a country such as China.
Data and National Trends
Height, weight and body mass data are drawn from six national-level surveys of Chinese schoolchildren and youths between 1979 and 2005. The ministries of education, health, science and technology, and the National Minorities Commission and the Sports Commission jointly sponsored these studies. The published reports of summary data have had varying but similar titles over the years: the 2005 report was published as 2005 nian Zhongguo xuesheng tizhi yu jiankang diaoyan baogao 2005 年中国学生体质与健康调研报告, and officially translated as Report on the Physical Fitness and Health Surveillance of Chinese School Students, 2005.Footnote 30 The 1979 survey reported data for Han Chinese of both genders in 16 provinces from urban (7–25 years old) and rural (7–17 years old) areas. Subsequent surveys have reported data for Han children and youths aged 7–22 from every province except Tibet. Data for selected non-Han minority populations are also available from 1985.
The focus here is on primary and high school students of Han ethnicity. Stratified by gender and rural–urban residence, there are four groups for each age group of 7–18 years old, and the sample for each age group is about equal in size for any particular survey. In the 1985 survey, each sample group comprised 305 or 306 subjects, with more than half a million children measured, while later surveys have sampled about half that number – the 2005 survey had 226,602 subjects in groups of about 150. Each age group is further stratified by roughly equal proportions drawn from sampled schools in designated upper, middle and lower socio-economic areas, although the locations and socio-economic variables for each area are not revealed.Footnote 31 The surveys are far larger in sample size for each age group than any other that includes anthropometric measures status, such as the frequently used China Health and Nutrition Survey (CHNS).Footnote 32
Since the late 1970s, higher income has brought about a strong secular increase in average height-for-age. The Chinese are clearly “richer and taller” than they have ever been.Footnote 33 However, there are large regional and urban–rural differences – northerners are typically taller (and heavier) than southerners, east coastal urbanites are taller than inland urbanites. To highlight extremes, a 17-year-old Beijing urban male in 2005 was 173.5 cm and 67.6 kg, while a Guizhou rural male was 164.4 cm and 51.8 kg.Footnote 34 But, for any continent-sized country such as China, similar disparities exist in most social indicators, such as life expectancy at birth.
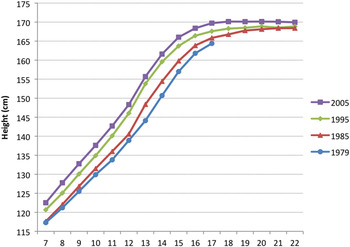
Figure 1 shows that the national mean height-for-age profile for rural males aged 7–22 years, for example, has shifted upwards for each of the reported surveys between 1979 and 2005 (data were not reported in 1979 for rural males aged 18 and older).Footnote 35 In 1979, the national mean height for seven-year-old rural males was 117.3 cm, which had increased to 122.5 cm by 2005, while for 17-year-olds mean height had increased from 164.4 cm to 169.7 cm, an average rise of more than 5 cm for each age group. The slope of the curve also demonstrates that nutrition had improved. In 1979, 1985 and 1995, the curve for rural males at 17 years of age had an upward slope, indicating that these youths were still growing and had not attained their final stature, which was not reached until age 20 in 1985 and age 19 in 1995. By 2005, mean rural male height from 18 years of age was around 171.1 cm. Meanwhile, the urban Chinese males on average had stopped growing at age 17–18 by the 1995 survey, and for the more developed provinces by 1985 or before.
Change in Height-for-Age Profile of Chinese Rural Boys Aged 7–22, 1979–2005

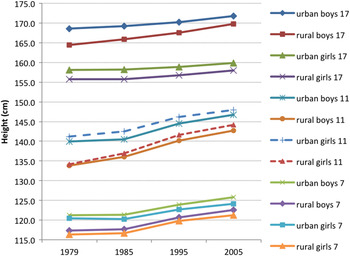
Stature has improved for both genders. For the selected age groups of seven, 11 and 17 years, Figure 2 shows the upward shift in the national mean stature for both rural and urban area boys and girls from 1979 to 2005. Girls are on average shorter than boys, except for a brief period during their pubertal growth spurt between the ages of 10 and 12 years. There are obvious differences in the mean height between rural and urban children. In 1979, seven-year-old urban girls (120.4 cm) were taller than both rural girls (116.3 cm) and boys (117.3 cm), but shorter than urban boys (121.2 cm). The mean height of each group increased over the 26 years to 2005, with rural boys (+5.2 cm) and girls (+4.9 cm) making slightly greater gains than urban boys (+4.5 cm) and girls (+3.7 cm). Similar trends are observed for the other age groups over the period 1979 to 2005. The increase for 11-year-old urban and rural boys was 6.8 cm and 8.9 cm, respectively, and for girls 6.8 cm and 10.0 cm. For 17-year-olds, rural boys were 5.3 cm taller and urban boys 3.2 cm taller, which halved the rural and urban gap from 4.2 cm in 1979 to 2.1 cm in 2005. For 17-year-old girls, the story told by the means is different: the average height of urban girls increased by 1.8 cm and by 2.3 cm for rural girls, and the average difference in height narrowed by only 0.5 cm, from 2.3 cm in 1979 to 1.9 cm in 2005.
Change in Height-for-Age for Chinese Boys and Girls Aged 7, 11 and 17, 1979–2005

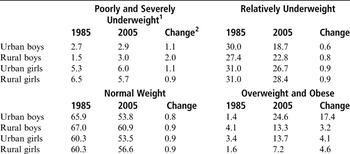
Mean weight can be expected to increase with the rise in mean height, but this does not necessarily translate into a rise in BMI unless mean weight increases faster than mean height. And, indeed, that is happening in China. Average weight has increased proportionately faster than average height. National changes in mean body mass for Chinese aged 7–22 years between 1985 and 2005 are shown in Table 1. Several changes are conspicuous. The proportion of those who were poorly or severely underweight has increased slightly among urbanites, doubled for rural boys, and declined slightly for rural girls. Fewer Chinese children and youths were relatively underweight in 2005 than in 1985, with a large fall of 11.3 percentage points for urban males, but a far smaller decline for other groups. Between 1985 and 2005, there has been a slight decline in the number of children classed as relatively, poorly and severely underweight (Table 1). Meanwhile, those who are overweight or obese (that is, those above the 85th percentile) have had the greatest change, ranging from a 3.2 fold rise for rural males to a 17.4 fold rise for urban males in the two decades to 2005. The result of these changes at either end of the weight distribution scale is that the proportion in the normal BMI range has contracted for both urban and rural children, from between 60.3 and 67.0 per cent to between 53.5 and 60.9 per cent.
Summary of Bodyweight Changes for Chinese Aged 7–22, 1985–2005 (%)

Source: Report 2005, 90–92.
Notes:
1.The weight classifications use the Chinese 1985 BMI reference. Poorly and severely underweight is less than −2 standard deviations (SD) from the mean, relatively underweight is −1 SD, overweight and obese is greater than +1 SD. 2.Change shows the change between 1985 and 2005 as an increase/decline ratio. For example, a change of less than 1.0 means there was a relative decline in prevalence, and a change of 3.0, a three-fold increase.
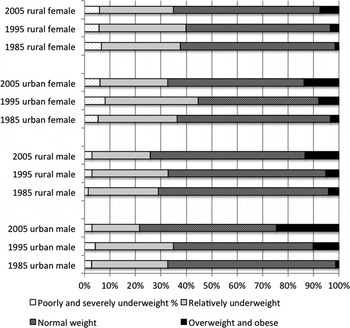
Figure 3 graphically shows the shrinking normal range among Chinese children and youths aged 7–22 years since the mid-1980s, and the increasing prevalence of overweight and obese children. In the mid-1980s, the proportion that was heavier than normal comprised only a few percentage points. By 2005, nearly a quarter of urban boys were overweight or obese, more than 13 per cent of rural boys and urban girls were too, and only among rural girls was the prevalence of overweight and obesity less than 10 per cent. Most striking is the persistence of a large portion of underweight children and youths that remain stubbornly above 20 per cent, and for some groups more than 30 per cent, of the population. In the mid-1990s, the proportion of underweight children and youths was higher than the mid-1980s or the mid-2000s. The late-1980s to the mid-1990s witnessed a marked rise in economic disparities in China that these body mass data capture very well.Footnote 36 Underweight was more common among both rural and urban Chinese girls than boys, and in 1995 comprised 40 per cent or more of these groups. The gender differences point to the within-household inequalities where there are both boys and girls, notwithstanding the one-child policy, but the high level of aggregation of the summary statistics does not permit analysis that would clarify the reason for this apparent bias against girls.
Change in the Distribution of BMI Status among Chinese Aged 7–22, 1985–2005

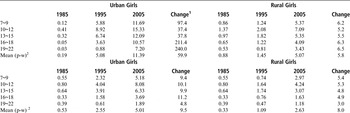
The aggregate change in the prevalence of obesity is evidence of profound changes in nutrition and lifestyle in contemporary China, although obesity rates are still low in many provincial populations, as will be shown. Table 2 shows obesity was nearly non-existent among children in 1985.Footnote 37 The prevalence was less than one per cent in 1985 for all groups except 10- to 12-year-old rural males, of whom 1.37 per cent were obese. Between 1985 and 1995, the prevalence increased rapidly, and in the following decade to 2005, the prevalence doubled or tripled again.
Change in Prevalence of Obesity among Chinese Aged 7–22, 1985–2005 (%)

Source: Report 2005, 90–92.
Notes: 1.Change is the increase between 1985 and 2005. For example, a change of 3.0 means there was a three-fold (300 per cent) increase in prevalence. 2.The mean is the population-weighted (p-w) for age 7–22 years.
Rates of obesity vary according to age group, with higher levels in the younger ages, although the rate of change between 1985 and 2005 is fastest for the older teenagers, as shown in Table 2. Among urban boys, in 2005 more than 15 per cent of 10- to 12-year-olds were obese, as were about 12 per cent of the 7- to 9 and 13- to 15-year olds. Obesity among 7- to 9-year-old urban boys increased 97 fold between 1985 and 2005; for the 16–18 and 19–22 age groups the increase is 211 and 240 times over the same period, albeit from a very low starting level. While the prevalence of obese children among rural males and urban and rural females is far less than among urban males, the pace of change is nonetheless fast. On a population-weighted basis for 7- to 22-year-olds, there was an average 5.8 fold increase in obese rural males, an 8.0 fold increase in obese rural females and a 9.5 fold increase in obese urban females; among urban males, the prevalence increased 59.9 fold, from a mean of 0.19 per cent in 1985 to 11.39 per cent in 2005.
Provincial and Regional Disparities
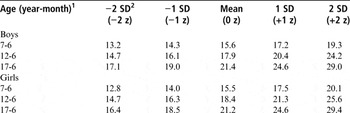
This article now turns from the national trends in height, weight and body mass to look at the urban–rural and regional variations in body mass. It uses the comparative reference standard of the WHO 2007 BMI-for-age recommended body mass for the selected ages (see Table 3). The WHO standard, rather than the Chinese WGOC standard, is used to ensure international comparability, although for clinical intervention the WHO standard under-reports the prevalence of childhood obesity in China. The 1-standard deviation (SD) level is the cut-off for being overweight, equivalent to the 85th percentile, while the −1 SD is the 15th percentile, below which the children are light but not usually considered underweight or excessively thin (clinical thinness and severe thinness correspond to −2 SD and −3 SD, respectively).Footnote 38
WHO Reference Standard BMI-for-Age, Selected Ages

Source: WHO 2007.
Notes: 1.The BMI-for-age is for the 6th month of the respective age year. 2.SD is standard deviation. A change of 1-SD is the same as 1 z-score unit where the mean is normalized (set to zero), which is more useful for comparison between age or population groups than the absolute change. The 1-SD and 2-SD levels approximate to the 85th and 98th percentiles that correspond to the WHO cut-off for being overweight and obese, respectively. Below -1 SD is relatively underweight and those who are -2 SD or less would be poorly to severely underweight for age (severe thinness). The -2 score is defined as the critical thinness threshold for clinical intervention for children rather than -1, the usual cut-off for underweight in adults. See Cole et al. Reference Cole, Flegal, Nicholls and Jackon2007.
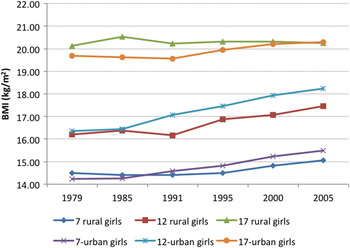
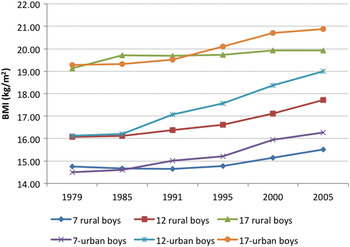
Between 1979 and 2005, the mean BMI for both rural and urban boys and girls increased for every age group (Figure 4 and Figure 5).Footnote 39 The national average in the late 1970s and early 1980s was below the WHO 2007 recommended median BMI for all age groups. For example, there was little difference between urban and rural seven-year-old boys and girls, who at the time were in the range of 14.2–14.8, compared with the WHO recommended median BMI of 15.5–15.6. Figure 4 shows the secular change for boys aged seven, 12 and 17 years of age. In the early years of the reform period, rural boys were as heavy, if not heavier, than urban boys. Apart from 17-year-old rural youths in 1991, urban boys have been consistently heavier than their rural counterparts since the 1990s, and the gap has steadily widened. By 2005, seven-year-old urban boys had an average BMI of 16.3 and rural boys 15.5, compared with the WHO recommended median of 15.6. Twelve-year-old urban boys in 2005 had an average BMI of 19.0, which exceeded the recommended BMI of 17.9, while rural boys, at 17.7, were slightly below the WHO median. Among 17-year-olds, urban boys at 20.9 were 1.0 heavier than rural boys. Both groups were below the WHO recommended median BMI of 21.1.
Mean BMI of Chinese Boys Aged 7–17, 1979–2005

Mean BMI of Chinese Girls Aged 7–17, 1979–2005

For girls the trend is similar (see Figure 5). The BMI of rural girls exceeded urban girls in the 1980s, but from the 1990s, the average BMIs of seven and 12-year-old urban girls were above their rural sisters. The BMI gap between rural and urban girls in 2005 was 0.4 for seven-year-olds and 0.8 for 12-year-olds. By 2005, seven-year-old urban girls, on average, attained the WHO recommended median BMI of 15.5, although the BMI of rural girls was 0.4 below. Similarly, 12-year-old girls at a BMI of 18.2 were near the WHO recommended median of 18.4, but rural girls were 0.9 below. Rural 17-year-old girls on average were heavier than urban girls until the last two surveys when the gap closed. In 2005, both had a BMI of 20.3, which was just 0.9 below the WHO recommended median BMI of 21.2.
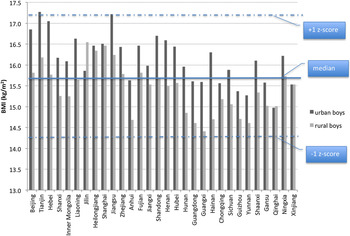
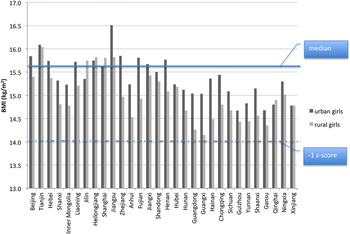
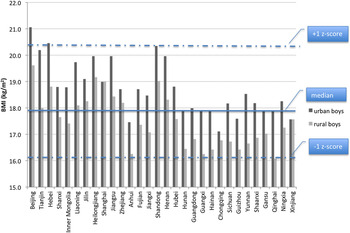
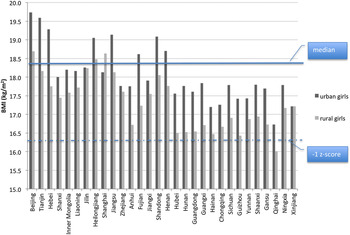
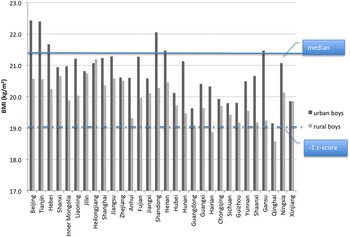
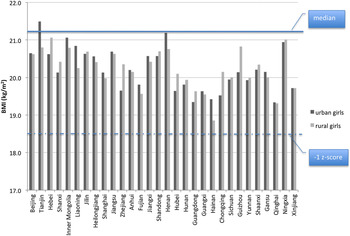
As with so many socio-economic variables for China, there are huge differences between provinces as well as between rural and urban areas. Figures 7–11 show the provincial differences in mean BMI in 2005 for boys and girls aged seven, 12 and 17, distinguished by urban and rural place of residence. Overlaid on each figure is the WHO recommended median and, as required, other lines showing the BMI level that is 1-SD above or below the median, which is labelled +1 or −1 z-score on the figures.Footnote 40
In many provinces of China in 2005, seven-year-old boys from both urban and rural populations exceeded the WHO recommended median BMI (Figure 6). The mean BMI for Tianjin and Shanghai urban boys was more than 1-SD above the recommended median. In other words, more than half the boys in these two metropolitan cities were overweight. At the other extreme, rural boys in Guangxi and elsewhere were nearly 1-SD below the median BMI, which corresponds to being very light on average, if not necessarily underweight, although clearly many boys in this province would have been underweight. Rural seven-year-old girls from many provinces were nearer the −1 SD line than the median, although about half of the urban girls were around the recommended median or slightly above it (Figure 7). This figure for girls brings out the variation in the provincial distribution of BMI and underscores the aggregate data summarized in Figure 3, which shows that a third of 7–22 year-old girls were relatively-to-severely underweight in 2005.
Regional Mean BMI of Urban and Rural Boys Aged 7, 2005

Regional Mean BMI of Urban and Rural Girls Aged 7, 2005

A similar pattern is seen for 12-year-olds (Figures 8 and 9). Among the boys, Beijing urban boys were more than 1-SD above the recommended median BMI, and Hebei and Shandong urban boys were about 1-SD above the median. Urban 12-year-old boys in 26 of the 30 provinces exceeded the recommended median BMI, but only in 11 provinces were rural boys on or above the median (Figure 8). Meanwhile, rural boys in nine provinces were quite light, with the mean for four provinces barely above the −1 SD line. Among the 12-year-old girls, the majority were lighter than the recommended median BMI (Figure 9). In eight provinces, however, urban girls were heavier than the recommended median BMI, including girls in Beijing, Tianjin, Hebei, Henan, Jiangsu, Shandong and Heilongjiang. Han rural girls in Qinghai were on average light or slightly underweight, more than −1 SD below the median, which means that more than half of the population ranged from very light to severely underweight.
Regional Mean BMI of Urban and Rural Boys Aged 12, 2005

Regional Mean BMI of Urban and Rural Girls Aged 12, 2005

As might be expected from the national mean BMI for 17-year-olds, discussed above (Figure 4 and 5), which shows that the average BMI was below the WHO recommended median for this age group, few provinces exceeded the WHO median. Only in several north China provinces, including Hebei, Henan and Shandong, were urban boys above the WHO median (Figure 10). None of the rural 17-year-old boys exceeded the recommended median. Some were very light, nearly –1 SD below the median (Anhui, Guangdong, Guizhou and Gansu) and two were below (Hainan and Qinghai). Among 17-year-old girls (Figure 11), only those in urban Tianjin and Shandong exceeded the recommended median. The others were below the median, irrespective of urban or rural residence. None were less than 1-SD below the median.
Regional Mean BMI of Urban and Rural Boys Aged 17, 2005

Regional Mean BMI of Urban and Rural Girls Aged 17, 2005

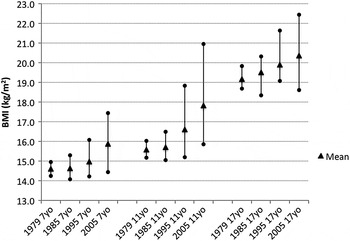
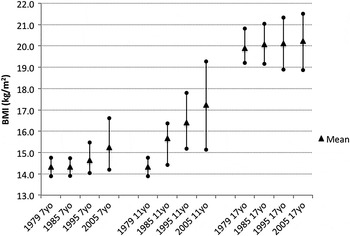
Despite the gains in average height and weight, the relative disparities in average BMIs between children in different provinces for 2005 have worsened over the past three decades. As shown in Figure 3, an increase in the prevalence of overweight and obesity has occurred with little change in the prevalence of underweight among China's children. The average of the provincial mean BMI has risen, but that is seemingly the result of the more rapid increase in the weight of children in better off provinces, which has pulled up the overall mean. This trend is graphically apparent in Figures 12 and 13, which show the overall mean (a triangle marker) along with the range of provincial mean BMIs from minimum to maximum.Footnote 41 Over time, the maximum provincial mean BMI has increased proportionally more than the national BMI mean. In some survey years and for some age groups, the minimum reported mean BMI even declined. For all age groups, the distance between the average and the maximum mean BMI among China's provinces became wider between 1979 and 2005 – that is, the length of the line above the triangle has grown. The increase in the length of the line below the overall mean to the minimum mean BMI indicates that many Chinese children and youths are not simply missing out on the nutritional improvement that economic reform and growth have brought to those in the more developed provinces, but that they may be worse off than those growing up in the same province in the early years of economic reform.
Increasing Disparities in Provincial BMI, 1979–2005: Minimum, Mean and Maximum (Boys)

Increasing Disparities in Provincial BMI, 1979–2005: Minimum, Mean and Maximum (Girls)

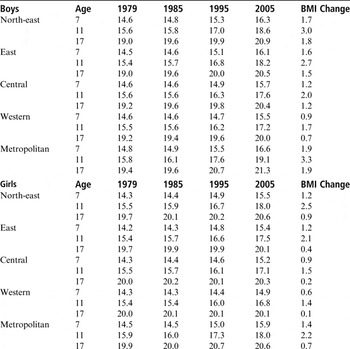
The regional variations in mean BMIs from 1979 to 2005 (Table 4) underscore the disparities indicated in the national trends (Figures 12 and 13). A modified form of the official Chinese four-region classification is used.Footnote 42 It divides China into the usual four zones – north-east, east, central and western – but places the three east China province-level municipalities into a metropolitan region since their rural areas are unlike the rural areas of other provinces in that most of their residents have access to the same services and possess similar incomes to their urban neighbours. In 1979, there was little difference among the regions in the average BMIs of children aged 7–17 years (Table 4). This reflected the broad egalitarian distribution, and also low level, of nutrition although the children in the metropolitan cities were distinctly heavier by 0.2–0.4 BMI. By 2005, the regional differences were clearly discernible. Both boys and girls were lightest in the western region, while the average BMI increased the most for the metropolitan region, and boys gained more weight on average than girls. Western region boys were on average 1.2–1.9 BMI lighter than metropolitan boys and 0.5–1.0 BMI lighter than those in east China; for girls the difference was 0.5–1.3 and 0.1–0.7, respectively. The increase in mean BMI between 1985 and 2005 was largest for each age group in the metropolitan cities and smallest for those in the west.
Change in BMI for Children Aged 7, 11 and 17 by Region, 1979–2005

Sources: Estimated from Report 1979; Report 1985; Report 1995 and Report 2005.
Note: Metropolitan is the Beijing, Tianjin and Shanghai municipalities; the north-east comprises Liaoning, Jilin and Heilongjiang; east comprises Hebei, Jiangsu, Zhejiang, Fujian, Guangdong and Hainan; central comprises Shanxi, Henan, Anhui, Jiangxi, Hubei and Hunan; and western comprises Sichuan, Guizhou, Yunnan, Shaanxi, Gansu, Qinghai, Ningxia, Xinjiang, Chongqing municipality, Guangxi and Inner Mongolia (Tibet is excluded from this analysis).
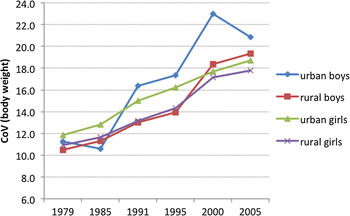
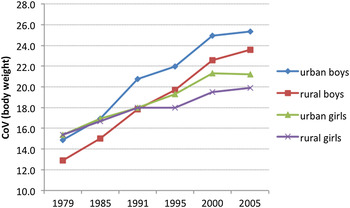
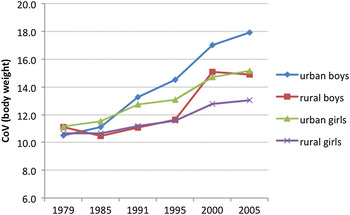
Another way to examine the increased disparities is to calculate the increase in the dispersion around the mean rather than the absolute differences in the mean. This measure of disparity or inequality is known as the coefficient of variation (CV), which is the ratio of the standard deviation to the mean. It is not possible to calculate the CV for the BMI directly for the survey years before 2000 because for each province only the summary mean and standard deviation for height and weight were released, but not the mean and standard deviation of the BMI. Although the mean BMI can be calculated using the summary mean height and weight for each province, as has been done above, the standard deviation for the BMI derived from these summary data cannot be estimated correctly. Owing to this data constraint, the change in the CV of weight, which is the key driver of the change in BMI, is reported on instead although both the CV for weight and height has risen over time. Figures 14–16 report the national trend in CV of weight for urban and rural boys and girls aged seven, 12 and 17 years.
Increase in Coefficient of Variation of Weight of Boys and Girls Aged 7, 1979–2005

Increase in Coefficient of Variation of Weight of Boys and Girls Aged 12, 1979–2005

Increase in Coefficient of Variation of Weight of Boys and Girls Aged 17, 1979–2005

For all age groups and provinces, the increase in the CV for both boys and girls demonstrates a marked rise in the level of disparities in nutritional status among Chinese children. Among seven-year-old boys (Figure 14), between 1979 and 2005 the CV increased by about 85 per cent and for girls it increased by about 60 per cent. For 12-year-olds (Figure 15), the CV for boys increased 70 per cent, from 14.9 to 25.3, and for rural boys there was a rise of 85 per cent, from a lower starting level of 12.9, to 23.6. The relative increase in CV for girls is lower in both urban and rural groups (about 40 per cent and 30 per cent, respectively). Among 17-year-olds (Figure 16), the largest increase in the CV is for urban boys, at about 71 per cent, compared with 34 per cent for rural boys, 36 per cent for urban girls and 22 per cent for rural girls.
Across the three selected age groups, provincial disparities in mean weight are higher among boys than girls, and highest among urban boys. The reasons for these differences are unclear. Some urban centres, such as the provincial-status metropolitan cities of Beijing, Tianjin and Shanghai, have not only seen a rapid increase in incomes and thus a capacity to buy more calories, but also a more rapid transition in diets and lifestyle than other urban centres, all of which combine to lead to overnutrition. Why increasing urbanization and wealth in the better off cities should have pushed up the weight of boys relatively more than girls is an intriguing question. In cities where many children are without siblings because of the one-child policy, a simple gender bias in within-household allocation of resources does not explain the differences in weight. The increasing incomes of urban households would reduce the likelihood of gender biases in the presence of mixed-sex siblings. A possible explanation is the influence on older urban girls of the media's promotion of a fashionable thinness that impels them to moderate their consumption of calories. Body dissatisfaction, concerns about weight, dieting fads and eating disorders are on the rise throughout China, including in developed Hong Kong and rural areas.Footnote 43 This is more acute among young women in more developed and urbanized communities. More research is needed to clarify how fashion trends might influence the weight of young Chinese women, but as Paul French noted recently: “Urban China is getting fatter while its personal body image is getting thinner.”Footnote 44
Discussion and Conclusion
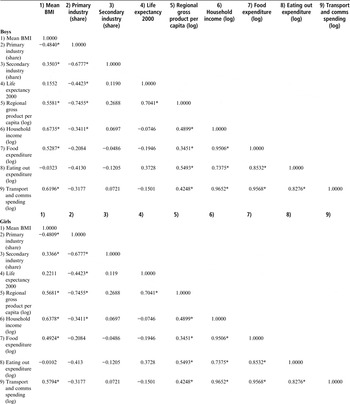
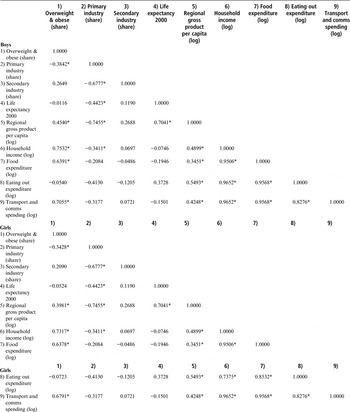
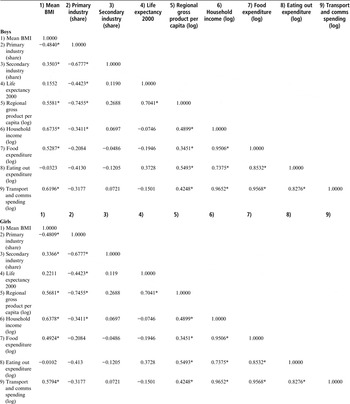
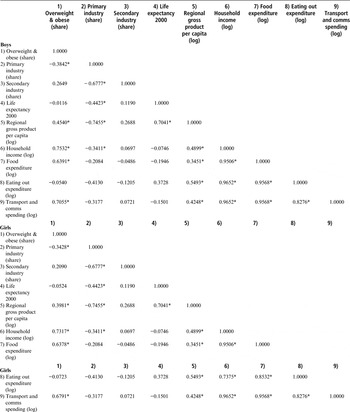
Explaining the trends in nutritional status in China is seemingly not difficult at first glance. Increased incomes, increased consumption and a changing lifestyle over the past three decades have all contributed to the increase in the number of overweight and obese Chinese. But identifying specific causal relationships at a provincial level with any statistical reliability using the summary data from the student surveys has proved intractable. Conventional approaches such as regression analysis disappoint because both the anthropometric data and the covariates are provincial-level summary means, rather than data for individuals. As a consequence, the statistical significance of the explanatory variables disappeared in regression analyses. Therefore, below I report the pairwise correlation coefficients for selected explanatory variables (Table 5 and 6). Correlational associations, however, are not the same as a causal relationship.
Correlation Matrix for Body Mass Index of Chinese Children Aged 7, 12 and 17
Sources: NBS 2004, online edition at: www.stats.gov.cn; Report 2005.
Notes: *indicates significance at the 1% level (0.01). The data for variables 2–3 and 5–9 are for year-end 2004. The BMI data are for 2005. The logs of income and expenditure data are used because these are linearly related to height, weight and BMI.
Correlation Matrix for Overweight and Obese Proportion of Chinese Children Aged 7, 12 and 17
Sources: NBS 2004, online edition at: www.stats.gov.cn; Report 2005.
Notes: *indicated significance at the 1% level (0.01). The data for variables 2–3 and 5–9 are for year-end 2004. The overweight and obese (share) is the estimated proportion of the population for any age group whose BMI is 1 SD or higher than the WHO recommended median BMI. BMI is assumed to be more or less normally distributed for estimation of this proportion or share of the population overweight and obese. The logs of income and expenditure data are used because these are linearly related to height, weight and BMI.
Table 5 reports the correlation coefficients and their significance between the mean BMI of Chinese children of selected ages and selected explanatory variables related to socio-economic structure, income and lifestyle. The mean BMI of children is strongly correlated (>0.5) and significantly so (>0.01 level) for most income-related variables (5, 6, 7 and 9). Household income (6) shows the highest correlation (0.67 for boys and 0.64 for girls). Children from higher mean income provinces had a higher mean BMI. The correlation is stronger for boys than girls. The relationship with the economic structure in a province – the relative share of primary and secondary industry contribution to regional domestic product (RGP) – is as expected: primary industry is negatively correlated and significantly so (a higher share of primary industry means a lower level of development and value added in the economy and correspondingly lower incomes). The coefficient for life expectancy at birth is low and not significant (even at the 0.05 level), which indicates the investment in health and sanitation has had little bearing on BMI levels. While the coefficient for expenditure on food is significant and correlated with mean BMI at 0.53 for boys and 0.49 for girls, the coefficient for eating out is not only small and insignificant, but the sign is negative, the opposite to that expected. The eating out coefficient is, as expected, correlated strongly with provincial income, household income and food expenditure. The other lifestyle variable – the spending on transport and communications (6) – is second only to household income in the size of the coefficient. This indicator in particular can be interpreted to emphasize that higher incomes and urban residency is highly correlated with a rise in the average BMI (see the high cross-correlation coefficients for transport and communications with variables 6–8).
To improve the sensitivity of the correlation analysis, Table 6 reports the coefficients estimated for the same set of variables for the share of the population in each age group that was above the WHO cut-off for overweight and obese. These differ intriguingly from the coefficients for mean BMI. First, the coefficients for provincial industry structure are smaller, and for secondary industry these are no longer significantly correlated with the proportion of overweight and obese children. Regional gross income is still significant but the coefficient is lower. However, the coefficients for those variables related to discretionary consumption expenditure within the household – variables (6), (7) and (9) – clearly point to higher household incomes being more closely associated with overweight and obese children. For example, household income was correlated at 0.75 for boys and 0.73 for girls. The eating out coefficient was still negative, tiny and insignificant.
Although correlations are not necessarily causal, the results in Tables 5 and 6 lend support to the view that the increase in overweight and obesity in China is driven by a change in the socio-economic environment which has increased the availability of food, reduced the relative price of foods, changed the types of foods consumed, and reduced the demand for food energy in work or leisure activities. Those with higher incomes in the more developed parts of China face an oversupply of nutrition relative to body requirements, which leads to inevitable increases in body mass. Studies have shown that the physical activity of urban Chinese halved in the 1990s, doubling or tripling their likelihood of becoming overweight.Footnote 45 Increasing use of motorized transport plays a part, too. Chinese men who acquired a motor vehicle were found to increase their weight by 1.8 kg and had 2-to-1 odds of becoming obese.Footnote 46 Even rural Chinese in the more prosperous east are expanding their waistlines rapidly.Footnote 47
Increased food consumption explains a lot, but by no means all. The amount of food consumed has clearly increased. Average urban per capita household purchase of meat (pork, beef, mutton and poultry) in the ten years to end-2004 went up by five kilograms to 29.2 kg, edible oil from 7.5 kg to 9.3 kg and milk from 5.3 kg to 18.8 kg.Footnote 48 But these averages conceal both income group and regional differences. The highest income group in 2004 bought 33.5 kg of meat and the lowest 21.7 kg.Footnote 49 Dining out has quickly gained in popularity in China and accounted for 20 per cent of the expenditure of urban households in 2004, compared with only 8 per cent in 1994.Footnote 50 Regional variation is huge. Dining out in Beijing constituted 27 per cent of urban household food expenditure, 24 per cent in Tianjin, and 26 per cent in Shanghai. For urbanites in less developed provinces, the change has been even greater: in 1994, Anhui urban households spent only 5 per cent of their food budget outside the home, but 20 per cent in 2004, while in Shanxi dining out increased nearly six-fold, from 3 per cent in 1994 to 17 per cent in 2004. These changes in spending and dining habits can be expected to affect individuals, but the data at the aggregate provincial level is seemingly too blunt a measure to capture these effects, which probably explains the lack of correlation reported (Tables 5 and 6).
A striking consequence of the transition in economic and nutritional status in China is the reversal of the BMI and socio-economic status (SES) relationship. In China, high SES children and adults are more likely to be overweight and obese than their lower SES counterparts, which is in contrast to developed countries where the middle-to-low income groups are more likely to be obese.Footnote 51 Other developing regions have similar patterns. A recent study of half a million women in 54 low and middle-income countries has found that a quartile increase in wealth results in a 33 per cent increase in weight in urban and rural areas, although the SES gradient was steeper in urban areas.Footnote 52 Ji and Cheng conclude that there is an “alarming increase in the prevalence of childhood obesity/overweight throughout China, except for the poverty [sic] western rural areas.”Footnote 53 The primary explanation for these differences in the prevalence of overnutrition and undernutrition in China is the SES inequalities, especially between east and west China, although more research is needed to tease out the many interaction effects at the individual level that influence weight.
To conclude, China faces two major issues related to the nutritional status of its children. The persistence of high levels of undernutrition among the urban poor and those in rural areas, which is evident in the widespread incidences of underweight and stunting. Between 22 per cent and 34 per cent are under or severely underweight, varying somewhat depending on gender and rural/urban residence (Figure 3). At the other end of the weight–nutrition spectrum is the increase in overweight and obesity that is truly startling for a country which half a century ago experienced the worse famine in history and which only three decades ago had widespread chronic hunger. Urban boys are most likely to be overweight or obese, and more so those living in east China and the metropolitan cities of Beijing, Tianjin and Shanghai. The coexistence of these huge disparities requires an explanation; the Chinese state also needs to formulate a better response in the delivery of public health and its development goals, although it is unclear how this response may come about.
What is not in doubt is that the number of overweight and obese schoolchildren in China has increased quickly, and that increases in body weight foreshadow big changes in morbidity and a rise in health expenditures. Less certain is the reason why the increase has been so rapid. Many observers point to economic reform creating an obesogenic environment in China. This manifests itself in the increase in consumption of energy-dense foods, eating out and the proliferation of fast food restaurants in urban China, and the broad socio-economic changes that have made for a more sedentary lifestyle. Fewer adult Chinese are engaged in manual work, fewer children walk or cycle to school, and outdoors recreation has been replaced by indoor inactivity in front of electronic devices.
There can be little doubt that economic reform has had a positive effect on the net nutrition levels of the Chinese, which is evident in the secular increase in the height-for-age of children (see Figure 1). But, such improvement should not necessarily have led to an increase in overweight and obesity. While the socio-economic changes are part of the explanation, there are also deep-seated cultural influences interacting with these to encourage over-eating among the young. Fat is associated with bounty and happiness. Plump babies “were much admired as symbols of goodness and luck” and to be emulated, while thinness represented “bad luck, illness and early death.”Footnote 54 There are images of plumpness in Buddhist iconography, the traditional New Year prints (nianhua 年画) of rotund babies and fat fish, and the chubby child faces of posters singing the praises of happier, well-fed and educated children that come to parents who observe the one-child policy.Footnote 55 This policy has probably influenced fatness among urban children – grandparents and parents lavish gifts and food upon these “little emperor” only children. Whatever the merits of the policy in the past, its retention is a liability. As China's population ages and gets fatter still and weight-induced chronic diseases become more widespread, future productivity growth will be jeopardized. As for undernutrition, the story is probably one of the continuing urban-oriented state biases that have long characterized Chinese economic development. The state and its agents have failed repeatedly to deliver the benefits of economic reform to the poorest of the Chinese, who mostly live in inland and less-developed provinces. In short, a complex interaction of state policies, socio-economic change and cultural predispositions combine to influence the pace of change in the prevalence of overweight and obesity, the rise of which has long-term implications for human welfare and economic prosperity in contemporary China.