I. INTRODUCTION
Titania (TiO2) is the widely used and the most important white reflective pigment in the coating industry.Reference Buxbaum and Pfaff1 It scatters visible light efficiently, which imparts whiteness, brightness, and opacity to many products such as paints, cosmetic, ointments, toothpastes, etc.Reference Buxbaum and Pfaff1, Reference Nelson and Deng2 The paint industry is the largest consumer of TiO2 pigment to the tune of 73% of the global pigment consumption.Reference Gargo3 TiO2 exists in three crystalline phases: anatase, brookite, and rutile. The anatase phase is used for photocatalysis due to its high photoreactivity.Reference Baiju, Shukla, Sandhya, James and Warrier4 Brookite phase is difficult to produce and, therefore, has no value in the pigment industry.Reference Eastaugh, Walsh, Chaplin and Siddall5 Rutile phase is thermodynamically the most stable and possesses the highest density with compact atomic structure.Reference Ray, Tracey, McQuillin and Hodgson6 TiO2 having rutile phase is largely used as reflective pigment in the coatingsReference Tayade, Surolia, Kulkarni and Jasra7, Reference Pedraza-Avella, Lopez, Martinez-Ortega, Paez-Mozo and Gomez8 because of its effective light scattering properties. Coatings containing even small amount of rutile phase TiO2 reflect almost the entire visible light. The reflective coatings of TiO2find applications in commercial optical products such as optical fibers, scintillators, integrating spheres, luminaries, reflective panels, laser cavity mirrors.Reference Abelli, Bastiani and Romagnoli9, Reference Vurgaftman and Singh10
Study on the reflectance of TiO2 particles has been a subject of significant research for many decades as its applications require high reflectance efficiency and photostability.Reference Mikhailov and Sokolovskii11 The enhancement of photostability of rutile phase while maintaining reflectance at the same time has been a challenging subject. Rutile phase of TiO2 is photostable than that of anatase phase.Reference Karvinen12 However, recently, it has been found that rutile phase nanoparticles show higher absorption in the visible region as compared to that of anatase phase: this leads to decrease in the photostability.Reference Yin, Komatsu, Zhang, Saito and Sato13 Photostability decreases as a result of generation of electrons and holes produced due to absorption of light. These electron–hole pairs move toward the surface of TiO2 and take part in the redox reaction.Reference Eastaugh, Walsh, Chaplin and Siddall5 Photostability also decreases because of the creation of point defects in TiO2; these defects create additional levels in the forbidden gap leading to the decrease in energy required to transfer electrons to the conduction band or to form holes in the valance band.Reference Baiju, Shukla, Sandhya, James and Warrier4 These problems can be solved by (i) preventing migration of electrons and holes from moving toward the surface of TiO2 by doping it with elements such as Al, Li, K, which create defects in TiO2 crystal lattice and introduce the traps for the electrons and holes,Reference Karvinen12, Reference Grzmil, Rabe, Kic and Lubkowski14 (ii) preventing the formation of free radicals (radicals lead to redox reactions) by functionalizing TiO2 surface, which removes the hydroxyl group,Reference Grzmil, Rabe, Kic and Lubkowski14 (iii) creating a novel TiO2pigment with unique crystal structure, morphology, and surface chemistry.Reference Chen and Mao15
In the present work, high photostable and reflective Al-doped TiO2 nanoparticles have been synthesized by sol–gel method. The effect of illumination on the diffuse reflectance of undoped/doped TiO2nanoparticles has been investigated. The reflectors have been designed using the synthesized nanoparticles, and their diffuse reflectance has been investigated.
II. MATERIALS AND METHODS
A. Synthesis of TiO2 nanoparticles
Using titanium isopropoxide, anhydrous 2-propanol, aluminum oxide, and deionized water, the undoped and doped TiO2 nanoparticles were synthesized as reported in the literature.Reference Baiju, Shukla, Sandhya, James and Warrier4, Reference Anuradha and Ranganathan16 In a typical synthesis, 0.4 M solution of titanium isopropoxide in anhydrous 2-propanol was prepared and aluminum oxide with varying concentration (0–5.0%) was added. Thereafter, a measured quantity of water was added dropwise, and the mixture was stirred for 6 h. The color of the solution changed from transparent to white due to hydrolysis of titanium isopropoxide, and TiO2 precipitated. The precipitates were filtered and dried in oven at 80 °C for 8 h. Then, the dried precipitates were crushed to obtain TiO2 nanoparticles. These nanoparticles were calcined at 900 °C for 1.5 h to remove solvent completely and to crystallize TiO2.
B. Preparation of coating material and reflectors
The coating material was prepared by dispersing TiO2 nanoparticles and acrylic (VISYCRYL-8350) binder in deionized water, using a planetary ball mill running at 800 rpm for 10 min. To maintain stable TiO2 particles dispersion in coating material, pH of the coating material was adjusted to 7. Plastic sheets (2 × 2 cm2), having a thickness of 1 mm, were used as substrate, cleaned using detergent, and rinsed with deionized water and isopropyl alcohol. These sheets were spray coated with the coating material up to different thicknesses. Before applying the coating material, a thin layer of binder was applied to the substrate for better adhesion. The reflectors were then made by applying two layers of coating, one over the other; care was taken to apply the second layer only after the glossy appearance of the first layer starts disappearing.
C. Characterization of TiO2 nanoparticles
PANalytical’s X’Perto Pro x-ray diffractometer (PANalytical B.V., Almelo, Netherlands) was used to determine the phase purity and crystal structure of the synthesized nanoparticles. Elemental composition of TiO2doped with Al was confirmed by energy dispersive x-ray (EDX) spectroscopy using NORAN System Six (Thermo Scientific, Northpoint Parkway, West Palm Beach, FL). Size and morphology of the nanoparticles were studied through Hitachi (H-7500) transmission electron microscope (TEM; International Equipment Trading Ltd., Vernon Hills, IL) and JEOL (JXA-8200) scanning electron microscope (SEM; JEOL Ltd., Zane Marek, Austin, TX). Perkin Elmer (350) UV–Visible spectrophotometer (Perkin Elmer, Waltham, MA) was used to record optical absorption spectra and Cary Varian fluorospectrophotometer (Cary Varian, Cary, NC) to measure photoluminescence (PL).
D. Measurement of diffuse reflectance
The diffuse reflectance measurement of the nanoparticles was performed by UV–Visible spectrophotometer, attached with integrating sphere to spatially integrate the radiant flux. For the measurement, the nanoparticles were pressed into thick pellet and placed at the entrance port of the integrating sphere. The same setup was used to measure diffuse reflectance of the developed reflectors. Calibration of the reflectance scale was done by standard reference material (WS-1-SL, Spectralon).
III. RESULTS AND DISCUSSION
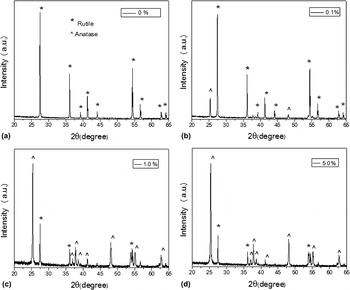
The x-ray diffraction (XRD) patterns of TiO2 doped with different concentrations of Al (0–5.0%) and calcined at 900 °C are shown in the Fig. 1. The peaks indexed to the reflection from (110), (101), (200), (111), (210), (211), (220), (002), and (310) planes, at 2θ values 27.54°, 36.04°, 39.20°, 41.12°, 44.14°, 54.33°, 56.89°, 62.82°, and 64.17°, correspond to rutile phase of TiO2 (JCPDS Card No. 86-0148), as well as the reflection from (101), (004), (200), (105), (211), and (204) planes, at 2θ values 25.44°, 38.02°, 48.19°, 53.94°, 54.98°, and 63.06°, correspond to anatase phase of TiO2 (JCPDS Card No. 86-1157). Figure 1 reveals that undoped sample exhibits characteristic peaks of only rutile phase, while the Al-doped samples (0.1%, 1.0%, 5.0% doped Al) exhibit peaks of both anatase and rutile phases. From the XRD patterns, it is clear that with the increase in Al concentration, the peaks get broadened and phase transformation from anatase to rutile registers decline. Absence of characteristic peaks of Al indicates the good dispersity of the incorporated Al.Reference Yang, Lu, Xu, Yuan, Chang, Zhou and Pan17
X-ray diffraction patterns of (a) 0%, (b) 0.1%, (c) 1.0%, and (d) 5.0% Al-doped TiO2nanoparticles.

Anatase to rutile phase transformation for undoped TiO2 mainly occurs at 650–800 °C.Reference Baiju, Shukla, Sandhya, James and Warrier4 We have earlier reported the complete transformation from anatase to rutile phase at the transition temperature of 900 °C.Reference Kumar, Verma and Singla18 In the present work, Al was used as dopant in the TiO2 nanoparticles. It acts as an inhibitor to phase transformation.Reference Grzmil, Rabe, Kic and Lubkowski14 The influence of dopant on TiO2 depends on its concentration, properties of dopant in relation to TiO2, experimental conditions, and the manner of distribution of dopant. It has been reported earlier that growth of grains of TiO2 particles is limited if the dopants are present on their surfaces, and because of this, the phase transition temperature from anatase to rutile increases.Reference Periyat, Baiju, Mukundan, Pillai and Warrier19 In our case, anatase to rutile phase transition temperature is observed at 900 °C due to Al doping; this shows that the dopant is mainly present on the surface of TiO2.
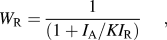
Table I shows the crystallite sizes of the samples, calculated using the Debye Scherrer’s equation.Reference Mingce, Weimin, Heng and Jun20 The full width at half maximum has been calculated from the most intense peak (Fig. 1), using the Lorentz best fit curve (R 2 > 0.98). It is clear from Table I that with the increase in Al concentration, the crystallite size decreases. The weight fraction (W R) of rutile phase content calcined at 900 °C (Fig. 1) was calculated from the below equation [Eq. (1)]Reference Grzmil, Rabe, Kic and Lubkowski14:
 $$W_{\rm{R}} = {1 \over {(1 + I_{\rm{A}} /KI_{\rm{R}} )}},$$
Crystallite size, particle size, and band gap energy variation with dopant concentration.

where I A and I R are the intensity of most intense peaks of anatase and rutile phase, respectively. K (0.882) is the ratio of the most intense peaks of the complete anatase and rutile phase. The Eq. (1) gives W R, for rutile phase, as 80%, 20%, and 18%, respectively, for samples doped with 0.1%, 1.0%, and 5.0% of Al.
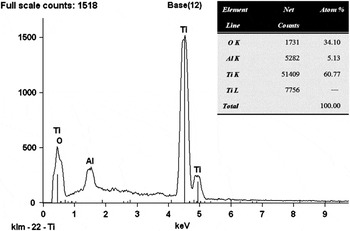
EDX is used to find elemental composition of Al-doped TiO2. Figure 2 shows EDX spectrum of the TiO2 doped with 5.0% of Al, which reveals that the atomic percentage of Ti, O, and Al are 60.77, 34.10, and 5.13, respectively. This confirms that incorporation of Al is quite good in the TiO2. The EDX spectrum for other Al concentrations, 0.1% and 1.0%, also corroborates the presence of Al in TiO2.
EDX spectra of TiO2doped with 5.0% of Al.

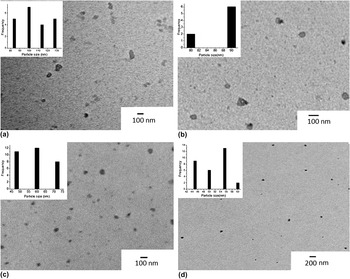
Figure 3 shows the TEM micrographs of TiO2 nanoparticles doped with different concentration of Al. The micrographs reveal that the particles are nearly spherical. The average size (Table I) of synthesized particles has been calculated from TEM micrographs by plotting histograms. As observed from the Table I, with increase in the dopant concentration, the size of TiO2 nanoparticles calcined at 900 °C decreases. It has been well reported in the literature that the size of pure TiO2nanoparticles increases due to the growth of grain boundary at 900 °C.Reference Kumar, Verma and Singla18
TEM micrograph of (a) 0%, (b) 0.1%, (c) 1.0%, and (d) 5.0% Al-doped TiO2nanoparticles.

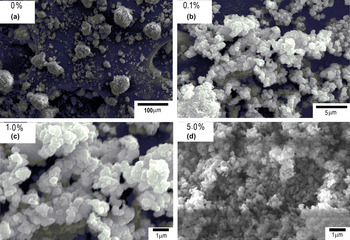
Figure 4 shows the SEM micrographs of TiO2 particles. As seen in the micrographs, the particles are nearly spherical and in aggregated state. With increase in the doping concentration (0–5.0%), there is a decrease in the aggregation and particles are more spherical. Micrographs reveal that with increase in the doping concentration, the particle size also decreases. This might be due to the presence of dopant. Al is mainly present on TiO2 surface, which limits the growth of grain boundaries of TiO2 particles and hence acts as a surfactant; this helps to control the morphology of TiO2nanoparticles.Reference Grzmil, Rabe, Kic and Lubkowski14
SEM micrograph of (a) 0%, (b) 0.1%, (c) 1.0%, and (d) 5.0% Al-doped TiO2nanoparticles.

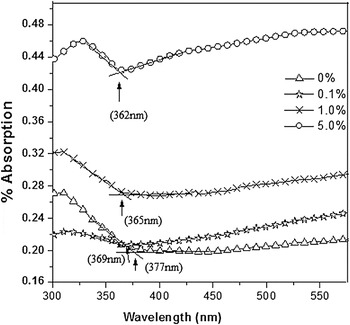
Figure 5 shows the absorption spectra of the TiO2 nanoparticles, which reveal two facts—first, with increase in Al concentration, the absorption edge gets shifted to shorter wave length (blue shift) and, second, there is an increase in absorption from undoped TiO2 to 5.0% Al-doped TiO2. This might be due to larger crystallite size of the undoped nanoparticles than the doped nanoparticles as well as their smoother surface with less number of grain boundaries resulting in less absorption. The appearance of large number of grain boundaries on doping nanoparticles enhance their absorption, which further increases with increase in the dopant concentration.Reference Mingce, Weimin, Heng and Jun20 The incident photons are scattered and lost by absorption; the rate at which the loss takes place will increase as the crystallite size decreases. The band gap energies (E g) of TiO2 nanoparticles were calculated using the below equation [Eq. (2)]Reference Zachariah, Baiju, Shukla, Deepa, James and Warrier21:
 $$$E_{\rm{g}} = {{hc} \over {\bar\mkern-10mu\lambda _{{\rm{int}}} }},$$$
Absorption spectra of TiO2nanoparticles doped with different concentration of Al.

where h is Planck’s constant (4.135 × 10⁻²⁴ eV ns), c the velocity of light (3 × 10⁸ m/s), and  $\,\,\,\mathchar\bar\mkern-10mu\lambda _{{\rm{int}}} $ the wave length (in nm) corresponding to the intersection of extension of linear parts of the spectrum of y-axis and x-axis. From Fig. 5, the energy band gap values for undoped and doped TiO2 nanoparticles are in the range of 3.28–3.42 eV as shown in Table I.
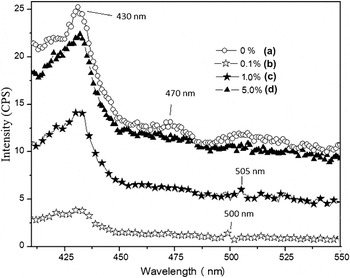
Figure 6 shows the PL spectra of TiO2 nanoparticles with an excitation wave length of 370 nm. As seen from the spectra, a broad peak at 430 nm is observed for all the samples, irrespective of the doping. This emission band originated from charge recombination on the shallow-trap surface states.Reference Das, Sharma, Kumar and De22 These surface states originate from the oxygen vacancies, which act as radiative centers. The peak around 470 nm for undoped TiO2 nanoparticles is due to the oxygen vacancy with two trapped electrons, i.e., F center.Reference Li, Haneda, Hishita and Ohashi23 The peaks around 500 and 505 nm attribute, respectively, to the Al ions in the case of 0.1% and 1.0% doped samples because no such peaks are found for undoped samples. It is difficult to believe that these peak attributed by Al ions due to their low luminescence intensity, but these results are well repeated and checked. No luminescence peak is observed for sample doped with 5.0% of Al; this might be because at higher concentration, Al fills the interstitial sites.Reference Grzmil, Rabe, Kic and Lubkowski14 Further, the PL intensity decreases with Al doping. Therefore, TiO2doped with 0.1% of Al shows the least number of surface defects (oxygen vacancies).
PL emission spectra of (a) 0%, (b) 0.1%, (c) 1.0%, and (d) 5.0% Al-doped TiO2nanoparticles, at an excitation wave length of 370 nm.

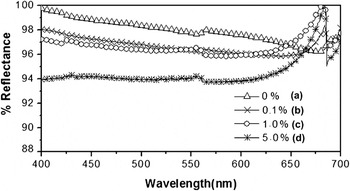
Figure 7 shows the diffuse reflectance spectra of TiO2 nanoparticles. As seen from the spectra, undoped TiO2 nanoparticles show reflectance from 100% to 97.00% in the visible range (400–700 nm). Samples doped with 0.1% and 1.0% of Al show reflectance in the range of 97.00–98.00%, and those, doped with 5.0%, show reflectance in the range of 94.00–97.00%. Thus, it is concluded that with increase in Al concentration from 0% to 5.0%, there is a decrease in the reflectance. These results are also observed in absorption spectra (Fig. 5) as Al doping altered the absorption characteristics of TiO2 nanoparticles. Figure 7 also shows that doped samples have one reflectance edge in the range of 650–680 nm, which might be due to the Al states on the TiO2surface.
Diffuse reflectance spectra of (a) 0%, (b) 0.1%, (c) 1.0%, and (d) 5.0% Al-doped TiO2nanoparticles.

Doping of Al (0.1% and 1.0%) improves the crystal structure of TiO2 by reducing surface defects as well as generating energy states in the TiO2 energy band as observed in PL (Fig. 6). These changes have not been observed in 5.0% Al concentration, and also, no energy state corresponding to Al was found (Fig. 6). Depending upon concentration, Al can be doped in TiO2 lattice in two ways.Reference Gesenhues24 At low concentration of Al3+, it substitutes Ti4+ into the cation sublattice and also creates vacancies in the anion sublattice, whereas at higher concentration, Al3+ is additionally set on interstitial sites, which corresponds to the clustering of Al defect states.Reference Gesenhues and Rentschler25 Therefore, the vacancy at lower concentration and strong segregation at higher concentrations of Al on the surface of TiO2lead to decrease in reflectance.
TiO2 nanoparticles (rutile phase) are mainly used as reflective pigment in reflective coatings, which is an important material for enhancing reflectivity of the light reflectors as well as the reflectance of the laser cavity mirrors.Reference Vurgaftman and Singh10, Reference Wang, Watson, Sung, Tseng, Bouis and Fernando26, Reference Prasad, Pinjari, Pandit and Mhaske27 The photostability of nanoparticles has been found to be more when doped; this ensures longer life of the above devices–in fact, an extremely pertinent result.
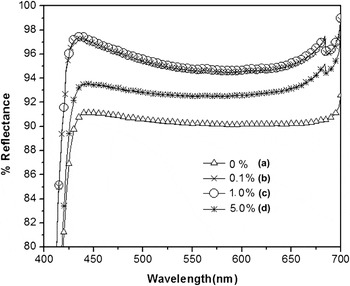
Figure 8 shows the diffuse reflectance spectra of undoped and doped TiO2 nanoparticles exposed to light of 20,000 lux for 100 h. The reflectance spectra of 0.1% and 1.0% doped Al show same reflectance spectra (Fig. 8) from 425 to 700 nm. However, in the wave length region from 400 to 425 nm, absorption is observed for all concentrations–not found in unexposed samples (Fig. 7).
Diffuse reflectance spectra of (a) 0%, (b) 0.1%, (c) 1.0%, and (d) 5.0% Al-doped TiO2nanoparticles exposed to light radiation.

On exposing an undoped sample, the reflectance changes from 91.00% to 92.00% (Fig. 8), which, otherwise, had the reflectance from 97.00% to 100% (Fig. 7). This drastic decrease in reflectance is due to generation of surface defects in TiO2nanoparticles due to exposure to strong illumination, which degrades the photostability of nanoparticles.Reference Jaroenworaluck, Sunsaneeyametha, Kosachan and Stevens28, Reference Mager29
Pure TiO2 gives off atomic oxygen when exposed to visible light and thus serves as an oxidant.Reference Mager29, Reference Whately30 This photooxidation leads to migration of the electrons in the conduction band and holes in the valance band at the surfaceReference Eastaugh, Walsh, Chaplin and Siddall5 along with the formation of free radicals.Reference Grzmil, Rabe, Kic and Lubkowski14 These factors result in increasing absorption and decreasing the reflectance of pure TiO2 nanoparticles on exposure to light. In doped TiO2, Al creates trap states for both electrons and holes (Fig. 6), which were generated under the visible light. This makes TiO2 photostable and prevents deterioration of the reflectance of doped TiO2 nanoparticles. Hence, Al-doped TiO2 is better than pure TiO2. It has also been well reported that mixed-phase nanocrystalline TiO2 with varying rutile content exhibits synergistic effect between anatase and rutile phase.Reference Zachariah, Baiju, Shukla, Deepa, James and Warrier21 This leads to an increase in the photocatalytic activity of the mixture. However, when Al is doped in this mixture, it acts as a quencher of photocatalytic activity but the photostability of mixed-phase TiO2 increases (Fig. 8). High photostability of TiO2nanoparticles ensures longer life of the polymeric coatings; in fact, an extremely pertinent result.
A small peak around 550 nm has been observed for the pure TiO2 nanoparticles in the diffuse reflectance spectra (Fig. 8). This peak is either due to the instrumental disturbance (low signal-to-noise ratio, alignment problems, spatial nonuniformity of the detector, etc.) or characteristics of the sample surface.Reference Hanssen31 Former case can be excluded as the experiment was repeated a number of times to check the instrumental disturbance. Sample surface is the factor most strongly affecting reflectance. Therefore, this small peak in the diffuse reflectance spectra is attributed to the surface inhomogeneity, which alters the reflectance of pure TiO2nanoparticles.
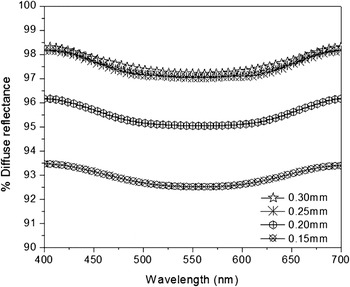
The TiO2 particles doped with 0.1% Al show high diffuse reflectance (Fig. 7) and high photostability (Fig. 8). Therefore, these nanoparticles are used as reflective pigment for the preparation of coating material. Coatings of these nanoparticles have been applied to plastic substrate. Figure 9 shows the diffuse reflectance of the reflectors with various coating thicknesses. The diffuse reflectance has been found to vary from 93.39% to 93.46%, 96.16% to 96.16%, and 98.17% to 98.29%, respectively, for coating thickness 0.15, 0.20, and 0.25 mm showing that the increase in reflectance is due to high coating thickness, as higher the number of nanoparticles on the substrate, more the reflectance. With further increase in thickness, i.e., from 0.25 to 0.30 mm, there is practically no change in the reflectance (98.17–98.29% to 98.29–98.29%). Thus, the coating thickness, 0.25 mm, has been found to be the optimum one. At the optimum coating thickness, the critical volume pigment concentration plays an important role in determining reflectance. The critical volume is the volume above which no substantial difference in the behavior and appearance of the coating is observed.
Diffuse reflectance spectra of designed reflectors with different coating thickness.

IV. SUMMARY
TiO2 nanoparticles with 0.1% Al doping registered maximum photostability, on being exposed to illumination of 20,000 lux. These high photostable nanoparticles have diffuse reflectance 97.00–98.00%. The reflectors, designed with 0.25-mm-thick coating of TiO2(doped with 0.1% Al) nanoparticles, have diffuse reflectance from 98.17% to 98.29%. These high reflecting and photostable nanoparticles are important for enhancing the lifetime of the light reflectors as well as those of laser cavity mirrors.
ACKNOWLEDGMENTS
Sanjeev Kumar is grateful to the Department of Science and Technology, Government of India, for awarding him INSPIRE fellowship to carry out the current research work. Sanjeev Kumar is also thankful to Mr. Gurvinder of Silky Paint Industry, Jalandhar, for valuable discussion and support.