Introduction
The primary intent of cancer treatment is either curative, prolongation of patient life, or to improve patient quality of life. However, cancer treatments are associated with diverse side effects that may impact patient quality of life and depending on the severity may burden the overall, physical and psychological wellbeing of patients. Moreover, the future of psycho-social oncology care is impacted by our ability to understand the importance of patients’ wellbeing and how it is affected by other clinical and psycho-social factors. According to Visser, Reference Visser, Garssen and Vingerhoets1 worsening physical symptoms can make it difficult for some cancer patients to find meaning in life, which may result in an increased likelihood for depression and poor wellbeing. Understanding patients’ wellbeing from the patient’s perspective is essential as it could help enable the provision of the necessary support for patients throughout their cancer journey. Consequently, several patient-reported outcome tools such as the Symptom Distress Scale (SDS), Reference Stapleton, Holden, Epstein and Wilkie2–Reference Yoon, Scarton, Duckworth, Yao, Ezenwa and Suarez4 the Hospital Anxiety and Depression Scale (HADS) Reference Park, Gelber, Rosenberg, Seah, Schapira and Come5–Reference Nipp, Fuchs, El-Jawahri, Mario, Troschel and Greer7 and the Edmonton Symptom Assessment Scale (ESAS) Reference Hui and Bruera8–Reference Bubis, Davis, Canaj, Gupta, Jeong and Barbera11 have become a valuable method for patients to effectively communicate the adverse effects they are experiencing and their overall wellbeing to their healthcare providers. The ESAS is used for self-assessment and evaluation of cancer symptom burden and captures information about nine common symptoms experienced by cancer patients including their overall wellbeing. It is a validated standardised patient-centred symptom assessment tool that is used to evaluate the severity of six physical and two psychological symptoms of distress as well as overall wellbeing related to cancer. Reference Hui and Bruera8,Reference Osei, McKenna, Darko, McKnight and Peters9,Reference Yokomichi, Morita, Nitto, Takahashi, Miyamoto and Nishie12–Reference Delgado-Guay, Parsons, Li, Palmer and Bruera42
The scoring of patient symptom burden using patient-reported outcomes is very subjective, and several studies have attempted to identify associations between the significance of the numerical symptom scores and various thresholds for intervention. Reference McKenzie, Zhang, Chan, Zaki, Razvi and Tsao16,Reference Selby, Cascella, Gardiner, Do, Moravan and Myers22,Reference Butt, Wagner, Beaumont, Paice, Peterman and Shevrin43 McKenzie et al. Reference McKenzie, Zhang, Chan, Zaki, Razvi and Tsao16 used the ESAS responses to characterise the relationship between dyspnoea (i.e., shortness of breath), and concurrent symptoms experienced by advanced cancer patients. Other studies Reference DeMiglio, Murdoch, Ivison, Fageria and Voutsadakis17,Reference Yennurajalingam, Kim, Zhang, Park, Arthur and Chisholm44–Reference Hamer, McDonald, Zhang, Verma, Leahey and Ecclestone49 have also investigated factors associated with wellbeing among cancer patients. A patient’s ESAS overall wellbeing score can be interpreted as their perceived state of overall health Reference Hui and Bruera8 and may be related to the experience and severity of specific symptoms. Reference DeMiglio, Murdoch, Ivison, Fageria and Voutsadakis17,Reference Cheung, Barmala, Zarinehbaf, Rodin, Le and Zimmermann33,Reference Yennurajalingam, Kim, Zhang, Park, Arthur and Chisholm44–Reference Abu-Helalah, Mustafa, Alshraideh, Alsuhail, Almousily and Al-Abdallah46,Reference Basch, Deal, Kris, Scher, Hudis and Sabbatini50 Several studies have reported that the physical (pain, tiredness, nausea, shortness of breath, drowsiness, lack of appetite) and psychological (depression and anxiety) symptoms put a burden on patients’ overall wellbeing and that higher physical and psychological symptom scores are associated with worse overall wellbeing. Reference Lien, Zeng, Zhang, Nguyen, Di Giovanni and Popovic23,Reference Cheung, Le and Zimmermann32,Reference Yennurajalingam, Kim, Zhang, Park, Arthur and Chisholm44,Reference Subbiah, Charone, Roszik, Haider, Vidal and Wong51–Reference Whitford, Olver and Peterson53 According to Lien et al. Reference Lien, Zeng, Zhang, Nguyen, Di Giovanni and Popovic23 , higher scores for lack of appetite, fatigue and drowsiness significantly correlate to worse overall wellbeing. Yennurajalingam et al. Reference Yennurajalingam, Kim, Zhang, Park, Arthur and Chisholm44 also observed that worse overall wellbeing scores are associated with higher scores for fatigue, anorexia and anxiety. Thus, the goal of this study is to analyse patients’ self-reported responses to the ESAS questionnaire and to investigate any correlation between self-reported ESAS overall wellbeing and the other concurrent symptoms experienced and reported on the ESAS questionnaire in our cancer patient population. This will ensure that clinicians, nurses, allied healthcare professionals, etc., are able to understand wellbeing from the patient’s perspective and thus be able to provide the necessary support for patients throughout their cancer journey.
Materials and Methods
In this single-centre retrospective study, we reviewed 201,839 ESAS responses completed by 19,288 cancer patients. Patients visiting the cancer centre complete the ESAS questionnaire as a routine component of their clinic visits to monitor patient-reported symptoms over the course of treatments and follow-ups. Completing the ESAS is considered part of the standard of care, which means that each patient during each out-patient treatment or clinic visit will complete the ESAS questionnaire as a basis for tailoring care. At each visit to the centre, patients are prompted to score the severity of two psychological symptoms (depression and anxiety), six physical symptoms (nausea, shortness of breath, lack of appetite, pain, drowsiness and tiredness) and their overall wellbeing on a numeric scale from 0 to 10, where 0 means complete absence of the symptom or best overall wellbeing and 10 means worst possible symptom or overall wellbeing. Patients’ responses to the ESAS questionnaires from April 1, 2014, to September 30, 2020, were electronically obtained from the OH-CCO database. Patients’ demographics consisting of age, gender, primary disease site, stage and clinical visit type were also collected. Symptom and wellbeing scores were stratified into four categories of no symptom or best wellbeing (0), mild (1–3), moderate (4–6) and severe symptom or worst wellbeing (7–10) consistent with other studies. Reference Hui and Bruera8,Reference Osei, McKenna, Darko, McKnight and Peters9,Reference Bubis, Davis, Canaj, Gupta, Jeong and Barbera11,Reference McKenzie, Zhang, Chan, Zaki, Razvi and Tsao16,Reference Dai, Beca, Guo, Isaranawatchai, Schwartz and Naipaul18–Reference Gill, Daines and Selby26,Reference Salvo, Zeng, Zhang, Leung, Khan and Presutti30,Reference Goyal, Riegert, Davuluri, Ong, Yi and Dougherty36,Reference Tran, Zomer, Chadder, Earle, Fung and Liu39,Reference Newcomb, Nipp, Waldman, Greer, Lage and Hochberg40,Reference Akgün, Krishnan, Feder, Tate, Kutner and Crothers54,Reference Barbera, Seow, Howell, Sutradhar, Earle and Liu55 We calculated the ESAS physical (ESAS-PHY, range: 0–60) symptom distress score by adding the individual scores from each of the six physical symptoms. Similarly, the individual scores from the two psychological symptoms were also summed to generate the ESAS psychological (ESAS-PSY, range: 0–20) symptom distress score. Furthermore, we used the concept of the scoring stratification of 0, 1–3, 4–6 and 7–10 to stratify the summated ESAS symptom scores into low (ESAS-PHY: 0–5, ESAS-PSY: 0–1), mild, (ESAS-PHY: 6–23, ESAS-PSY: 2–7), moderate (ESAS-PHY: 24–41, ESAS-PSY: 8–13) and severe (ESAS-PHY: 42–60, ESAS-PSY: 14–20), consistent with other studies. Reference Osei, McKenna, Darko, McKnight and Peters9,Reference Battaglia, Zerbinati, Piazza, Martino, Provenzano and Esposito13,Reference Dai, Beca, Guo, Isaranawatchai, Schwartz and Naipaul18,Reference Newcomb, Nipp, Waldman, Greer, Lage and Hochberg40,Reference Yennurajalingam, Kim, Zhang, Park, Arthur and Chisholm44
Statistical analysis
Statistical analyses were performed using the IBM SPSS Statistics v. 28.0. To ensure data completeness, we excluded 54,853 ESAS forms (1,471 patients) with incomplete patient responses or if patients entered scores of zero for all the symptoms. Descriptive statistics including means, standard deviations and frequencies were used to summarise patient-reported symptom prevalence and severity. Spearman correlation analyses were conducted among the nine ESAS symptoms to determine strength of correlation between overall wellbeing score and the other eight concurrent ESAS symptoms, with p-value<0·0001 considered statistically significant. The correlation between wellbeing and any concurrent symptoms is considered weak, moderate or strong when the Spearman correlation coefficients are <0·3, 0·3–0·5 or >0·5, respectively, consistent with Cheung et al. Reference Cheung, Le and Zimmermann32 classification of strength of correlations. Univariate and multivariable binary logistic regression analyses were conducted to determine the correlation between concurrent symptoms stratified as none-to-mild or moderate-to-severe and wellbeing stratified as none-to-mild or moderate-to-severe. We tested the multicollinearity between ESAS symptoms by evaluating whether their variance inflation factors were less than 5·0 as reported by Kim Reference Kim56 to ensure the correlation between symptoms is acceptable for statistical analysis and reported the odds ratios (OR) and 95% confidence intervals (CI), with p-value < 0·05 considered statistically significant. ORs greater than 1 indicate higher odds of reporting moderate-to-severe wellbeing when a concurrent symptom is scored at moderate-to-severe, compared to reporting none-to-mild for the concurrent symptom. The multivariable analysis was repeated with concurrent symptoms stratified as none, mild, moderate or severe and wellbeing stratified as none-to-mild or moderate-to-severe and also with wellbeing stratified as none-to-moderate or severe. Furthermore, the receiver operating characteristic (ROC) analysis was also used to identify symptoms that had high diagnostic ability for moderate-to-severe wellbeing score. We reported the area under the ROC curve (AUROC) for each symptom to measure the ability of the symptom to identify a moderate-to-severe score for wellbeing. AUROC < 0·5, 0·5 ≤ AUROC < 0·7, 0·7 ≤ AUROC < 0·9 and AUROC ≥ 0·9 indicate no, low, moderate and high diagnostic ability respectively, consistent with Akobeng. Reference Akobeng57 We conducted principal component analysis (PCA) with varimax rotation and an exploratory factor analysis (EFA) with varimax rotation on the symptoms to identify symptoms which cluster with wellbeing and also to examine inter-relationships among wellbeing and the concurrent symptoms. Components or factors are retained for analysis if their eigenvalue was >0·80 and accounted for ≥10% of the total variance, consistent with other studies. Reference McKenzie, Zhang, Zaki, Chan, Ganesh and Razvi15,Reference Cheung, Le and Zimmermann32,Reference Ganesh, Zhang, Chan, Wan, Drost and Tsao37,Reference Chow, Wan, Pidduck, Zhang, DeAngelis and Chan45,Reference Khan, Cramarossa, Chen, Nguyen, Zhang and Tsao58–Reference Cheung, Le, Gagliese and Zimmermann60 We present the loading scores for each component or factor of each symptom, and symptoms are considered part of a cluster if their loading scores are >0·60, consistent with other studies. Reference Cheung, Le and Zimmermann32,Reference Cheung, Le, Gagliese and Zimmermann60 We used Cronbach’s alpha coefficient to assess the internal consistency and reliability of the derived symptom clusters, where a higher value implies better consistency. Reference McKenzie, Zhang, Zaki, Chan, Ganesh and Razvi15,Reference Ganesh, Zhang, Chan, Wan, Drost and Tsao37,Reference Khan, Cramarossa, Chen, Nguyen, Zhang and Tsao58,Reference Chen, Nguyen, Cramarossa, Khan, Zhang and Tsao61
Results
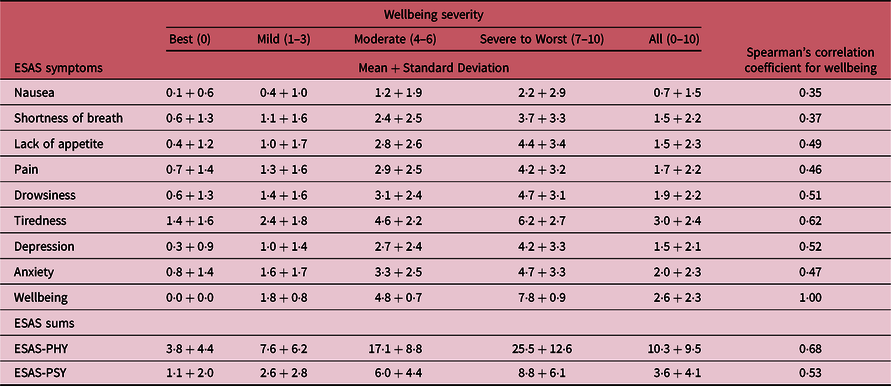
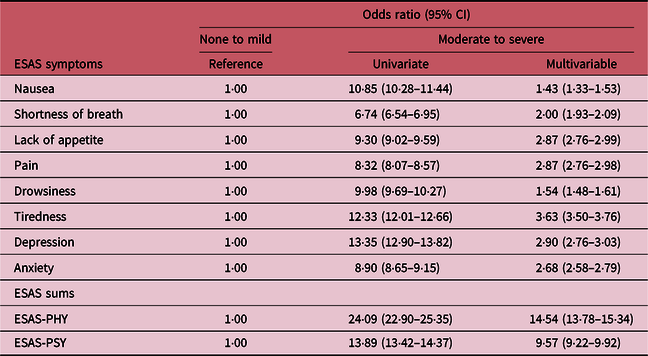
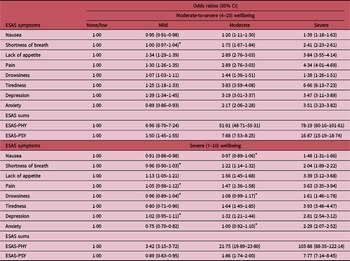
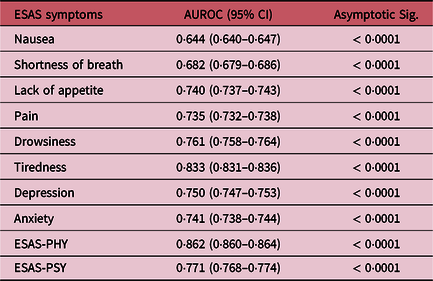
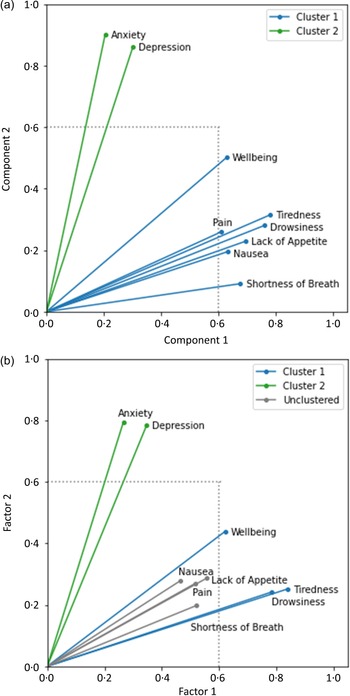
Table 1 shows a summary of the statistical analysis of the symptom severity stratified by wellbeing severity scores of none (0), mild (1–3), moderate (4–6) and severe (7–10). Correlation between wellbeing and the concurrent ESAS symptoms was calculated via the Spearman rank correlation coefficient and is also shown in Table 1. The OR with 95% CI from the univariate and multivariable binary logistic regression analysis comparing wellbeing (none-to-mild or moderate-to-severe) and concurrent symptoms (none-to-mild or moderate-to-severe) are shown in Table 2. Similarly, the OR with 95% CI from the multivariable binary logistic regression analysis comparing wellbeing (none-to-mild or moderate-to-severe, and none-to-moderate or severe) and concurrent symptoms (none, mild, moderate, or severe) are shown in Table 3. Table 4 shows the AUROC with asymptotic 95% CI for reporting moderate-to-severe wellbeing scores for all cancer patients and Table 5 shows the results of the PCA and EFA clustering analyses. The distribution of symptom burden, including prevalence and severity of symptoms for the entire cohort of patients is shown as a stacked bar chart in Figure 1. Figure 2 shows boxplots of the OR with 95% CI from univariate and multivariable binary logistic regression analysis for reporting moderate-to-severe wellbeing when moderate-to-severe is reported for concurrent symptoms compared to reporting none-to-mild for the symptom. The ROC curves for reporting moderate-to-severe wellbeing scores for all patients and the biplots from PCA and EFA are shown in Figures 3 and 4 respectively.
A summary of patient-reported ESAS symptom severity for entire cohort of patients stratified by wellbeing severity (0, 1–3, 4–6 and 7–10) and the Spearman rank correlation coefficient. 0 indicates best possible wellbeing, and 10 indicates worst possible wellbeing. Spearman’s rank correlation coefficients <0·3, 0·3–0·5 and >0·5 indicate a weak, moderate and strong correlation, respectively (Cheung et al., 2009a). The p-values for all of the Spearman correlations are < 0·0001. ESAS-PHY: ESAS total physical symptom score; ESAS-PSY: ESAS total psychological symptom score

The odds ratios (OR) and 95% confidence intervals (CI) from univariate and multivariable binary logistic regression analysis for reporting moderate-to-severe wellbeing when a concurrent symptom is scored as moderate-to-severe compared to reporting none-to-mild for all patients. ORs > 1 indicate higher odds of reporting moderate-to-severe wellbeing when a concurrent symptom is reported as moderate-to-severe. Score of 0–3 (no symptom presence to mild) was used as the reference to calculate the OR for scoring the concurrent symptom as moderate-to-severe. ESAS symptom scores are stratified by none-to-mild (0–3) and moderate-to-severe (4–10). ESAS-PHY scores are stratified by low-to-mild (0–23) and moderate-to-severe (24–60). ESAS-PSY scores are stratified by low-to-mild (0–7) and moderate-to-severe (8–20)

The odds ratios (OR) and 95% confidence intervals (CI) from the multivariable binary logistic regression analysis for reporting moderate-to-severe wellbeing or severe wellbeing when a concurrent symptom is scored as mild, moderate or severe compared to reporting none for all patients. ORs > 1 represent higher odds of reporting moderate-to-severe or severe wellbeing. ORs = 1 represents no effect on the odds of reporting moderate-to-severe or severe wellbeing. Score of 0 (no symptom presence) was used as the reference to calculate the OR for scoring the concurrent symptom as mild, moderate or severe. ESAS symptom scores are stratified by none (0), mild (1–3), moderate (4–6) and severe (7–10). ESAS-PHY scores are stratified by low (0–5), mild (6–23), moderate (24–41) and severe (42–60). ESAS-PSY scores are stratified by low (0–1), mild (2–7), moderate (8–13) and severe (14–20)

* Non-significant (p-value > 0·05).
The area under the ROC (AUROC) curve with asymptomatic 95% confidence interval (CI) for detection of moderate-to-severe wellbeing for all cancer patients. AUROC < 0·5, 0·5 ≤ AUROC < 0·7, 0·7 ≤ AUROC < 0·9, and AUROC ≥ 0·9 indicate no diagnostic ability, low diagnostic ability, moderate diagnostic ability and high diagnostic ability respectively consistent with Akobeng (2006)

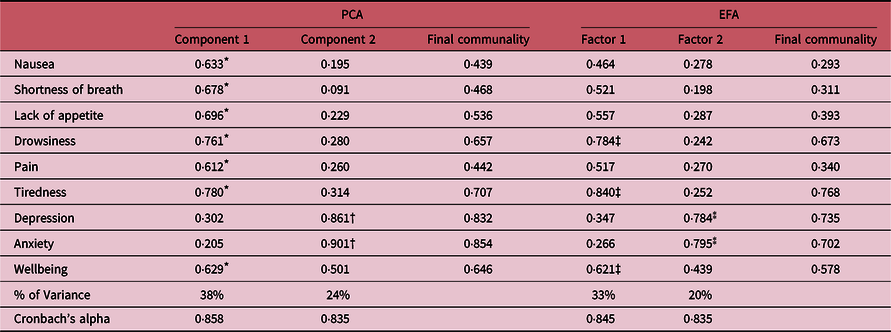
Results from the principal component analysis (PCA) and exploratory factor analysis (EFA) with varimax rotation. Factor loadings and final communality from the PCA and EFA of ESAS symptoms are also shown. Components or factors are retained for analysis if their eigenvalue > 0·80 and accounted for ≥10% of the total variance. Symptoms are considered part of a cluster if their loading scores are >0·60

* Symptoms in the same cluster based on highest loading factor of > 0·6.
† Symptoms in the same cluster based on highest loading factor of > 0·6.
‡ Symptoms in the same cluster based on highest loading factor of > 0·6.
⁑ Symptoms in the same cluster based on highest loading factor of > 0·6.
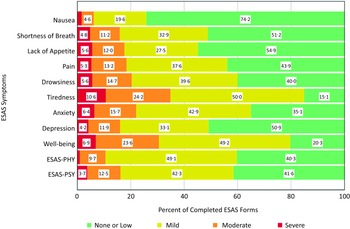
Stacked bar chart of prevalence and severity of ESAS symptoms, ESAS-PHY and ESAS-PSY from patient responses. ESAS symptom scores are stratified as none (0), mild (1–3), moderate (4–6) and severe (7–10). ESAS-PHY scores are stratified as low (0–5), mild (6–23), moderate (24–41) and severe (42–60). ESAS-PSY scores are stratified as low (0–1), mild (2–7), moderate (8–13) and severe (14–20)

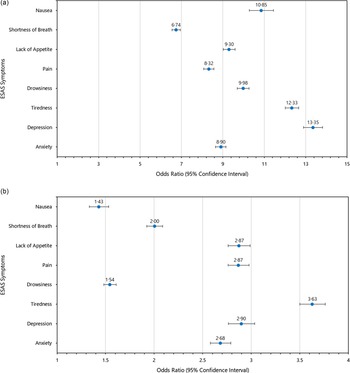
Boxplots of odds ratios (OR) and 95% confidence interval (CI) from the (a) univariate and (b) multivariable binary logistic regression analysis for reporting moderate-to-severe wellbeing when a concurrent symptom is reported as moderate-to-severe compared to reporting none-to-mild for concurrent symptom

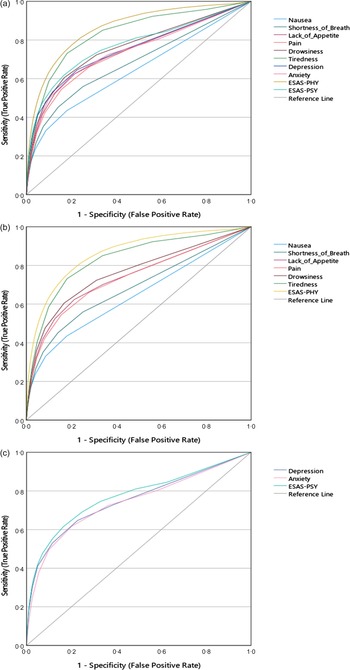
ROC curves for the detection of moderate-to-severe wellbeing (4–10) score for all cancer patients stratified into (a) all ESAS symptoms, (b) ESAS physical symptom and (c) ESAS psychological symptom

Biplots from (a) principal component analysis (PCA) with varimax rotation and (b) exploratory factor analysis (EFA) with varimax rotation to identify symptoms which cluster with wellbeing. A higher correlation between symptoms is represented by lines that are longer and closer together. Symptoms are considered part of a cluster if their loading score > 0·60, as indicated by the dotted grey line

Discussion
The systematic collection of patients’ self-reported symptoms using standardised patient-reported outcome questionnaires such as the ESAS is considered an effective patient-centred care to improve symptom control and patient overall wellbeing. However, managing symptoms can represent a challenge to healthcare professionals as they may result from various factors. Lien et al. Reference Lien, Zeng, Zhang, Nguyen, Di Giovanni and Popovic23 reported that tiredness in cancer patients may be a result of the cancer itself, the treatments, or medications used to control other symptoms (such as pain). Thus, there is a fine balance between controlling symptoms causing distress and introducing new medications that introduce or aggravate others. According to Delgado-Guay et al. Reference Delgado-Guay, Parsons, Li, Palmer and Bruera42 , the presence of psychological symptoms, such as depression, may further complicate symptoms assessments as they have been shown to aggravate physical symptoms. Furthermore, the scoring of patient symptom burden using patient-reported outcomes is very subjective, and a patient’s ESAS overall wellbeing score can be interpreted as their perceived state of overall health or could be related to the experience and severity of specific symptoms. However, by identifying the most significant symptoms contributing to patient wellbeing, symptom management strategies can be developed and optimised to address the pressing needs of patients to improve their overall wellbeing. In this study, we used the patients’ ESAS responses to characterise the relationship between patient-reported overall wellbeing scores and concurrent symptoms experienced by cancer patients.
Physical symptoms correlate with wellbeing
In this study, the physical symptom reported as causing most distress to patients is tiredness and the least distressful symptom is nausea (Figures 1 and 2, Table 1). Other physical symptoms such as drowsiness, lack of appetite, pain and shortness of breath are also reported to have a greater impact on patient overall wellbeing (Figures 1 and 2, Table 1). These observations are consistent with similar studies that have been reported in the literature. Reference Osei, McKenna, Darko, McKnight and Peters9,Reference Yennurajalingam, Kim, Zhang, Park, Arthur and Chisholm44,Reference Yennurajalingam, Palmer, Zhang, Poulter and Bruera62–Reference Goodrose-Flores, Bonn, Klasson, Helde Frankling, Trolle Lagerros and Björkhem-Bergman64 Yennurajalingam et al. Reference Yennurajalingam, Kim, Zhang, Park, Arthur and Chisholm44 used the ESAS patient-reported outcome questionnaire to investigate factors associated with a feeling of wellbeing among 826 advanced lung or non-colonic gastrointestinal cancer patients and observed that patient-reported wellbeing was significantly associated with tiredness. Wilding et al. Reference Wilding, Downing, Wright, Selby, Watson and Wagland63 also investigated the associations between cancer-related symptoms, health-related quality of life and poor psychological outcomes in 13,097 prostate cancer patients treated with androgen deprivation therapy (ADT) and reported that clinically significant tiredness was strongly associated with poor wellbeing in patients.
Measures of central tendency and spearman correlation analysis
The ESAS responses show that patients reporting severe (7–10) wellbeing also scored high mean scores for tiredness (6·2 ± 2·7), drowsiness (4·7 ± 3·1) and lack of appetite (4·4 ± 3·4) (Table 1) as the symptoms causing most impact on their wellbeing. Analysis of the Spearman correlation indicated that all the physical symptoms are significantly (p-value < 0·0001) positively correlated to poor wellbeing, indicative of worsening wellbeing as concurrent symptom severity increases. The Spearman correlation data show that the physical symptoms strongly correlated to patient overall wellbeing are tiredness (0·62) and drowsiness (0·51). We also observed that the ESAS-PHY (0·68) is very strongly correlated with the overall wellbeing (Table 1), suggesting that using the summated ESAS physical symptoms (ESAS-PHY) may be a better indicator of a patient’s overall wellbeing compared to using the individual physical symptoms scores. Several studies Reference Lien, Zeng, Zhang, Nguyen, Di Giovanni and Popovic23,Reference Cheung, Le and Zimmermann32,Reference Ganesh, Zhang, Chan, Wan, Drost and Tsao37,Reference Chow, Wan, Pidduck, Zhang, DeAngelis and Chan45,Reference Chow, Fan, Hadi and Filipczak59 that have investigated factors most predictive of patient wellbeing using the ESAS responses have also reported lack of appetite, tiredness and drowsiness as the symptoms having the strongest correlations to patients’ wellbeing.
Univariate and multivariable analysis
The analysis of the univariate and multivariable binary logistic regression models show OR > 1 (Figure 2, Table 2), indicative of higher odds for patients reporting moderate-to-severe wellbeing when they report moderate-to-severe in concurrent symptoms. When we re-analyse the univariate and multivariable models to determine the odds of reporting severe or moderate-to-severe wellbeing when patients report mild, moderate or severe for concurrent symptoms compared to patients reporting no symptoms, we still found OR > 1 for almost all the symptoms (Table 3). The data show a significant (p-value<0·05) relationship between reporting moderate-to-severe (4–10) wellbeing and moderate-to-severe scores in the ESAS concurrent symptoms (Figure 2, Table 2). In the multivariable model, the most predictive physical symptoms are tiredness (OR = 3·63), pain (OR = 2·87) and lack of appetite (OR = 2·87) (Figure 2, Table 2). Thus, patients reporting ESAS scores ≥4 for tiredness, pain or lack of appetite are more likely to report moderate-to-severe wellbeing. Consequently, the severity (i.e., worse distress) of physical symptoms is indicative of the severity of a patient’s overall wellbeing (i.e., worse wellbeing), and the three strongest predictors of severe wellbeing are tiredness, pain and lack of appetite. These observations are consistent with other similar studies that have been reported in the literature. Reference Osei, McKenna, Darko, McKnight and Peters9,Reference Lien, Zeng, Zhang, Nguyen, Di Giovanni and Popovic23,Reference Yennurajalingam, Kim, Zhang, Park, Arthur and Chisholm44,Reference Chow, Wan, Pidduck, Zhang, DeAngelis and Chan45,Reference Yennurajalingam, Palmer, Zhang, Poulter and Bruera62–Reference Goodrose-Flores, Bonn, Klasson, Helde Frankling, Trolle Lagerros and Björkhem-Bergman64
Receiver operating characteristics (ROC) analysis
Results from the ROC analysis show the AUROC ranging from 0·644 for nausea to 0·833 for tiredness. The ESAS-PHY had a greater AUROC of 0·862 indicating that the ESAS-PHY may be better at predicting moderate-to-severe wellbeing than using the individual ESAS symptoms scores. Thus, suggesting that the ESAS-PHY could potentially be used to identify patients that are experiencing moderate-to-severe wellbeing. According to Akobeng, Reference Akobeng57 AUROC < 0·5, 0·5 ≤ AUROC < 0·7, 0·7 ≤ AUROC < 0·9 and AUROC ≥ 0·9 indicate no, low, moderate and high diagnostic ability, respectively. Thus, the symptoms with relatively higher predictive power for moderate-to-severe wellbeing are tiredness, drowsiness, lack of appetite and pain. These results suggest that the ESAS nausea score is a poor indicator of patients scoring moderate-to-severe wellbeing and tiredness is an excellent indicator of moderate-to-severe wellbeing consistent with other studies. Reference Osei, McKenna, Darko, McKnight and Peters9,Reference Lien, Zeng, Zhang, Nguyen, Di Giovanni and Popovic23,Reference Yennurajalingam, Kim, Zhang, Park, Arthur and Chisholm44,Reference Chow, Wan, Pidduck, Zhang, DeAngelis and Chan45,Reference Yennurajalingam, Palmer, Zhang, Poulter and Bruera62–Reference Goodrose-Flores, Bonn, Klasson, Helde Frankling, Trolle Lagerros and Björkhem-Bergman64
Psychological symptoms correlate with wellbeing
Psychological symptoms, such as depression and anxiety, are commonly reported in cancer patients, especially those in advanced stages. In this study, we observed that patients reported depression as causing less distress compared with most of the physical symptoms, yet it was still a highly predictive factor of wellbeing, suggesting that even low depression scores as reported by patients in ESAS contribute significantly to overall wellbeing. According to Delgado-Guay et al. Reference Delgado-Guay, Parsons, Li, Palmer and Bruera42 , depressive symptoms can lead to general worsening of wellbeing for patients.
Measures of central tendency and spearman correlation analysis
Analysis of the ESAS responses shows that patients reporting severe (7–10) wellbeing also scored high mean scores for anxiety (4·7 ± 3·3) (Table 1) as the psychological symptoms causing most impact on their wellbeing. Results of the Spearman correlation show that both anxiety and depression are significantly (p-value < 0·0001) correlated to wellbeing, suggesting worsening patient wellbeing as psychological symptom severity increases. However, the Spearman correlation analysis shows that the psychological symptom most strongly correlated to wellbeing is depression (0·52), and anxiety is moderately correlated (0·47) to wellbeing. Similar to the summated ESAS physical symptoms score, the summated ESAS psychological (ESAS-PSY) score (0·53) is shown to be better correlated with wellbeing (Table 1), than the individual depression or anxiety scores, and therefore may be a better predictor of a patient’s overall wellbeing compared to using the individual psychological symptoms scores. Our results are in agreement with other studies Reference DeMiglio, Murdoch, Ivison, Fageria and Voutsadakis17,Reference Lien, Zeng, Zhang, Nguyen, Di Giovanni and Popovic23,Reference Cheung, Le and Zimmermann32,Reference Ganesh, Zhang, Chan, Wan, Drost and Tsao37,Reference Chow, Wan, Pidduck, Zhang, DeAngelis and Chan45,Reference Chow, Fan, Hadi and Filipczak59 that have studied the psychological symptoms most predictive of patient wellbeing and have reported depression followed by anxiety.
Univariate and multivariable analysis
Results from the univariate and multivariable binary logistic regression analysis suggest a highly significant relationship between moderate-to-severe wellbeing score and moderate-to-severe score in the psychological symptoms (Figure 2, Table 2). Both the univariate and the multivariable models show that the most predictive psychological symptom for moderate-to-severe wellbeing is depression followed by anxiety. Thus, patients reporting moderate-to-severe for depression (OR = 2·90) and anxiety (OR = 2·68) are at higher odds for reporting moderate-to-severe overall wellbeing compared to patients who reported those symptoms as none-to-mild. Consequently, the severity of the psychological symptoms is predictive of the severity of a patient’s overall wellbeing. These observations are consistent with similar studies and have been reported in the literature. Reference DeMiglio, Murdoch, Ivison, Fageria and Voutsadakis17,Reference Lien, Zeng, Zhang, Nguyen, Di Giovanni and Popovic23,Reference Salvo, Zeng, Zhang, Leung, Khan and Presutti30,Reference Cheung, Le and Zimmermann32,Reference Ganesh, Zhang, Chan, Wan, Drost and Tsao37,Reference Chow, Wan, Pidduck, Zhang, DeAngelis and Chan45,Reference Chow, Fan, Hadi and Filipczak59
Receiver operating characteristics (ROC) analysis
Results from the ROC analysis show the AUROC for depression, anxiety and ESAS-PSY are 0·750, 0·741 and 0·771, respectively. Thus, depression is a stronger predictor of moderate-to-severe wellbeing compared to anxiety, although the ESAS-PSY with a higher AUROC value may be a better predictor of patient moderate-to-severe wellbeing.
Symptom clusters associated with wellbeing
We also conducted PCA with varimax rotation and EFA with varimax rotation on the symptoms to identify symptoms which cluster with wellbeing and also to examine whether any inter-relationships existed among wellbeing and the concurrent symptoms. The PCA method identified two clusters: the first being nausea, shortness of breath, lack of appetite, drowsiness, pain, tiredness and wellbeing which accounted for 38% of the total variance and the second cluster being depression and anxiety accounting for 24% of the total variance (Figure 4, Table 5). However, the EFA identified tiredness, drowsiness, and wellbeing as one cluster that accounted for 33% of the total variance and a second cluster composed of depression and anxiety which accounted for 20% of the total variance (Table 5). The EFA method did not identify nausea, shortness of breath, lack of appetite and pain as a cluster based on a loading factor threshold of <0·6. The PCA data revealed that wellbeing clustered with all the physical symptoms, whereas the EFA data show that wellbeing clustered mainly with tiredness and drowsiness, consistent with our other analyses in this study (Figure 4, Table 5). The internal reliabilities of the clusters using Cronbach’s alpha coefficient are all acceptable and range from 0·83 to 0·86 (Table 5). These observations are consistent with similar studies and have been reported in the literature. Reference DeMiglio, Murdoch, Ivison, Fageria and Voutsadakis17,Reference Lien, Zeng, Zhang, Nguyen, Di Giovanni and Popovic23,Reference Salvo, Zeng, Zhang, Leung, Khan and Presutti30,Reference Cheung, Le and Zimmermann32,Reference Ganesh, Zhang, Chan, Wan, Drost and Tsao37,Reference Chow, Wan, Pidduck, Zhang, DeAngelis and Chan45,Reference Chow, Fan, Hadi and Filipczak59
Strengths and limitations
Our study had several strengths pertaining to the large number of patients to improve its generalisability with balanced proportions between male and female patients, and a wide range of patients’ ages. Furthermore, the data included patients from various primary disease sites and visits from differing clinical care settings. Moreover, the ESAS is a well-validated patient-reporting tool which has been used successfully in several oncologic settings, and in situations where patients may be computer-inexperienced, volunteers were available to assist in completion of the questionnaire. Our study however had some limitations, as the ESAS responses are a generic assessment and not symptom-specific, and the symptoms are only quantitatively evaluated. The symptom severities in this study were evaluated based on ESAS intensity scores alone, and differences in symptom reporting may not necessarily reflect the true differences in the symptom being experienced by the patient. ESAS completion is also voluntary, so some patients may be more likely to complete it than others depending on factors such as health literacy or ability to self-manage symptoms.
Conclusion
The ESAS symptom assessment scale provides meaningful and clinically useful information regarding symptoms and the overall wellbeing of patients. Our study suggests that patients’ overall wellbeing as reported by the ESAS assessment questionnaire is influenced by a number of concurrent symptoms. The physical symptoms observed to have the most impact on patients’ overall wellbeing are tiredness, pain, drowsiness and lack of appetite, and the symptom which had the least impact on wellbeing is nausea. Our data also suggest that the ESAS-PHY and the ESAS-PSY sums are very strongly correlated with overall patient’s wellbeing, an indication that using the summated ESAS physical and psychological symptoms scores may be better predictors of a patient’s overall wellbeing compared to using the individual symptoms scores. Identifying the most important symptoms affecting patients’ overall wellbeing is very important in cancer care and will enable clinicians and healthcare providers to develop and provide appropriate symptom-directed patient-focused interventions to improve patient’s wellbeing. In our clinical practice, the patient-reported ESAS response is used for symptom screening and monitoring, and the results are reviewed by clinicians to establish baselines in patients’ symptoms and/or to trigger further in-depth patient assessments. The assessments may lead to an intervention at the clinic level or may result in a referral to the appropriate services such as pain and symptom management, psychiatry, registered dietitian, social worker or spiritual care.
Acknowledgements
The authors would like to acknowledge with much gratitude the support from OH-CCO staff for supplying the data. We also would like to express our gratitude to the Medical Physics staff at Grand River Cancer Centre for their support for the students during this study.
Financial support
None.
Competing interests
The authors declare that the research was conducted in the absence of any commercial or financial relationships that could be construed as a potential conflict of interest.
Ethics approval
This study was approved by the Tri-Hospital Research Ethics Board.