I. INTRODUCTION
Magnesium and its alloys of low density and high specific strength are very attractive for applications in transportations and aerospace industries.Reference Kulekci1–Reference Pan, Wang, Jiang, He, Chai and Xu3 However, due to its hexagonal close-packing structure, magnesium suffers from brittleness and limited formability at room temperature.Reference Smola, Stulıková, von Buch and Mordike4–Reference Janeček, Král, Dobroň, Chmelík, Šupík and Holländer6 The most common method to strengthen magnesium alloys is to introduce precipitates through alloying.Reference Huang, Yuan, Chen, Ding and Wang7–Reference Tian, Huang, Yuan and Ding9 Among the various magnesium alloy systems, the Mg–Zn-RE, where RE is Y or other rare-earth element, contains a thermally stable icosahedral quasicrystal phase (I-phase) of composition Mg3Zn6RE.Reference Hono, Mendis, Sasaki and Oh-ishi10,Reference Kang, Wang, Deng, Nie, Bai and Li11 Yasi et al. investigated multiple kinds of substitutional solutes in magnesium and found that the addition of rare-earth element Y led to the strongest reduction in the thermal cross-slip stress.Reference Yasi, Hector and Trinkle12 Huang et al.Reference Huang, Yuan, Wang, Chen and Ding13 prepared Mg–Zn–Gd alloys containing the icosahedral quasicrystal phase Mg3Zn6Gd and indicated that the I-phase could promote grain refinement. Other interesting properties introduced by the formation of I-phase include low surface energy and coefficient of friction, high corrosion resistance, high hardness and high-temperature mechanical properties, etc.Reference Huang, Yuan, Chen, Ding and Wang7,Reference Huang, Yuan, Wang, Chen and Ding13–Reference Medina, Perez, Garces and Adeva15 Bae et al. developed two Mg-rich Mg–Zn–Y alloys, Mg97.8Zn2Y0.2 and Mg95Zn4.3Y0.7 in at.% and found that the formation of stable quasicrystalline particles could provide the stable particle/matrix interface.Reference Bae, Kim and Kim16 However, they are not focused on the influence of trace addition of Y on the volume fraction of I-phase. Since minor rare-earth elements can reduce the consumption of alloying elements and the production cost, the effect of trace Y addition on the volume fraction of I-phase needs to be systematically investigated.
As one of the cost-effective methods for mass-producing profiles, hot extrusion was the frequently used deformation way for magnesium alloys. After hot extrusion or other conventional deformation, the significant improvement of mechanical properties in the magnesium alloy can be related to the remarkably refined grains and the fine precipitates.Reference Kang, Wang, Deng, Nie, Bai and Li11,Reference Li, Deng, Zhang, Nie and Xu17–Reference Xin, Hong, Feng, Yu, Wu and Liu20 Lee et al. have used hot rolling at 673 K for the Mg–Zn–Y alloys consisted of I-phase and α-Mg and found that a wide range of strength and ductility could be obtained by changing the total solute content of Zn and Y.Reference Lee, Lim, Kim, Kim and Kim21 Singh et al. reported that superior mechanical properties with high ductility at room and elevated temperatures have been achieved for the as-extruded alloys corresponding to compositions Mg95Zn4.2Y0.8 and Mg92.5Zn6.4Y after extrusion at a relatively lower temperature of 523 K.Reference Singh, Nakamura, Watanabe, Kato and Tsai22 But none of these studies has looked specifically at the variation of I-phase resulting from low Y content particularly at trace content below 0.2 at.%. Furthermore, large-sized dendritic I-phase in the as-cast alloy can be broken into microscale particles after hot deformation.Reference Huang, Yuan, Wang, Chen and Ding13,Reference Tian, Huang, Yuan, Chen, Wang and Ding19,Reference Huang, Tian, Yuan, Chen, Ding and Wang23 With regard to the addition of minor Ca, previous studies indicate that it can prevent overheating and improve the oxidation resistance during the melting process of magnesium alloys.Reference Du, Zheng, Qiao, Wang, Peng, Wu and Jiang24 The addition of minor Ca to the Mg–Zn-RE alloys is also beneficial to grain refinement during the extrusion process.Reference Du, Qiao, Zheng, Wu and Xu25,Reference Du, Qiao, Zheng, Wu and Xu26 Therefore, three Mg-rich Mg–Zn–Y–Ca alloys each containing different amounts of I-phase have been prepared by trace addition of Y. Moreover, through a large number of literature search, the effect of trace Y addition on the volume fraction of I-phases, the microstructure, and mechanical properties for the as-cast and as-extruded Mg–Zn–Y–Ca alloys has not reached a complete understanding.
Accordingly, to understand the dependence of mechanical properties of Mg–Zn–Y–Ca alloys on the volume fraction of I-phase, in this study, three alloys with the trace addition of Y and the same Zn/Y ratio were prepared and subjected to hot extrusion. The dependence of microstructure and mechanical properties on the volume fraction of a reinforcing icosahedral phase (microsized and nanosized I-phase) was investigated.
II. MATERIALS AND METHODS
Commercially pure Mg (99.9%), pure Zn (99.9%), pure Ca (99.99%), and the Mg–30 wt% Y master alloy supplied by Wenxi Yinguang Magnesium Industry Co., Ltd., Yuncheng, China, were melted at 1023 K in an electric resistance furnace under a mixed gas atmosphere of 1 vol% SF6 and 99 vol% CO2. The melts were stirred and held at 993 K for 10 min, and then poured into a cylindrical steel mold with an inner diameter of 40 mm. The as-cast ingots were machined into a cylinder with the diameter of 38 mm and height of 50 mm and homogenized at 673 K for 8 h. Then the alloys were preheated to 503 K and held for 30 min, and extruded at 503 K with a reduction ratio of 16 and a speed of 0.1 mm/s. The chemical compositions (at.%) of the fabricated alloys in this paper were Mg–0.91Zn–0.11Y–0.12Ca (denoted as ZYC-1), Mg–1.38Zn–0.17Y–0.12Ca (denoted as ZYC-2), and Mg–2.09Zn–0.26Y–0.12Ca (denoted as ZYC-3). The addition of Ca with the same content of 0.12 at.% was aimed to prevent overheating and improve the oxidation resistance during the melting process. The content of Y ranges from 0.11 to 0.26 at.% with the same Zn/Y ratio of ∼8 for the three alloys.
Specimens for optical microscopy (OM) and scanning electron microscopy (SEM) were ground, mechanically polished, and etched in a solution of oxalic acid (4 g oxalic + 100 mL deionized water). Thin slices for transmission electron microscopy (TEM) were prepared using a standard combination of mechanical thinning and ion-beam milling techniques. Samples for OM and SEM analysis were all cut along the extrusion direction (ED). Both the average size and volume fraction of the precipitates were calculated by Image-Pro Plus (IPP) software, Media Cybernetics, Bethesda, Maryland. The values for the precipitate size and volume fraction were obtained by measuring four OM and SEM images at high magnification, respectively. The average grain size and volume fraction of both dynamically recrystallized (DRXed) grains were also calculated by IPP software. The volume fraction of DRXed grains (V DRX) for the three alloys are defined as followsReference Deng, Wang, Zheng and Wu27: 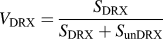 ${V_{{\rm{DRX}}}} = {{{S_{{\rm{DRX}}}}} \over {{S_{{\rm{DRX}}}} + {S_{{\rm{unDRX}}}}}}$, where S DRX and S unDRX stand for the area of DRXed and unDRXed regions, respectively. The chemical compositions of the precipitated phases were analyzed by X-ray diffraction (XRD) and SEM equipped with an energy dispersive spectrometer (EDS). The texture of the extruded alloy was determined by using a Rigaku D/max-2400 X-ray diffractometer, Rigaku Corporation, Tokyo, Japan. The pole figures were obtained and the texture data were analyzed using a PANalytical X’Pert Texture, PANalytical company, Almelo, the Netherlands. Tensile tests were performed using an Instron Series 3369 test machine (Instron, Norwood, Massachusetts) under a constant cross-head speed with a speed of 0.5 mm/min at ambient temperature. The tensile specimens were cut parallel to the ED with a gauge length of 15 mm and a cross-sectional area of 6 mm × 2 mm.
III. RESULTS
A. Microstructures of as-cast Mg–Zn–Y–Ca alloys
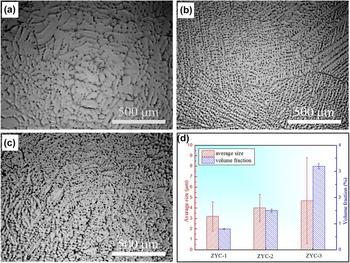
The optical microstructures of the as-cast Mg–Zn–Y–Ca alloys with different Y and Zn contents are shown in Figs. 1(a)–1(c). The grain size of the as-cast ZYC-1 alloy is about 750 μm, which is larger than that of the ZYC-2 and ZYC-3 alloys with a grain size of 400–500 μm. The average size and volume fraction of the second phase are shown in Fig. 1(d). As the contents of the Zn and Y further increase, the amount and the size of the second phase particle increases. Besides, some plate-like phases generate along grain boundaries and connect into semicontinuous phase for the ZYC-3 alloy.
Optical micrographs of different as-cast alloys: (a) ZYC-1, (b) ZYC-2, (c) ZYC-3, and (d) corresponding phase size and volume fraction.

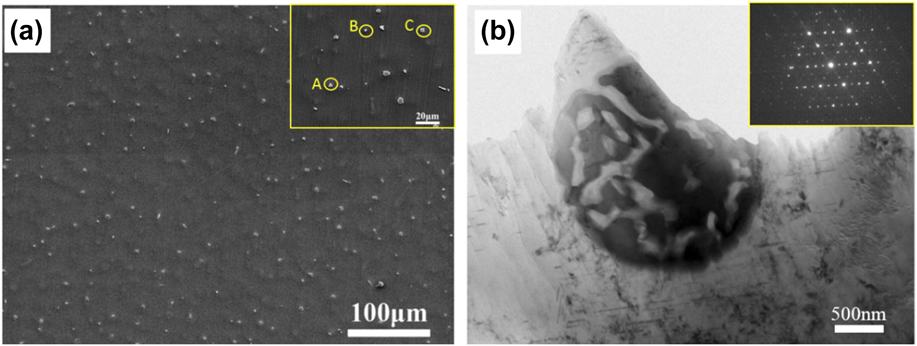
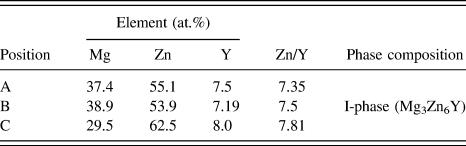
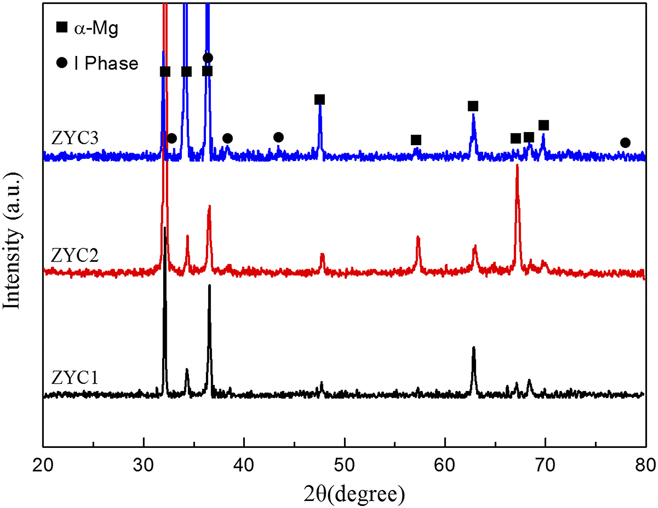
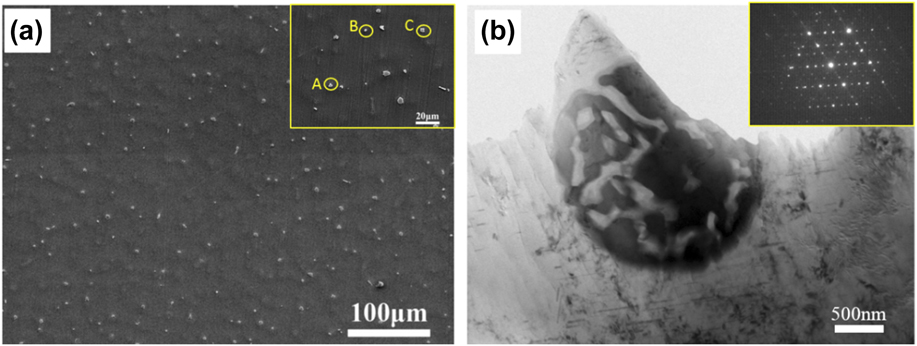
Figure 2 gives the SEM and TEM images of the as-cast ZYC-2 alloy. Table I shows the EDS analysis results of the second phases annotated by the yellow letter in Fig. 2(a) for the as-cast ZYC-2 alloys. According to the previous studies,Reference Shao, Varsani and Fan28,Reference Gröbner, Kozlov, Fang, Geng, Nie and Schmid-Fetzer29 Mg–Zn–Y ternary phases mainly included I-phase (Mg3Zn6Y), W-phase (Mg3Zn3Y2), H-phase (Mg15Y15Zn70), and LPSO phase. Based on the EDS analysis results (Table I), the atomic ratios of Zn and Y are close to the I-phase for the ZYC-2 alloy. The crystal structure of the second phase in the as-cast ZYC-2 alloy was further analyzed using TEM. As shown in Fig. 2(b), the bright field TEM image indicates that the second phase in the as-cast ZYC-2 alloy possesses the lamellar structure. Moreover, selected area electron diffraction (SAED) patterns of the second phase could be indexed according to a 3-fold symmetry structure. Thus, the second phase in the as-cast ZYC-2 alloy can be confirmed to be the icosahedral quasicrystal phase (I-phase). The compositions of all the as-cast alloys are further analyzed by XRD as shown in Fig. 3. It can be proved by the XRD results that the peaks are associated with α-Mg and I-phases, which is consistent with the EDS and TEM results.
SEM images of (a) as-cast ZYC-2 alloys and (b) TEM images of the particle-like phase in the ZYC-2 alloy.
EDS results in Fig. 2.

XRD patterns of as-cast Mg–Zn–Y–Ca alloys.

B. Microstructures of as-extruded Mg–Zn–Y–Ca alloys
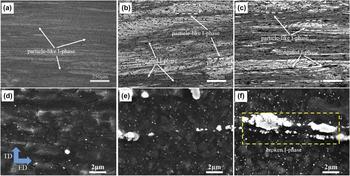
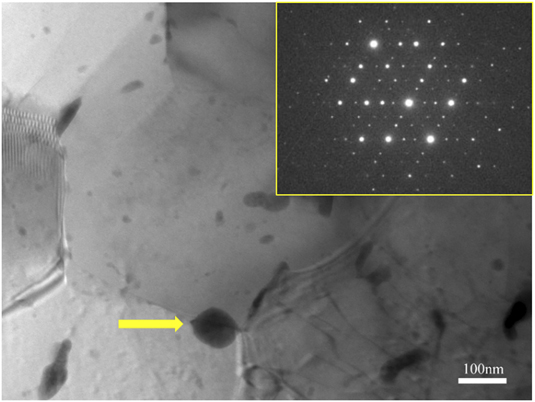
Figure 4 shows the optical microstructures and SEM images of the as-extruded Mg–Zn–Y–Ca alloys. Compared with the as-cast alloy (Fig. 1), the grains have been remarkably refined after extrusion due to the occurrence of dynamic recrystallization as shown in Figs. 4(a)–4(c). Meanwhile, bimodal grain structures can be observed in all the as-extruded alloys, which are consisted of DRXed areas with fine grains and unDRXed regions with elongated strips. The average size of dynamic recrystallized grains decreases from ∼2.20 μm (ZYC-1 alloy) to ∼0.90 μm (ZYC-2 alloy), then slightly decreases to ∼0.89 μm (ZYC-3 alloy). With increasing the contents of Zn and Y, the volume fraction of DRXed grains decreases from 89.6% (ZYC-1 alloy) to 65.8% (ZYC-2 alloy) and then increases to 78.0% (ZYC-3 alloy). Besides, I-phase particles are still evenly distributed in the as-cast ZYC-1 and ZYC-2 alloys after extrusion. For the as-extruded ZYC-3 alloy, some plate-like phases formed in the as-cast condition are elongated along the ED. SEM images of the as-extruded alloys are given in Figs. 4(d)–4(f). It can be seen that nanosized second phases precipitate homogeneously in the complete recrystallization zone after extrusion. TEM was used to identify the crystal structure of the newly formed nanosized ellipsoidal precipitates. As shown in Fig. 5, the bright field TEM image of the as-extruded ZYC-2 alloy and the SAED patterns indicate that the nanosized phase marked by arrow could be indexed according to a 3-fold symmetry structure. Thus, the precipitated nanosized phase can be confirmed to be the I-phase. The volume fractions of the nanosized I-phases are 1.5% (ZYC-1 alloy), 2.3% (ZYC-2 alloy), and 6.9% (ZYC-3 alloy), and the average sizes are 104 ± 52 (ZYC-1 alloy), 108 ± 32 (ZYC-2 alloy), and 122 ± 50 nm (ZYC-3 alloy).
Optical microstructures and SEM images of extruded alloys at 503 K and 0.1 mm/s. (a) and (d) ZYC-1, (b) and (e) ZYC-2, and (c) and (f) ZYC-3.

TEM image and SAED pattern of precipitate marked by yellow arrow in the as-extruded ZYC-2 alloy.

C. Mechanical properties
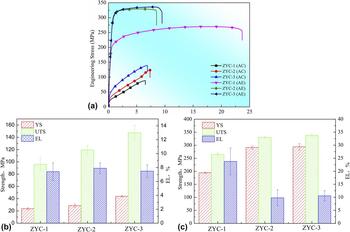
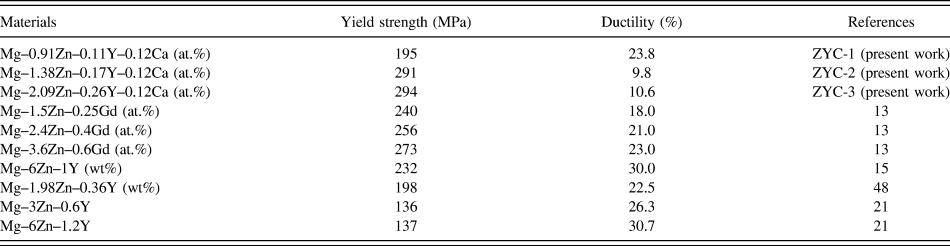
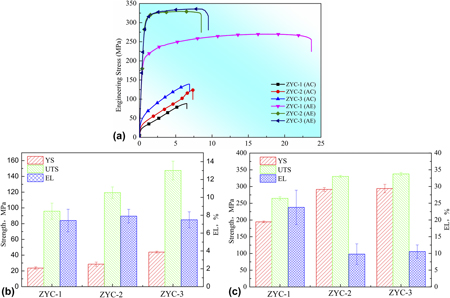
Figure 6(a) shows the engineering stress–engineering strain curves of the as-cast and as-extruded alloys. The yield strength (YS), ultimate tensile strength (UTS), and elongation (EL) are summarized in Figs. 6(b) and 6(c). As shown in Fig. 6, the YS of the as-cast alloy changes from ∼24 MPa (ZYC-1 alloy) to ∼43 MPa (ZYC-3 alloy) while the UTS varies from ∼95 MPa (ZYC-1 alloy) to ∼147 MPa (ZYC-3 alloy). Meanwhile, the EL of all three alloys in the as-cast condition is almost the same with a moderate ductility of ∼7%. After extrusion, the YS and UTS of the three alloys are significantly increased. There is a substantial increase in the strength from the as-extruded ZYC-1 to ZYC-2 alloy. Besides, it is worth noting that the maximum YS of 294.0 MPa is gained in the ZYC-3 alloy while the highest ductility of ∼23.8% is obtained in the as-extruded ZYC-1 alloy. The comparison of tensile properties between present as-extruded Mg–Zn–Y–Ca alloys and previous as-extruded Mg–Zn-RE alloys is depicted in Table II. The YS of the ZYC-2 and ZYC-3 alloys is higher than that of the previous Mg–Zn-RE alloys with similar alloy content. At the same time, the EL of the ZYC-1 alloy is comparable to that of the Mg–3Zn–0.6YReference Lee, Lim, Kim, Kim and Kim21 while the YS is increased.
(a) Engineering strain–stress curves and tensile strength of as-cast and as-extruded alloys; tensile strength of (b) as-cast and (c) as-extruded alloys (AC represents the as-cast alloys while AE represents the as-extruded alloy).

Comparison of tensile properties between present as-extruded Mg–Zn–Y–Ca alloys with previous as-extruded Mg–Zn-RE alloys.

IV. DISCUSSION
The microstructure and mechanical properties of three Mg–Zn–Y–Ca alloys containing trace Y and the same content ratio of Zn/Y are investigated in the present paper. The increase in the content of Zn and Y leads to the different volume fractions of the icosahedral quasicrystal phase formed during the casting and extrusion processing. The relationship between the mechanical properties, the microstructure, and the contents of Zn and Y is discussed in detail as follows.
A. Effect of Zn and Y contents on the microstructure of Mg–Zn–Y–Ca alloys
For the as-cast Mg–Zn–Y–Ca alloy, the second phase was identified as the I-phase as described in Sec. III.A. The addition of minor Ca (0.12 wt%) is aimed to prevent overheating and improve the oxidation resistance without the introduction of new phase. As the contents of the Zn and Y further increase, the amount and the size of the second phase particle increase. Besides, some plate-like phases generate along grain boundaries and connect into the semicontinuous phase for the ZYC-3 alloy. With increasing the content of Zn and Y, the amount and the size of the second phase particle increase. For the ZYC-3 alloy, some plate-like phases generate along grain boundaries and connect into semicontinuous phase. The average size of dynamic recrystallized grains is ∼2.20 μm for the ZYC-1 alloy and decreases to ∼0.89 μm for the ZYC-3 alloy. The decrease in the average size of dynamic recrystallized grains for the present Mg–Zn–Y–Ca alloys can be attributed to the following reasons. On the one hand, the second phases greater than ∼1 μm can act as nucleation sites for dynamic recrystallization due to the high dislocation density around them.Reference Kim, Jung, You and Park30 The number of I-phases larger than ∼1 μm in the as-cast alloy increases with increasing the contents of Zn and Y. Thus, these microsized I-phases can provide more nucleation sites by particle-stimulated nucleation and promote the recrystallization processing.Reference Tahreen, Zhang, Pan, Jiang, Li and Chen31 On the other hand, for the Mg alloys containing the RE element, the RE element tends to segregate around the grain boundaries.Reference Basu, Pradeep, Miessen, Barrales-Mora and Al-Samman32–Reference Shi, Chen and Ke35 Thus, the pining effect by the addition of Y can restrain the growth of newly formed dynamic recrystallized grains. For the ZYC-2 and ZYC-3 alloys with higher Y content, this pinning effect seems more effective, leading to a finer grain size. Besides, the nanosized precipitates can also pin the grain boundaries, but the size of precipitates increases with the increase of Zn and Y, so the pinning effect of the nanosized I-phase for the three alloys can be considered to a relatively minor role. Furthermore, the addition of Ca with the same content of 0.12 at.% for the three alloys was aimed to prevent overheating and improve the oxidation resistance during the melting process. Furthermore, Ca addition was thought to be benefit to the grain refinement by influencing the dynamic recrystallization process.Reference Zhang, Wang, Geng and Lu36 In the present study with the same Ca content in these three alloys, the effect of Ca addition on the grain refinement was neglected. As a result, for the present alloys, the average size of dynamic recrystallized grains decreases with increasing the contents of Zn and Y.
It can also be found that the volume fraction of dynamic recrystallization decreases from 89.6% (ZYC-1) to 65.8% (ZYC-2) and then increases to 78.0% (ZYC-3) as the contents of Zn and Y increase. This can be related to the particle-stimulated nucleation of microsized I-phase, segregation of rare-earth element Y, and precipitated nanosized I-phase. For the first, the microsized I-phases contribute to the dynamic recrystallization during the extrusion process by the particle stimulate nucleation. Second, it is reported that rare-earth element could segregate near the grain boundary during the deformation process of the magnesium alloy containing rare-earth element.Reference Basu, Pradeep, Miessen, Barrales-Mora and Al-Samman32,Reference Hadorn, Sasaki, Nakata, Ohkubo, Kamado and Hono34 Shi et al. found that rare-earth element Y segregated near the grain boundaries in the Mg–Y alloy.Reference Shi, Chen and Ke35 The segregation of Y along the grain boundary in the present Mg–Zn–Y–Ca alloy is thought to hinder the mobility of dislocations and grain boundaries through the solute drag effect.Reference Grey and Higgins33,Reference Hadorn, Sasaki, Nakata, Ohkubo, Kamado and Hono34 Besides, the nanosized I-phase can also inhibit the movement of grain boundaries (Fig. 5). Therefore, the microsized I-phase would contribute to the occurrence of dynamic recrystallization, while the segregation of Y element and nanosized I-phase would hinder the dynamic recrystallization. When the contents of Zn and Y increase from ZYC-1 to ZYC-2 alloy, the effect of segregation of Y and nanosized I-phase on the inhabitation of the dynamic recrystallization plays a more important role. By contrast, with further increase in the contents of Zn and Y, as shown in Fig. 4(f), more microsized I-phases formed and some plate-like phases formed in the as-cast condition are elongated along the ED. This can provide more nucleation sites for dynamic recrystallization grains through particle-stimulated nucleation, leading to the volume fraction of dynamic recrystallization increase from ZYC-2 to ZYC-3.
The volume fraction of the nanosized I-phase for the as-extruded ZYC-1, ZYC-2, and ZYC-3 alloys are 1.5%, 2.3%, and 6.9%, respectively. The sizes of the I-phase for the as-extruded ZYC-1, ZYC-2, and ZYC-3 alloys are 104 ± 37, 108 ± 32, and 122 ± 50 nm, respectively. The variation in the size of nanosized I-phase is not significant while the change in the volume fraction is distinct. With increasing the contents of Zn and Y, the amount of grain boundaries increases due to the gradual refinement of the dynamic recrystallized grains. The defects such as vacancy clusters and dislocations are usually distributed along the grain boundaries,Reference Li, Deng, Zhang, Nie and Xu17 indicating that the potential nucleation sites for precipitates would increase as the contents of Zn and Y increase. In this case, the volume fraction of the I-phase increases.
B. Effect of the Zn and Y contents on the texture of Mg–Zn–Y–Ca alloys
In general, after secondary deformation  $\left\langle {11\bar{2}0} \right\rangle$ or
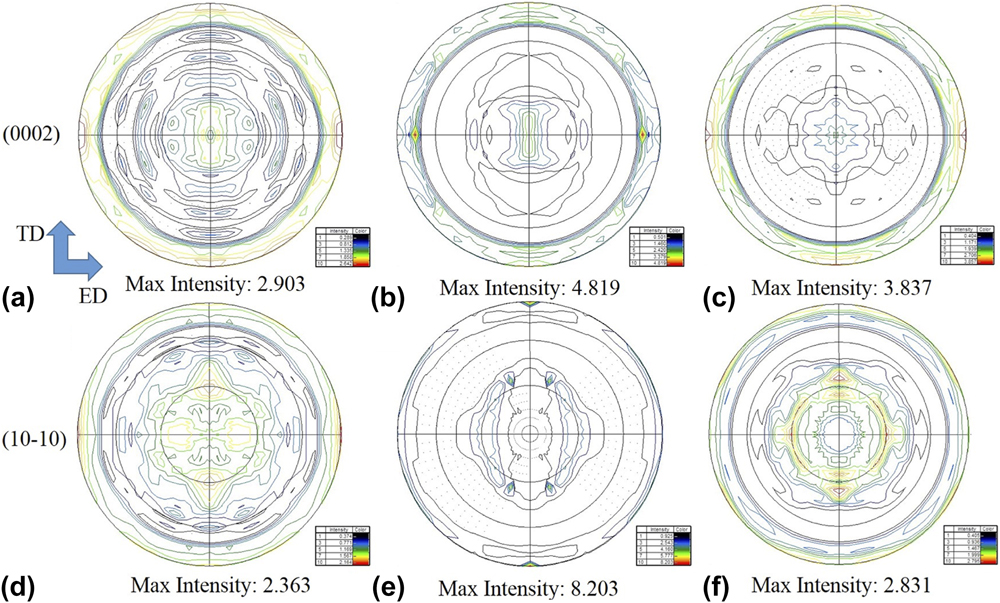
 $\left\langle {10\bar{1}0} \right\rangle$, fiber texture can be observed in the magnesium alloys, which is attributed to the activation of basal slip during deformation, showing an orientation of basal planes toward ED. Figure 7 shows the pole figures of the as-extruded Mg–Zn–Y–Ca alloys. The intensity of the (0002) texture first increases from 2.903 (ZYC-1 alloy) to 4.819 (ZYC-2 alloy) and then decreases to 3.837 (ZYC-3 alloy) with increasing the Zn and Y contents. No obvious basal texture was detected in the present work. This relatively weak texture intensity might be related to the addition of Ca. Ca addition can reduce the fault energy in the Mg–Zn alloy and promote the occurrence of dynamic recrystallization,Reference Zhang, Wang, Geng and Lu36 so the dynamic recrystallized grains tend to distribute uniformly with a random orientation, resulting in the low basal texture intensity for the present Mg–Zn–Y–Ca alloy. Previous research has shown that deformed regions commonly exhibited stronger basal texture intensity than the recrystallization regions.Reference Du, Qiao, Zheng, Wu and Xu26 Because the volume fraction of dynamic recrystallization decreases from 89.6% (ZYC-1) to 65.8% (ZYC-2), more deformed regions in the ZYC-2 alloy lead to the increase in the texture intensity. For the ZYC-3 alloy, the texture intensity is 3.839, which is lower than that of the ZYC-2 alloy. First, the volume fraction of dynamic recrystallization increases from 65.8% (ZYC-2) to 78.0% (ZYC-3), and less deformed regions would decrease the texture intensity. Second, the particle stimulated nucleation was usually considered to result in the randomization of grain orientations in the magnesium alloy.Reference Du, Qiao, Zheng, Wu and Xu26,Reference Du, Zheng, Qiao, Wu, Liu, Wang, Lv, Li, Liu, Wang and Liu37 The amount of microsized I-phase in ZYC-3 is more than that of the ZYC-2 alloy, which was expected to promote dynamic recrystallization and decrease the texture intensity. Third, rare-earth elements were commonly considered to weaken the texture because it can activate the 〈c + a〉 slip and provide nucleation sites for the dynamic recrystallization.Reference Tahreen, Zhang, Pan, Jiang, Li and Chen31,Reference Hantzsche, Bohlen, Wendt, Kainer, Yi and Letzig38 In the present work, the trace addition of Y is thought to play a similar role in texture weakening. As a result, the texture intensity decreases for the ZYC-3 alloy.
Pole figures of the extruded alloys: (a) and (d) ZYC-2, (b) and (e) ZYC-2, and (c) and (f) ZYC-3.

C. Effect of Zn and Y contents on mechanical properties of Mg–Zn–Y–Ca alloys
Both the YS and UTS of the as-extruded alloy is significantly improved compared with that of the as-cast alloys. Meanwhile, the strengths of both as-cast and as-extruded alloys increase with increasing the contents of Zn and Y. The three alloys possess different dynamic recrystallized grain sizes, deformed regions, precipitates, and texture intensities. All the different microstructural characteristics have influence on the strength and ductility. The experimental difference in the YS between as-cast and as-extruded alloys is 250–260 MPa for the ZYC-2 and ZYC-3 alloys, and ∼170 MPa in the ZYC-1 alloy from Sec. III.C.
Grain refinement was an important strengthening way for the magnesium alloy, which can be calculated by the Hall–Petch relationshipReference Xu, Nakata, Qiao, Jiang, Sun, Chi, Zheng and Kamado39,Reference Hofstetter, Ruedi, Baumgartner, Kilian, Mingler, Povoden-Karadeniz, Pogatscher, Uggowitzer and Loffler40 :
 $${\sigma _{\rm{y}}} = {\sigma _{\rm{0}}} + {k_{\rm{y}}}{d^{ - 1/2}}\quad ,$$
where σy is the YS, σ0 is the initial strength of the material, d is the average grain size, and k y is the material constant, which depends on the crystal structure of the material. The value of k y in magnesium alloys is determined as 0.133 MPa/m1/2.Reference De Cicco, Konishi, Cao, Choi, Turng, Perepezko, Kou, Lakes and Li41 The increment due to grain refinement in the YS between as-cast and as-extruded alloys can be estimated by the following equation:
 $${\sigma _{{\rm{gbs}}}} = {k_{\rm{y}}}\left( {d_{{\rm{as ‐ cast}}}^{ - 1/2} - d_{{\rm{as ‐ extruded}}}^{ - 1/2}} \right)\quad .$$
The calculating result due to grain boundary strengthening is about 135 MPa for the ZYC-2 and ZYC-3 alloys and about 85 MPa for the ZYC-1 alloy.
Additionally, the addition of Zn and Y resulted in the presence of the fine I-phase, which could pin the grain boundaries and hinder the movement of dislocation during deformation. This Orowan strengthening can be associated with the precipitates, which is given by the following equationReference Ma, Wen, Hu, Topping, Isheim, Seidman, Lavernia and Schoenung42,Reference Khan and Panigrahi43 :
 $${\sigma _{{\rm{Orowan}}}} = M{{Gb} \over {2\pi \sqrt {1 - \upsilon } }}{1 \over {\bar{d}\left( {\sqrt {{\pi \over {4f - 1}}} } \right)}}\ln {{\bar{d}} \over b}\quad ,$$
where M represents the strengthening coefficient and the value is 1.25, G is the shear modules of the Mg matrix (16.6 GPa), b is the Burger vector (0.32 nm), υ is the Poisson’s ratio,  $\bar{d}$ is the average size of the nanoscale ellipsoidal I-phase, and f is the volume fraction of precipitates. The calculated values of σOrowan for ZYC-1, ZYC-2, and ZYC-3 alloys are 37, 34, and 28 MPa, respectively.
The as-extruded alloys contained different volumes of deformed region with varied basal texture intensity. Such a texture was unfavorable for basal slip, which is the easiest activation slip system. A higher stress was required to activate prismatic or pyramidal slip systems. So the formation of texture is thought to contribute to the YS along the deformation direction.Reference Hono, Mendis, Sasaki and Oh-ishi10,Reference Kang, Sun, Deng, Xu, Zhang and Bai18 This texture strengthening can be expressed by the following equationReference Rao and Prasad44:
 $${\sigma _{{\rm{ts}}}} = m{\tau _0}\quad ,$$
where m is the orientation factor which is related to the basal texture and τ0 is the critical resolved stress. The value of m is 6.5 times the texture intensity for the Mg alloy.Reference Cheng, Tian, Yu, Zhang and You45,Reference Wang, Deng, Nie, Shang and Liang46 The calculated values of σts for ZYC-1, ZYC-2, and ZYC-3 alloys are 44, 72, and 58 MPa, respectively.
Moreover, dislocation strengthening also plays an important role in strength increment. The deformed region in the ZYC-2 and ZYC-3 alloys is about 20%, and the YS increment due to dislocation strengthening can be expressed by the following equation:
 $${\sigma _{{\rm{ds}}}} = {\sigma _{0.2}} - {\sigma _{{\rm{gbs}}}} - {\sigma _{{\rm{Orowan}}}} - {\sigma _{{\rm{ts}}}}\quad .$$
Accordingly, the dislocation strengthening σds for ZYC-2 and ZYC-3 alloys can be estimated as around 20–30 MPa and decreases to about 4 MPa for the ZYC-1 alloy. Based on the above facts, grain boundary strengthening is the dominant strengthening mechanism for the ZYC-2 and ZYC-3 alloys, while the Orowan strengthening and texture strengthening play relatively minor role. Furthermore, as mentioned in Sec. III.C, the strength of the as-cast ZYC-1 alloy is comparable to that of the ZYC-2 alloy, whereas the strength of the as-extruded ZYC-2 alloy is significantly increased compared with the ZYC-1 alloy. It can be mainly attributed to the grain boundary strengthening and dislocation strengthening based on the calculating results above. With the contents of Zn and Y increase from ZYC-1 to ZYC-2 alloy, both the effect of particle-stimulated nucleation of the microsized I-phase and pinning effect of the nanosized I-phase lead to the significant refinement of dynamic recrystallized grains as mentioned in Sec. III.B. Besides, the higher volume fraction of the microsized I-phase particle in ZYC-2 causes higher dislocation density in the extrusion process because of the uncoordinated deformation between the nanosized I-phase with the matrix. Thus, there is a significant increment in dislocation strengthening from ZYC-1 to ZYC-2. With further addition of Zn and Y, dislocation strengthening further increases owing to the formation of more microsized I-phases. As a result, though the texture strengthening is higher for the ZYC-2 alloy compared with the ZYC-3 alloy as mentioned in Sec. IV.B, the YS of both the ZYC-2 and ZYC-3 alloys is almost the same. Therefore, the mechanical properties of the present Mg–Zn–Y–Ca alloy first increase dramatically and then change inconspicuously.
D. Fracture
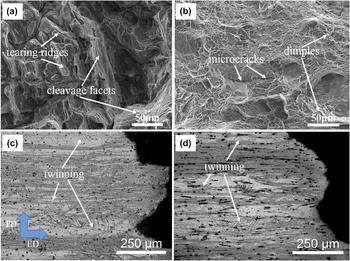
The SEM images of the fracture surface and OM images near the fracture surface of the as-cast and as-extruded Mg–Zn–Y–Ca alloys are given in Fig. 8. Tearing ridges and large cleavage exist in the as-cast alloy [Fig. 8(a)], indicating a typical cleavage fracture. By contrast, a large amount of dimples as well as some microcracks appear on the fracture surface for the as-extruded alloy [Fig. 8(b)]. As shown in Figs. 8(c) and 8(d), the size and area of twinning in the as-extruded alloy increase as the contents of Zn and Y increase. This indicates a mixture fracture of dimple fracture and cracking along the twinning with the increment of Zn and Y content for the as-extruded alloy. Besides, the retained deformed region with high dislocation density was detrimental to the ductility improvement because of its poor ability to accommodate newly generated dislocations. Thus, the as-extruded Mg–Zn–Y–Ca alloy exhibited a reduced EL with increasing the contents of Zn and Y. It should also be noticed that the as-extruded ZYC-2 and ZYC-3 alloys contain some microsized I-phases oriented toward ED. The microsized I-phases would result in high stress concentration during tensile deformation and become the preferred sites for the crack source,Reference Xu, Zheng, Kamado, Wu, Wang and Lv47,Reference Zhang, He, Du and Yang48 which gave rise to the reduction of ductility. The amount of microsized I-phase in the ZYC-3 is more than that of ZYC-2, but the as-extruded ZYC-2 alloy shows a comparable ductility with that of the ZYC-3 alloy. This indicates that these second phases are not the main factor influencing the ductility.
SEM images of the fracture surface for (a) as-cast and (b) as-extruded ZYC-2 alloys; OM images near the fracture surface of as-extruded (c) ZYC-2 and (d) ZYC-3 alloys.

V. CONCLUSIONS
In this study, three Mg–Zn–Y–Ca alloys with different contents of Zn and Y have been designed to form different volume fractions of I-phases for the purpose of high performance. Microstructures and mechanical properties of the as-cast and as-extruded Mg–Zn–Y–Ca alloys have been discussed. The main conclusions can be summarized as follows:
(1) The second phases of both the as-cast and as-extruded Mg–Zn–Y–Ca alloys are identified as the I-phase. The microsized phases are in the particle-like or plate-like for the as-cast alloy, and all the nanosized phases are in the particle-like for the as-extruded alloy.
(2) The average size of dynamic recrystallized grains decreases gradually while the volume fraction does not change monotonously. The variation is related to the particle stimulated nucleation by the undissolved microsized I-phase and the pinning effect of nanosized I-phase on the grain boundaries or dislocation.
(3) The intensity of the basal texture first increases and then decreases with increasing the Zn and Y contents. The evolution of the basal texture is ascribed to the activation of 〈c + a〉 slip, the promotion of dynamic recrystallization, and the appearance of deformed regions.
(4) The as-extruded ZYC-3 alloy exhibits superior mechanical properties with YS of 294.0 MPa, UTS of 337.5 MPa, and a moderate EL of 10.6%. The improvement in the mechanical properties from ZYC-1 to ZYC-2 alloy is mainly due to grain boundary strengthening and dislocation strengthening.
ACKNOWLEDGMENTS
This work was supported by the National Natural Science Foundation of China [Grant Nos. 51771129, 51401144, and 51771128]; the Natural Science Foundation of Shanxi [Grant Nos. 2015021067 and 201601D011034]; and the Projects of International Cooperation in Shanxi [Grant No. 201703D421039].