


1. Introduction
The fluid dynamics of porous bluff bodies has received considerable interest for over a century as it is relevant to both the natural environment (e.g. flows through seaweed beds) and various engineering applications (e.g. parachutes and aerodynamic dampers). With the growth of the wind energy industry, porous bluff-body research has gained additional momentum. This is due to the need to model the flow velocities seen by the rotor blades, typically done through the blade element momentum (BEM) framework, which essentially treats the rotor as a porous object from a momentum perspective.
In the case of horizontal-axis wind turbines (HAWTs), BEM treats the rotor as a thin porous disk (Hansen Reference Hansen2008). Similarly, vertical-axis wind turbines (VAWTs) are often represented as a superposition of several porous flat plates, through the multiple streamtube approach (Paraschivoiu Reference Paraschivoiu1988; Ayati et al. Reference Ayati, Steiros, Miller, Duvvuri and Hultmark2019). However, the latter treatment has been criticized for neglecting the synergistic interactions of the porous plates (Ferreira et al. Reference Ferreira, Madsen, Barone, Roscher, Deglaire and Arduin2014). Instead, a more physical representation of the flow field around a VAWT has been proposed as a single porous cylinder (see e.g. Ning Reference Ning2016). Since BEM models fundamentally relate the forces acting on a porous object to the forces experienced by the turbine blades, they rely on an accurate characterization of the drag on porous plates and cylinders.
In the case of flat disks and plates, numerous experimental and theoretical studies have long established that drag decreases with increasing porosity (Taylor Reference Taylor1944; Castro Reference Castro1971; Koo & James Reference Koo and James1973; Graham Reference Graham1976; Steiros & Hultmark Reference Steiros and Hultmark2018). In contrast, literature on porous cylinders is much more sparse. In one of the few existing works, Alridge, Piper & Hunt (Reference Alridge, Piper and Hunt1978) compared the drag on a solid hollow cylinder to that on a homogeneously porous one of 60 % porosity and saw an increase of approximately 20 % in the drag force on the porous cylinder. This observation was attributed to an effective increase of the flow resistance, as it was hypothesized that the flow is hindered by two walls (front and back halves of the porous cylinder) instead of only one (one solid cylinder). This led them to the conclusion that perforation of a solid body increases its drag. However, it should be noted that Alridge et al. (Reference Alridge, Piper and Hunt1978) calculated the drag on the cylinder by estimating the drag on its supporting structures, and then subtracting it from the total drag. As such, the measurements have relatively large experimental uncertainty.
A few other studies of similar flow configurations have supported the above observations. Osgood (Reference Osgood2000) measured the drag of hollow cylinders of varying porosity when subjected to a sinusoidally oscillating flow. It was found that, for these flow conditions, porosity can increase the drag by up to an order of magnitude. Taddei, Manes & Ganapathisubramani (Reference Taddei, Manes and Ganapathisubramani2016) measured the drag of a cylinder of varying porosity subjected to an incoming boundary layer flow. The cylinder in this case was filled with material (solid or porous) so as to resemble a canopy patch, in contrast to the aforementioned studies, where material was positioned only in the cylinder periphery. Porous patch cases were found to exhibit larger drag values compared to the solid cylinder case. Jones et al. (Reference Jones, Horvarth, Stainback, Beasley and McGhee1987) performed experiments of both solid and perforated hollow cylinders at supercritical Reynolds numbers and showed that some types of perforation located along the side of the cylinders can increase the drag coefficient.
The above literature review suggests a counterintuitive phenomenon: keeping all else constant, perforation (and thus removal of material) seems to increase the drag of three-dimensional bluff bodies, contrary to what occurs in flat plates and disks. If this is the case, the consequences for BEM modelling could be significant; VAWT models, which are based on rows of flat plates, would need to be revisited, as they predict a decreasing drag with increasing porosity. However, as stated above, the above studies are not conclusive, as they were prone to experimental inaccuracies (Alridge et al. Reference Alridge, Piper and Hunt1978) or considered special flow conditions that are not representative of VAWTs (Jones et al. Reference Jones, Horvarth, Stainback, Beasley and McGhee1987; Osgood Reference Osgood2000; Taddei et al. Reference Taddei, Manes and Ganapathisubramani2016).
The objective of this study is to determine whether, and under which conditions, perforation can increase the drag of cylinders/bars. To achieve this, the drag of infinite-aspect-ratio objects with both square and circular cross-sections (see figure 1), as well as of the wall sections comprising them, is characterized.
The (a) square bars and (b) circular cylinders investigated in this study. The open area ratio  $\beta$ varied from 0 to 60 %, while the characteristic dimension (width or diameter) increased with
 $\beta$ in order to maintain constant blockage in the water channel.

2. Methodology
2.1. Experimental set-up
Experiments were performed in a water channel with a 2.44 m long, 0.46 m wide and 0.27 m deep test section. The tested models were placed perpendicular to the flow and were attached to a load cell (ATI Mini 40) where force measurements were acquired with a resolution of  $5 \times 10^{-3}$ N (see figure 2). Finite-aspect-ratio flow effects were suppressed by positioning the models as close to the water channel floor as possible (leaving approximately a 1 mm gap), and by extending the model outside of the water surface.
Schematic of the measurement set-ups for (a) square bars and (b) circular cylinders, with the parts attached to the load cell (LC) highlighted in orange.

All models were machined out of 6061 aluminium, in which holes of different sizes allowed the open area ratio  $\beta =A_p/A$ (porous surface area divided by gross surface area) to vary from 0 to 60 %. Cylinders with circular cross-sections as well as bars with square cross-sections were tested (see figure 1), along with the plates that comprised them (i.e. flat plates or two semicircular porous plates). The square bars were manufactured by water jetting holes on flat plates, and then mounting them together to construct a box (key dimensions shown in table 1). In that way, the contribution of the front or rear plates to the total drag could also be measured by disassembling them from the box and connecting them to the load cell, while still keeping them very close (leaving a submillimetre-sized gap) to their original position (see figure 2). The cylinders were made from standard piping machined to size (see figure 1 and table 1), in which holes were drilled perpendicular to the surface. Subsequently, they were cut in half to produce two semicircular porous plates, enabling independent drag measurements of convex or concave semicircular plates (see figure 2). Note that, in this case, the semicircular plates were measured on their own, i.e. the other half-cylinder was removed.
Geometrical characteristics of the tested bars/cylinders:  $\beta$ is the open area ratio,
 $w_t$ the width of the bar/cylinder,
 $d$ the diameter of the hole and
 $b$ the blockage ratio.

In some cases, a splitter plate extending 210 mm in the streamwise direction was positioned in the wake of the models, in order to suppress vortex shedding. The length of the splitter plate was always more than five times the characteristic dimension of the object being tested (width or diameter), which is sufficient to suppress the drag-enhancing effect of vortex shedding (Apelt & West Reference Apelt and West1975).
The data are presented without blockage correction, as the latter can potentially bias the findings. The blockage correction presented by Maskell (Reference Maskell1965) is not valid for porous bodies, as it assumes zero wake velocities, while various corrective models based on actuator disks (Bahaj et al. Reference Bahaj, Molland, Chaplin and Batten2007; Werle Reference Werle2010), often used in wind engineering, are not valid for cases where the bluff-body porosity is small. A recent review of blockage correction models can be found in Ross & Polagye (Reference Ross and Polagye2020). Although blockage will affect the magnitude of the drag coefficients, care was taken such that it would not alter the trends or the conclusions of the study.
Since it was deemed that no blockage correction would be appropriate for this specific investigation, the blockage ratio was kept approximately constant for all tests. The blockage ratio is defined here as  $b = A_s/A_T$, where
 $A_s$ is the projected solid area of the bluff body and
 $A_T$ is the cross-sectional area of the water channel. For the square bars, it was kept to 6.5 % by altering both the width,
 $w_t$, and the drilled hole size,
 $d$. For the cylinders, given the availability of standard pipe sizes,
 $b$ was kept between 5.3 % and 6.3 % (see table 1). It is noted that, in the wind turbine literature, blockage ratio is defined differently, i.e. as the gross turbine area over the channel area. This choice is a reflection of the effect of the rotational speed of the turbine, which, if very large, renders the turbine similar to a solid disk. In the present non-rotating case, such a blockage ratio definition would be rather unphysical.
The free-stream velocity was  $U_\infty = 0.2\ \textrm {m}\,\textrm {s}^{-1}$ for all cases, yielding an ‘effective’ Reynolds number
 $Re={U_\infty (1-\beta )w_t}/{\nu }=6000$ for the square bars and
 $3864 \leq Re\leq 5344$ for the circular cylinders (subcritical regime), where
 $w_t$ is either the plate width or the cylinder diameter, and
 $\nu$ is the kinematic viscosity of water. Here, the subcritical regime is defined as one where the separation point occurs before the flow transitions to turbulence in solid cylinders.
All acquired drag force measurements are presented in non-dimensional form as  $C_D= {D}/\frac {1}{2}{\rho U_\infty ^2hw_t}$, where
 $D$ is the time-averaged drag force measured by the load cell,
 $\rho$ is the density of water and
 $h=270$ mm is the height of water in the channel (see figure 2).
2.2. Numerical simulations
For a few selected cases, large-eddy simulations (LES) were performed in order to visualize the flow field and gain a better understanding of the wake dynamics. A second-order central differencing scheme was used for the convective terms, along with a second-order backward scheme for time discretization. The Smagorinsky subgrid-scale model was used to describe the unresolved scales. The computational domain had a size of  $30 w_t \times 17.25 w_t \times 3 w_t$ in the streamwise, normal and spanwise directions, respectively (the extent of the domain in the normal direction corresponded to the width of the water channel in the present experiments). Laminar inflow was imposed at the upstream boundary, a zero-gradient condition for velocity at the outlet, and no-slip conditions on the cylinder and the channel boundaries. Periodicity of the flow was imposed in the spanwise direction. The domain was discretized with
 $\simeq 3.0\times 10^6$ and
 $\simeq 3.8 \times 10^6$ elements in the solid and perforated cases, respectively (the latter also including the region inside the cylinder). In all cases,
 $48$ cells were used along the span. Simulations were advanced in time with a time step equal to
 ${\rm \Delta} t = 0.0015w_t/U_\infty$ s. Data were extracted over a non-dimensional time period corresponding to
 $t^* = tU_\infty /w_t \simeq 225$ flow times. Validation of the numerical simulations can be found in the appendix.
3. Results and discussion
3.1. Square bars
As mentioned in the introduction, it is known that the drag on the individual building blocks of the square bars, i.e. porous flat plates, decreases with porosity (Castro Reference Castro1971; Graham Reference Graham1976). Pursuing this work, an investigation of the flow field over multiple plates, comprising the bar, has been undertaken in order to verify the opposite drag trend claimed by Alridge et al. (Reference Alridge, Piper and Hunt1978) for porous three-dimensional bluff bodies, and to elucidate whether exposing the rear plate to a flow leads to increased drag.
In figure 3(a), the measured drag coefficient of the porous cylinders is plotted against their open area ratio. In contrast to the observations of Alridge et al. (Reference Alridge, Piper and Hunt1978), the current drag measurements indicate a continuously decreasing trend with porosity. The~experiments were conducted three independent times for porosities  $\beta =0$ and 20 %. The measured standard deviations of these three runs were smaller than the symbol size in the graph (equivalent to
 ${\pm }1.45\,\%$ and
 $0.15\,\%$, respectively).
(a) Drag coefficient of entire square bar for various porosities (w, with; w/o, without). (b) Drag coefficient of front and rear plates, their sum, along with that of the entire bar. (c) Drag coefficient of rear plate plotted against the rear plate porosity, while the porosity of the remainder of the bar is maintained at  $\beta =30\,\%$.

To further investigate the observed trend in drag force, a splitter plate was positioned in the wake of the bars of open area ratio  $\beta \le 20\,\%$. Splitter plates are known to cancel the drag-enhancing effect of vortex shedding (Roshko Reference Roshko1955; Apelt & West Reference Apelt and West1975), which can bias the observed trends. The measured drag values displayed in figure 3(a) show that, when a splitter plate is present, drag decreases for the
 $\beta < 20\,\%$ case, but remains almost unaltered for
 $\beta =20\,\%$. A similar phenomenon occurs in porous flat plates, where for open area ratio values larger than
 $\beta \approx 20\,\%$ the fluid bleeding from the plate acts as an effective splitter plate (Castro Reference Castro1971; Steiros & Hultmark Reference Steiros and Hultmark2018). The above suggest that the effect of a splitter plate on the drag is negligible for
 $\beta \ge 20\,\%$, rendering its use superfluous. It is noteworthy to mention that a sufficiently large splitter plate, or sufficiently large bleeding, does not completely suppress shedding as is often assumed in the literature (Castro Reference Castro1971; Roshko Reference Roshko1993). The shear layers are still unstable and will eventually interact to create von Kármán-like coherent structures (Apelt & West Reference Apelt and West1975; Huang, Kawall & Keffer Reference Huang, Kawall and Keffer1996). However, the vortex coherence will be significantly weaker, while the vortex formation occurs far enough from the rear of the body such that the drag force is unaffected.
Inspecting the drag values with the splitter plate, it can be observed that the drag coefficient reaches a plateau at low porosities. Without a splitter plate, no such plateau can be observed. This is due to base suction introduced by the destabilization of the wake. A similar behaviour is observed for the circular cylinders (see § 3.2), where a slight increase in drag is observed with increasing porosity, as long as the shedding is suppressed using a splitter plate.
In order to study the mechanism of drag production on porous objects, the drag composition on the separate faces of the bar is investigated. Alridge et al. (Reference Alridge, Piper and Hunt1978) postulated that the front and rear plates are subjected to the same conditions, and thus produce the same drag. In that way, a ‘doubling’ of the drag would occur when the cylinder was rendered porous, which could potentially generate an increase of the drag of porous cylinders compared to the solid case.
To test the above postulation, an experiment was devised where one of the four porous plates comprising the bar (front or rear) was disconnected from the other three, and attached to the load cell (see illustration in figure 2). The remaining sides of the bar were positioned as close to the plate as possible, exercising caution not to touch the plate. In that way, the individual contributions of the front and rear plates were able to be measured.
The results are plotted in figure 3(b). It is evident that the drag contributions of the two plates are not equal, with the front plate accounting for the vast majority of the drag force. This highlights that porous objects must be treated as systems, and not as a superposition of two non-interacting plates with equal contributions. In fact, the rear plate contribution remains relatively small and, for higher porosities, the drag on it remains insensitive to its own, and the entire bar's, porosity. To investigate the extent of this feature, the drag of rear plates with varying porosity was tested, keeping the porosity of the remaining sides constant at  $\beta =30\,\%$. The results, shown in figure 3(c), suggest that the rear plate drag can be separated into two approximately linear regions: (i) for
 $\beta \ge 30\,\%$, the drag is relatively insensitive to the change of rear porosity; (ii) for
 $\beta \le 30\,\%$, the drag is much more sensitive to changes in porosity. This change in slope is abrupt, suggesting the sudden introduction of new physics, and occurs when the rear plate porosity equals the porosity of the other plates comprising the square bar (i.e.
 $\beta = 30\,\%$). This phenomenon could be of interest to wind farm aerodynamics, where rows of wind turbines might create similar dynamics (Newman Reference Newman1986).
3.2. Circular cylinders
The main conclusion of the above study is that the drag of three-dimensional bluff bodies is not, in general, higher when porosity is introduced, in contrast to what was postulated by Alridge et al. (Reference Alridge, Piper and Hunt1978). However, it must be noted that the aforementioned authors investigated circular cylinders, where a drag increase may still exist with porosity, as they have two fundamental differences from square bars: (i) they do not induce immediate and fixed separation, due to their round shape; and (ii) their building blocks are porous semicircular plates whose drag has not been characterized, and whose dependence on porosity is not yet known. For the above reasons, the drag on both circular cylinders and semicircular plates of varying porosity is characterized below.
In figure 4(a), the measured drag coefficient of porous circular cylinders is shown against their open area ratio. Similarly to what was observed for the square bars, the maximum drag value corresponds to the solid case. As such, the drag on a cylinder does not increase when homogeneous perforation is introduced, under steady conditions. A slight increase in drag with porosity is only possible if vortex shedding, present at low porosity values, is suppressed with the use of a splitter plate (see figure 4a), similar to what was observed for square bars.
(a) Drag coefficient of entire circular cylinder for various porosities. (b) Drag coefficient of convex and concave surfaces, along with that of the entire cylinder.

In figure 4(b), the drag of the two sides of a semicircular plate (convex and concave) is plotted against their open area ratio. Three conclusions can be made from these data: first, the drag of semicircular porous plates decreases when porosity is introduced, similarly to the drag on flat plates. Second, the front and back sides of the semicircle generate drastically different drag; for  $\beta$ lower than 50 %, the concave plate produces increasingly more drag than the convex plate, reaching double the drag at
 $\beta =0\,\%$. Third, the convex plate generates almost the same drag as the full cylinder, for all tested porosities. The small difference between the convex plate and the full cylinder indicates that the rear half of the cylinder only has a small effect on the total cylinder drag. These results will be discussed more thoroughly in the next section.
3.3. Discussion
From the above results, it may be concluded that cylinder drag drops, in general, with perforation, when considering a steady flow. However, this statement is only partially correct, as it applies only when perforation is homogeneously distributed along the cylinder periphery. In fact, the above results suggest a type of perforation that can drastically increase the drag on a circular cylinder: if material is only removed from the front semicircle of the cylinder, the flow will increasingly resemble that around a concave plate. At the limit where the entire front semicircle is removed, leaving behind a solid concave plate and resulting in a 50 % total cylinder perforation, the drag on the surface would be twice that of the whole solid cylinder, as shown in figure 4(b).
Such inhomogeneous perforations along the front part of the cylinder can therefore increase the cylinder drag by making the rear part relevant. On the other hand, homogeneous perforation of a cylinder decreases its drag, because, as shown in figures 3 and 4, a homogeneously perforated cylinder shares many flow features with only the front half-cylinder, while the effect of the rear plate is secondary. This occurs because the front porous part does not allow enough flow to pass through it for the rear porous part to produce significant drag, in contrast to the postulation of Alridge et al. (Reference Alridge, Piper and Hunt1978). This is supported by figure 3(c), where it is shown that the rear plate drag is negligible and largely insensitive to changes in its porosity, as long as its open area ratio is equal to or larger than that of the total cylinder.
Another type of perforation that may increase the drag of a cylinder is when holes are positioned at the cylinder sides (i.e. the axes of the holes are perpendicular to the flow) (Jones et al. Reference Jones, Horvarth, Stainback, Beasley and McGhee1987). The reason for this is not trivial, but it is likely to be related to changes in the wake structure and modifications of the shed vortices due to the influence of the holes on the boundary layer separation and shear layer formation. To test this hypothesis, drag measurements were performed on both circular cylinders and square bars with perforations present only on the surface approximately tangential to the flow (figure 5a). Presumably, the effect of the side holes on the drag is more prominent for circular cylinders than for square bars, as the separation point is fixed by the sharp edges of the latter, and thus cannot be significantly influenced by the presence of side holes.
(a) The side-perforated circular cylinders that were tested. (b) Drag coefficient normalized by its value for the fully solid case  $(C_{D0})$ versus open area ratio for square bars and circular cylinders with side perforations.

Figure 5(b) shows the drag coefficient of the side-perforated bars and cylinders, normalized by the drag coefficient of the corresponding solid case. The relatively small open area ratio values in the graphs are due to the fact that the front and rear surfaces of the cylinders remain solid; in fact,  $\beta =50\,\%$ for the square bars corresponds to the side plates being completely removed, while the
 $\beta =26\,\%$ slotted cylinder had five slots which covered an approximately
 $49^\circ$ polar angle. In agreement with Jones et al. (Reference Jones, Horvarth, Stainback, Beasley and McGhee1987), the drag of the circular cylinders increases when side porosity is introduced, reaching a maximum increase at
 $\beta =5\,\%$. On the other hand, the drag of square bars is much less sensitive to side perforation, with only a small increase around
 $\beta \approx 10\,\%$.
These results indicate that side perforations can significantly alter the properties of the shear layers, and thus the shed vortices. To test this idea further, LES were conducted. Two cases were considered: the first corresponded to a solid circular cylinder (i.e.  $\beta =0\,\%$) and the second to a hollow circular cylinder of
 $\beta =26\,\%$, with two uniform side slots that spanned the whole cylinder length. Drag was found to increase with perforation by approximately 20 %, in qualitative agreement with the current experimental results.
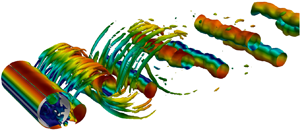
Visualization of the instantaneous flow field using the  $Q$-criterion (Hunt, Wray & Moin Reference Hunt, Wray and Moin1988) (see figure 6a,b) reveals that the reason behind the drag increase is a change of the flow structures in the wake, when side perforations are introduced. The shed vortices increase in coherence and become two-dimensional, while their formation location moves closer to the rear side of the cylinder. This results in a decrease of the base pressure (see figure 6c) and a drag increase. Visual observation indicates that the vortex organization might be connected to an alternating suction–blowing effect from the side holes, which is synchronized with vortex shedding. These observations are supported by a high correlation between the pressure at the slots and that in the vortex formation region on the other side of the cylinder, with a typical correlation coefficient value of 0.7. Similar dynamics have been identified in the past for solid cylinders with small slits along the sides, used for boundary layer control (Igarashi Reference Igarashi1978).
Instantaneous  $Q=100$ contours, coloured by velocity magnitude, at (a)
 $\beta =0\,\%$ and (b)
 $\beta =26\,\%$. (c) Mean pressure coefficient,
 $\overline {C_p}$, along the wake centreline, midspan.

4. Summary and conclusions
This study presents an investigation of drag modifications due to porosity of square bars and circular cylinders under steady laminar inflow, where various types of porosity are introduced. The results contradict earlier postulations on the topic, as it is found that the drag on homogeneously perforated cylinders decreases with the open area ratio. The reason for this decrease is twofold: first, the aerodynamics of homogeneously porous circular cylinders is similar to that of their front half, while the rear half has only a marginal effect in drag production; and second, homogeneous perforation has a similar effect as a splitter plate, cancelling the drag-enhancing effects of vortex shedding.
However, for inhomogeneously distributed porosity, the aforementioned two effects of porosity can be mitigated (or even reversed). Large front perforations can increase the drag by making the rear part of the object increasingly relevant. Additionally, side perforations can increase the coherence of the shed vortices, and thus the cylinder drag. These observations may aid the design of aerodynamic dampers or other devices where bluff-body drag is desirable.
Acknowledgements
The authors would like to thank D. Hoffman and M. Fan for their help with the measurements. This work was partially funded by the Andlinger Center for Energy and the Environment, and the National Science Foundation under grant CBET-1652583.
Declaration of interests
The authors report no conflict of interest.
Appendix. LES validation
For the validation of the LES, the flow past a solid circular cylinder at Reynolds number  $Re=3900$ was computed. Results are compared against the experimental data of Lourenco & Shih (1993 data sourced from Breuer (Reference Breuer1998)) and Ong & Wallace (Reference Ong and Wallace1996). Figure 7 shows the mean streamwise velocity along the wake centreline and the profiles of the streamwise and normal fluctuations at a cut in the near wake (at a distance equal to
 $x/ w_t=1.54$, where
 $x/ w_t=0$ is the centre of the cylinder). The numerical predictions compare well with the experimental data. The computed drag and base pressure coefficients (averaged over the same time period) were
 $\overline {C_D} = 1.00$ and
 $\overline {C_{p,b}} = -0.89$, respectively, in excellent agreement with results in the literature (Breuer Reference Breuer1998).
(a) Mean streamwise velocity along the wake centreline. (b) Streamwise velocity fluctuations at  $x/w_t=1.54$. (c) Normal velocity fluctuations at
 $x/w_t=1.54$.



